One thought on “JAXA Global Ice Extent – as of 2016-112”
Thanks for the effort you have put into this graph.
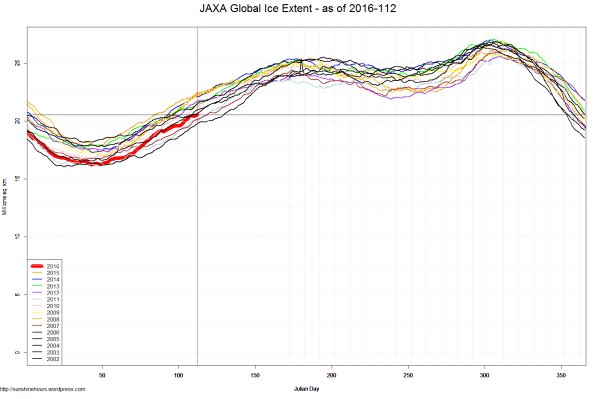
Some readers, including me, may find it difficult to associate the dates with the lines based on colors. Is it feasible to add numbers?
Or to plot a second graph to show just four years: the current year, the median year, the extreme high and extreme low year, based on the level of ice in the minimum month?

Thanks for the effort you have put into this graph.
Some readers, including me, may find it difficult to associate the dates with the lines based on colors. Is it feasible to add numbers?
Or to plot a second graph to show just four years: the current year, the median year, the extreme high and extreme low year, based on the level of ice in the minimum month?
Or some such easily viewed graph?