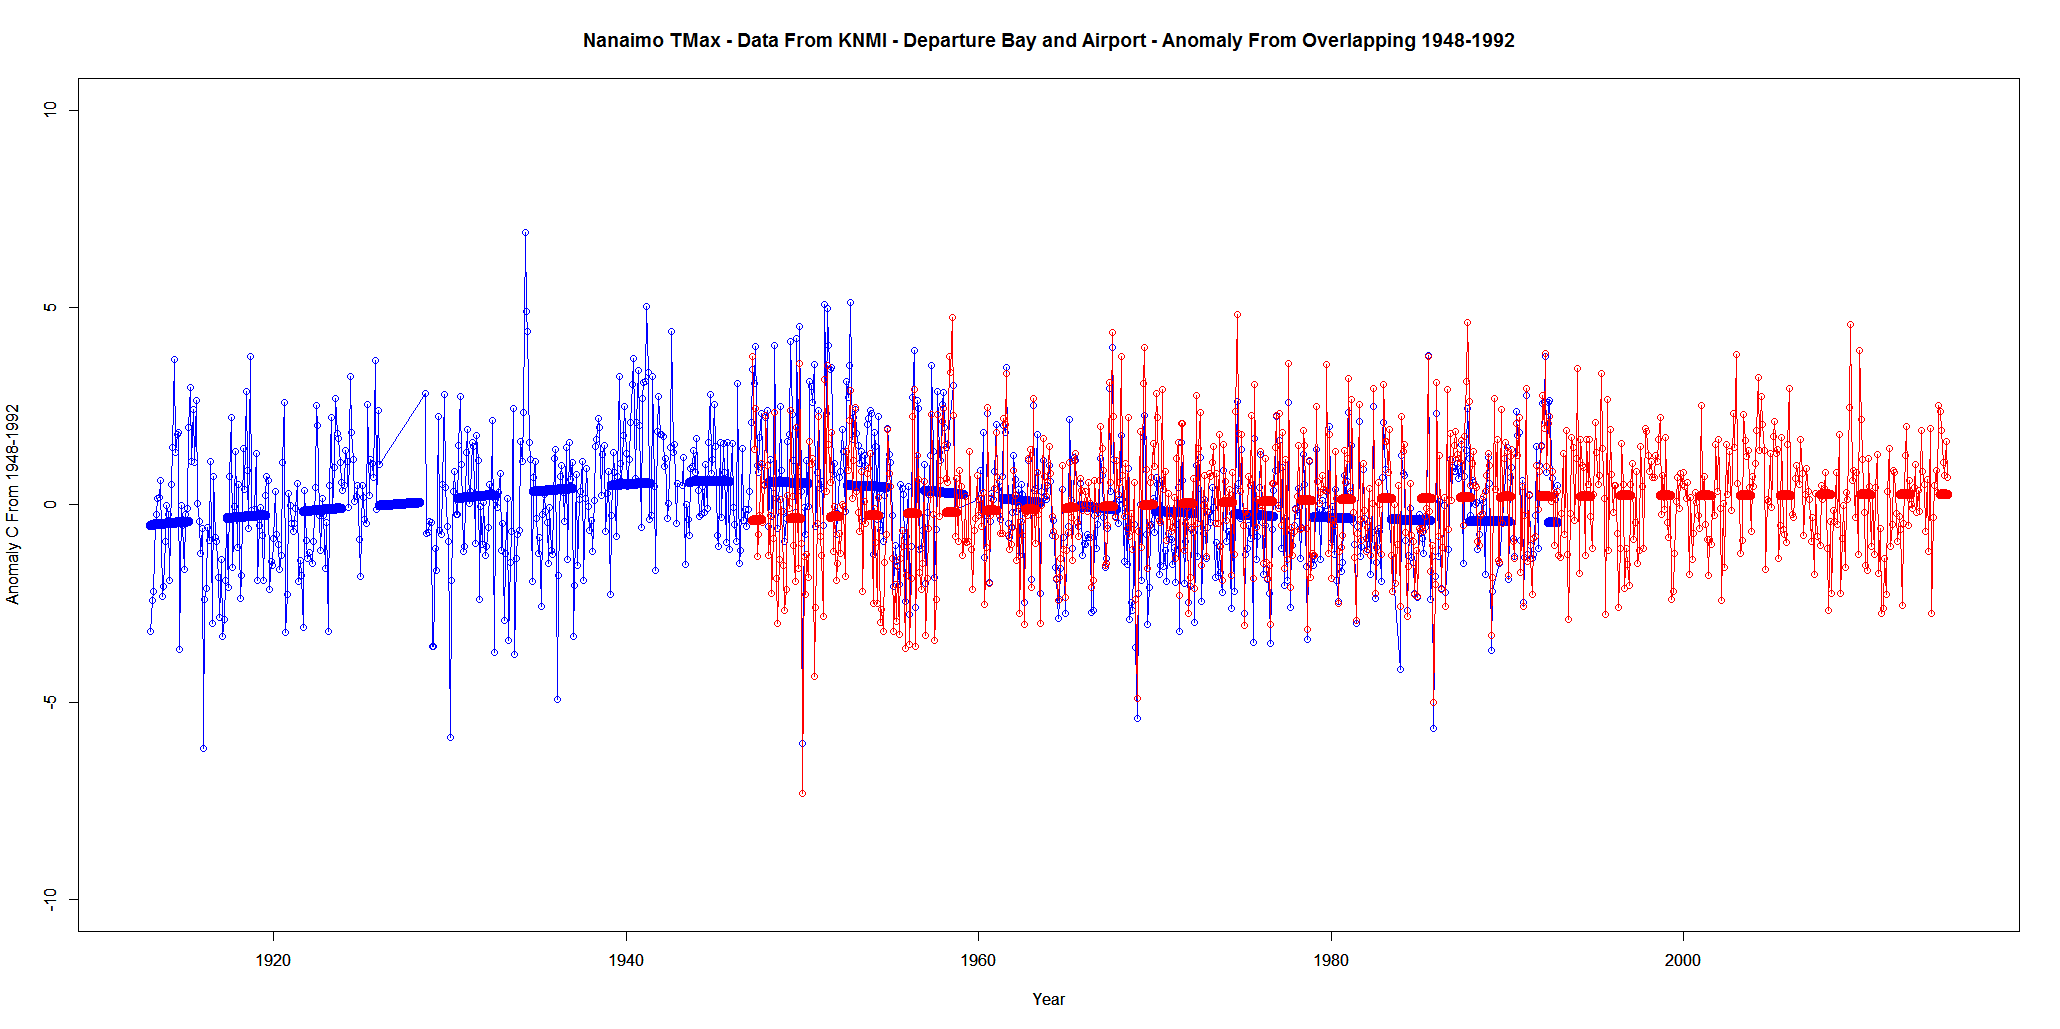
Every once in a while I visit the data for the weather station closest to my hometown on the west coast of Canada.
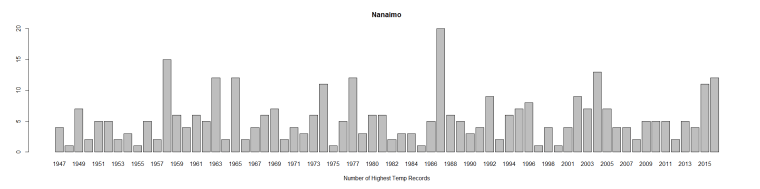
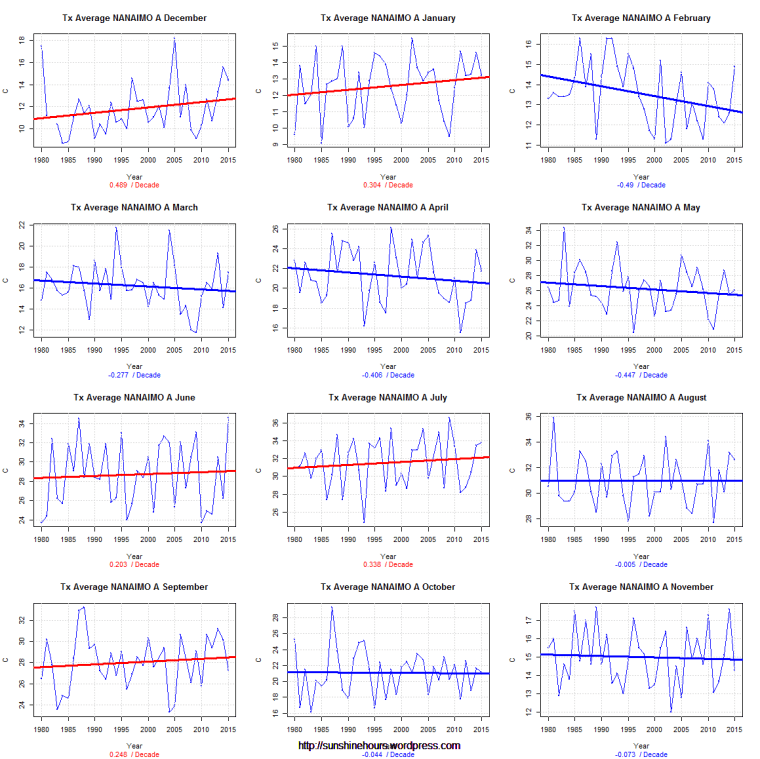
Today I am looking at daily TMAX data from Nanaimo Airport (1947 – 2015).
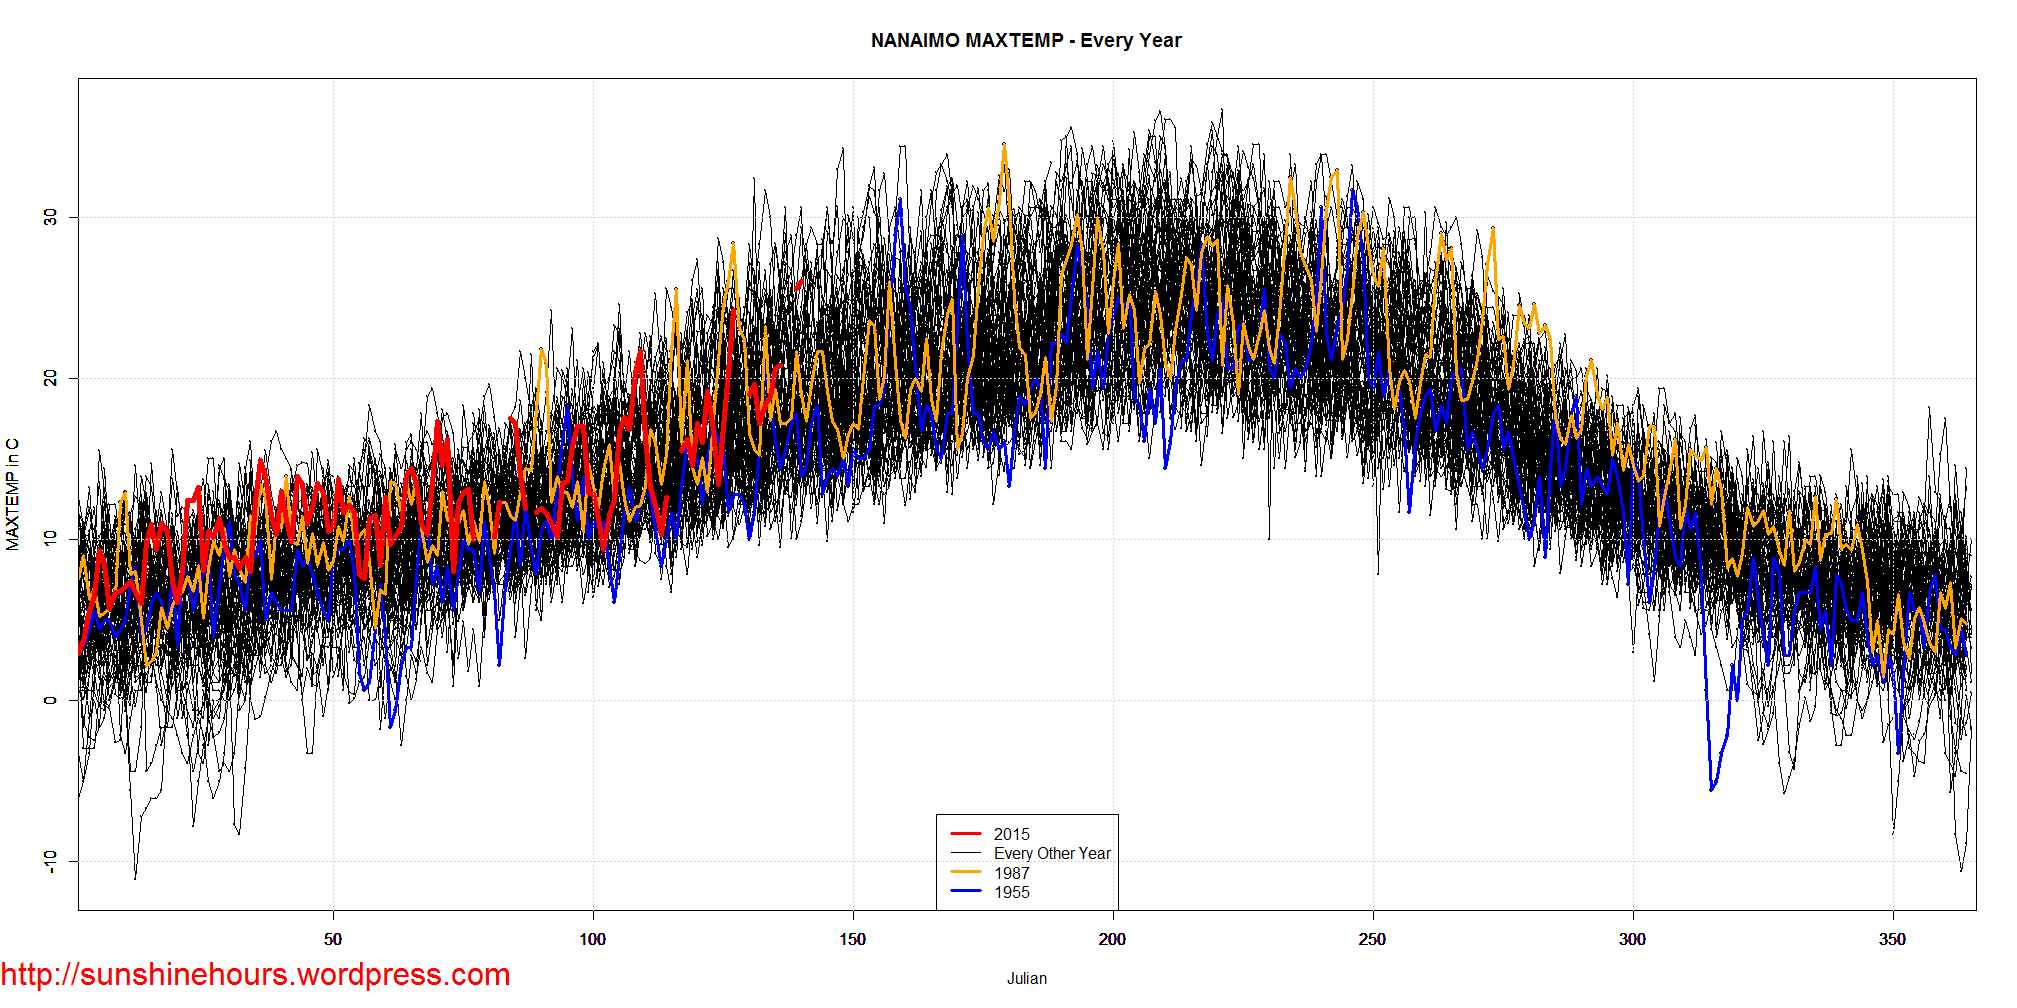
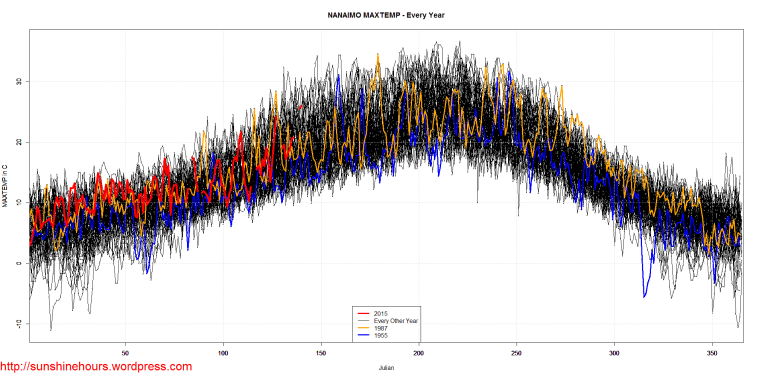
1987 was the warmest year (1958 was 2nd warmest FYI) . 1955 was the coldest They are shown as the orange and blue lines.
Here I have graphed all the available data in the style I usually use for Sea Ice data.
2015 is in red. There are gaps because Environment Canada doesn’t seem to care.
Notice that temps can fluctuate by 20C for the same day in different years.
Ponder this … why can we humans (and crops and animals) adapt to 20C swings but we can’t adapt to a 1C change over 100 years?
Click graph for larger.
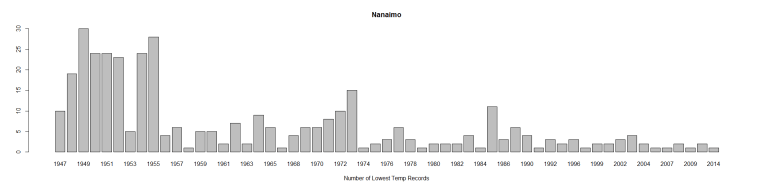
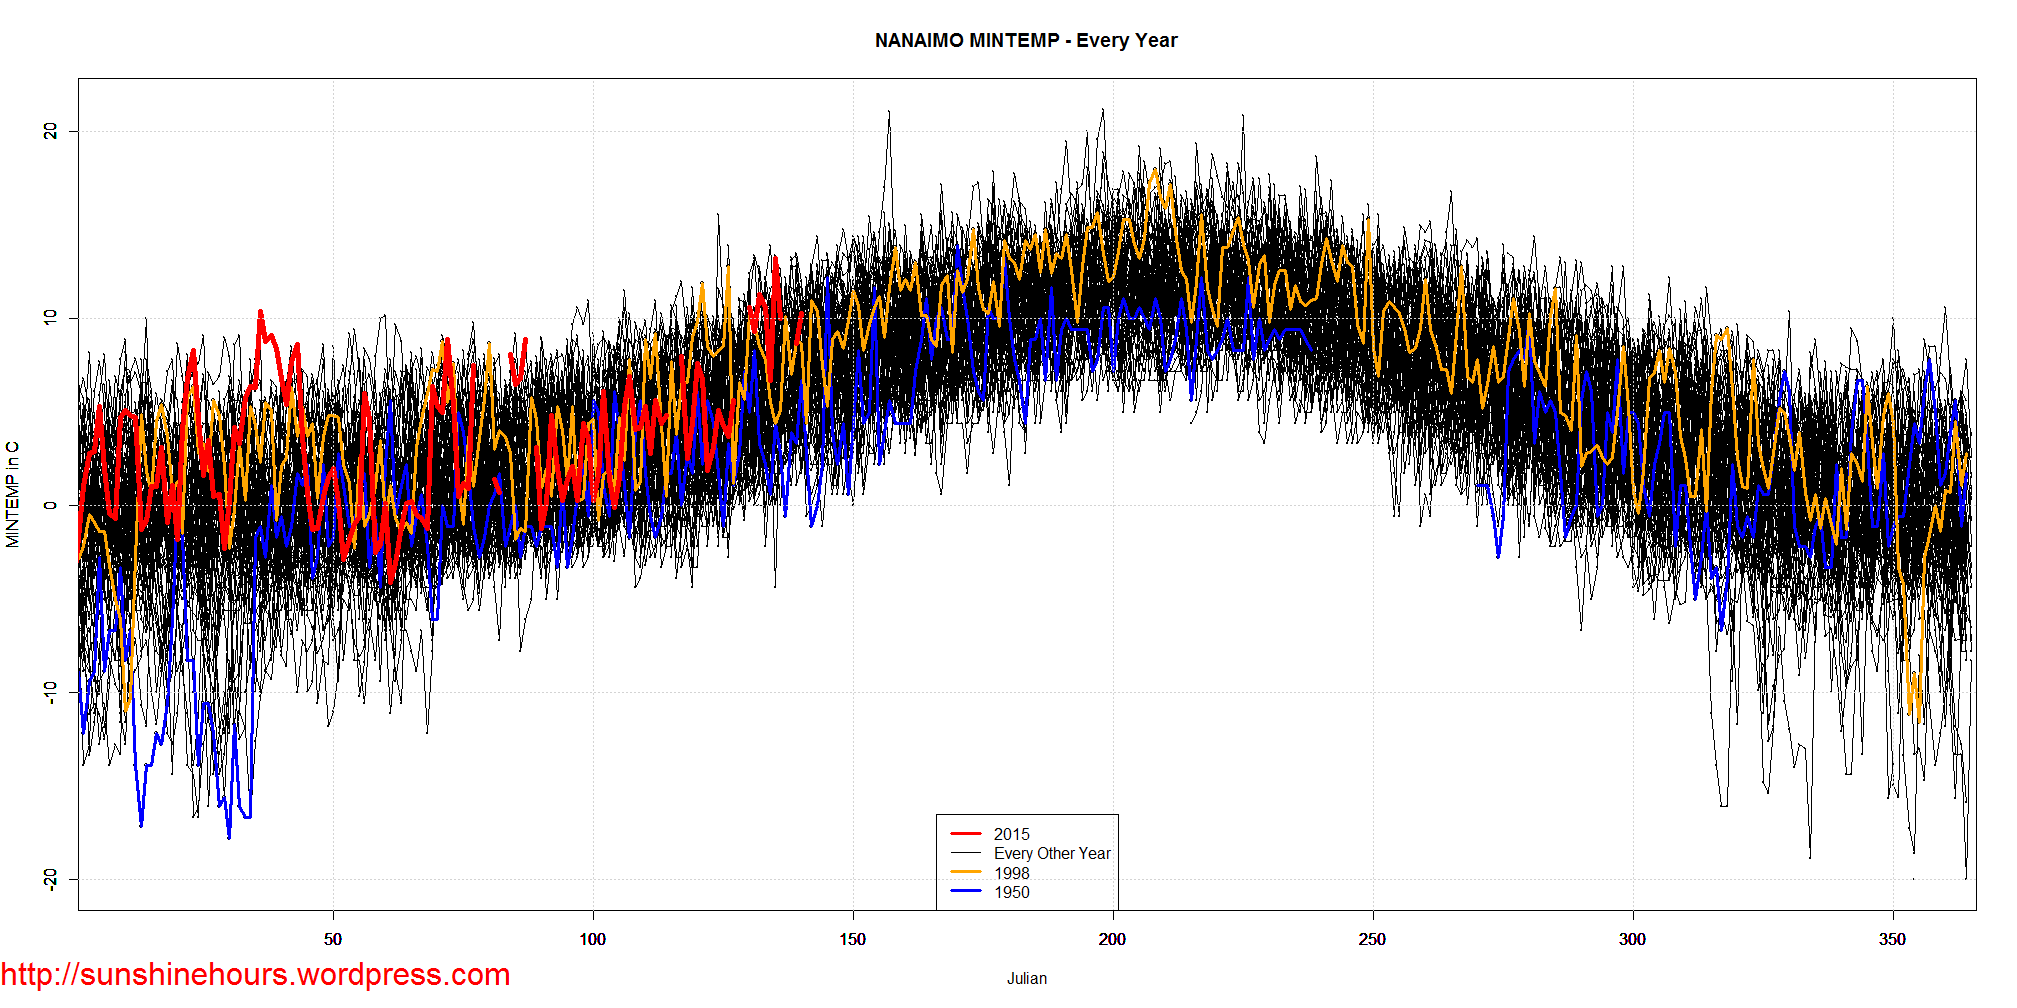
Update: I added Tmin