Canada May 2013 – Nunavut Daily Anomalies

Nunavut (northern Canada) was the coldest Province/Territory in May.

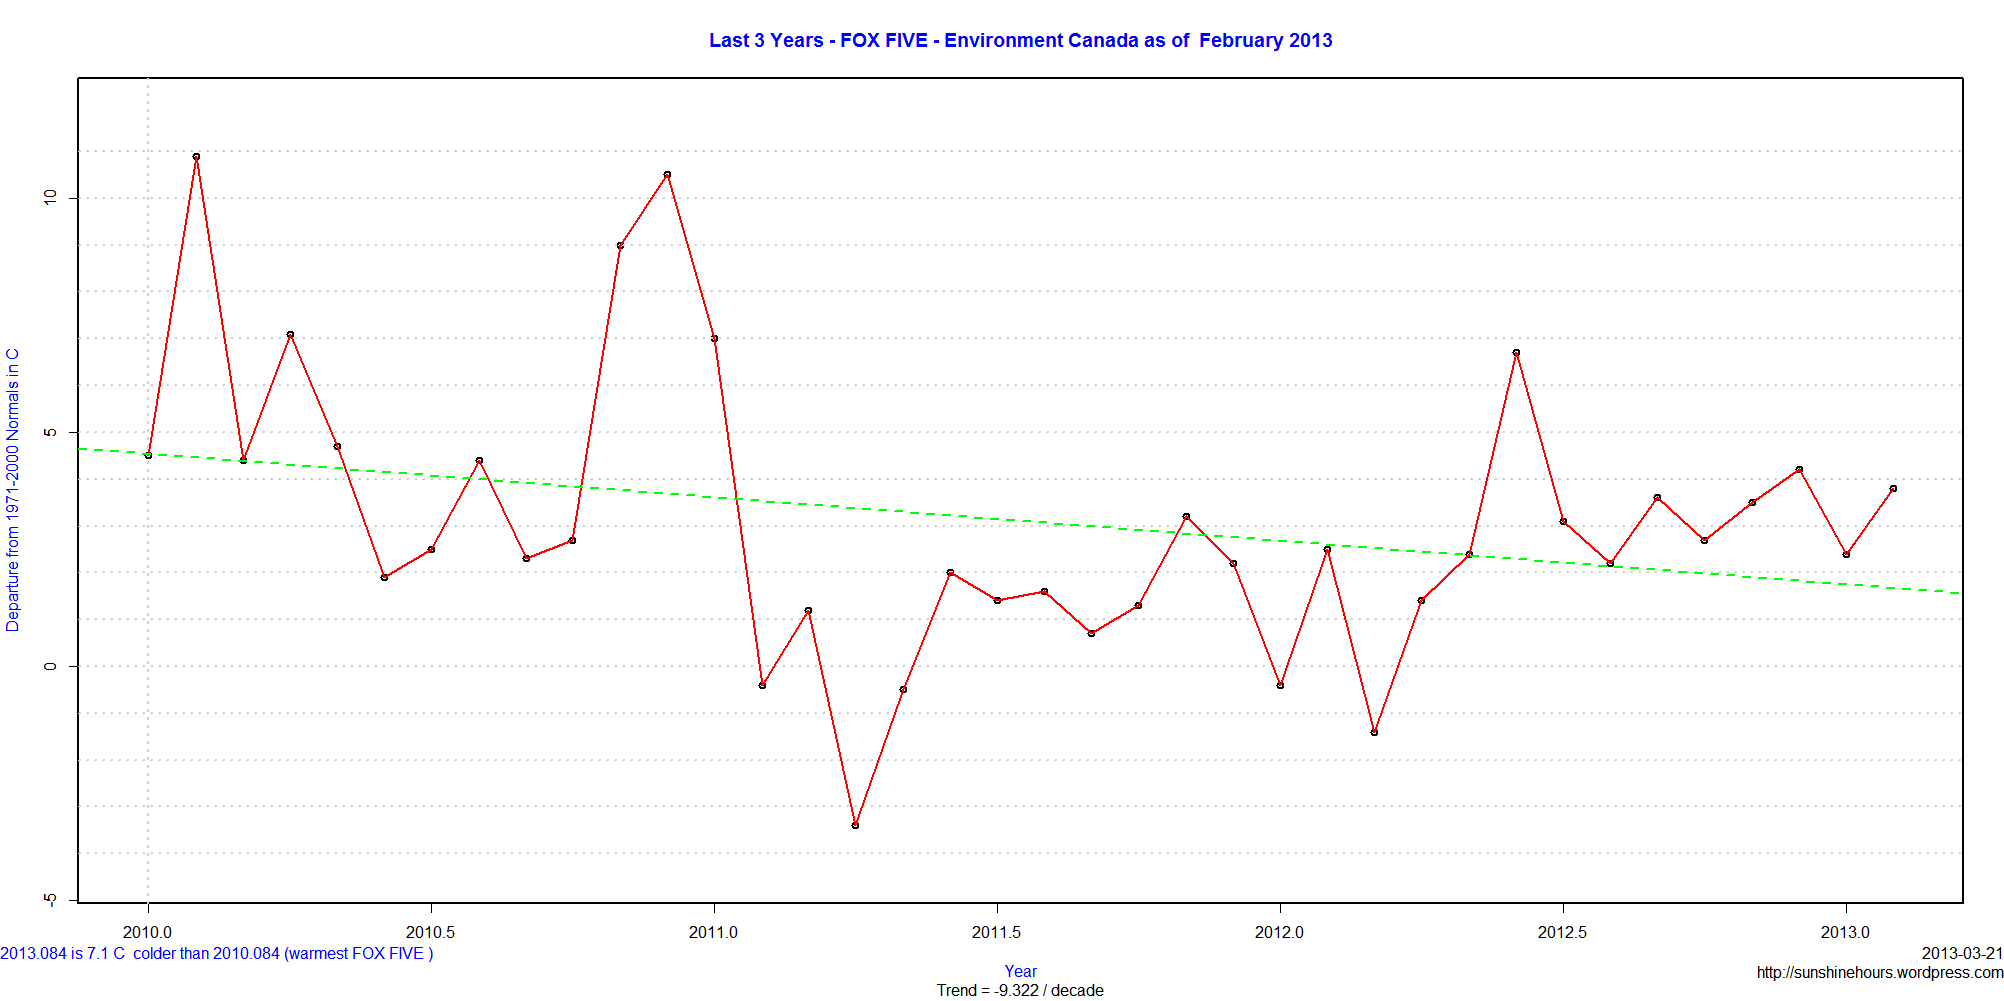
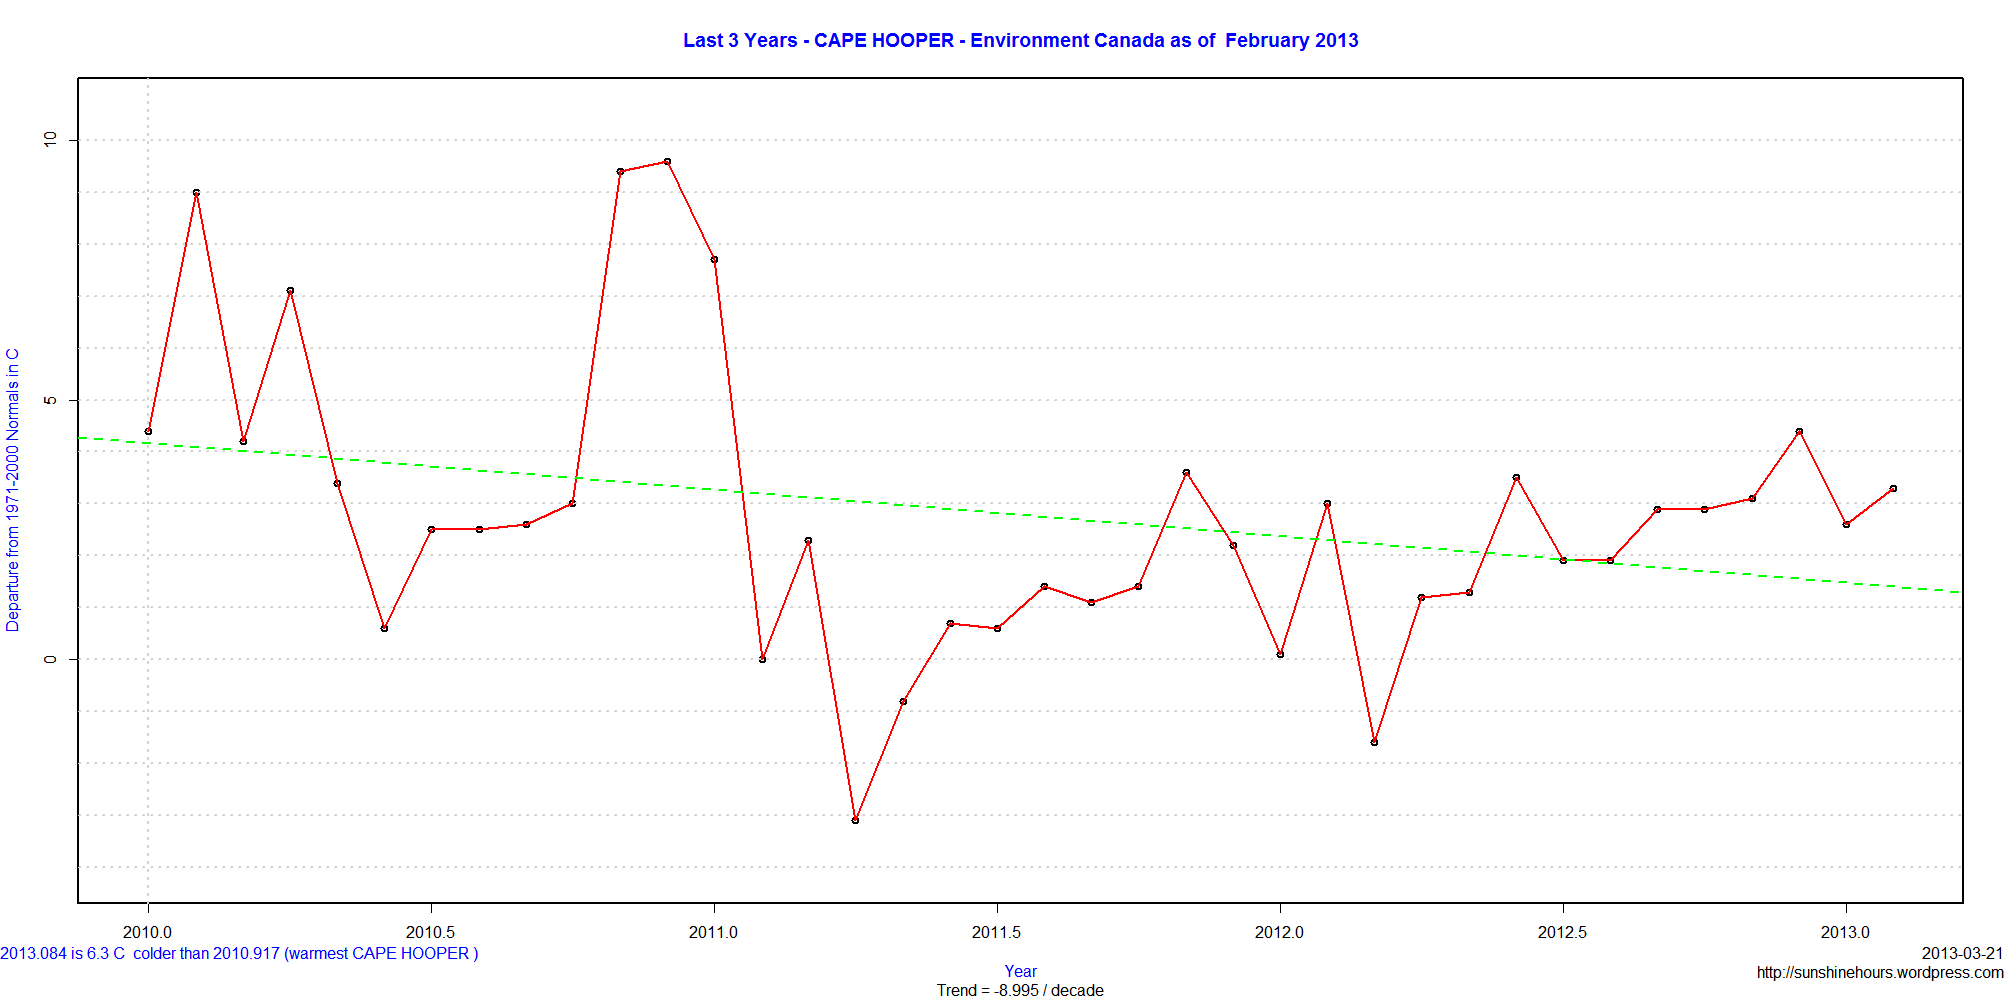
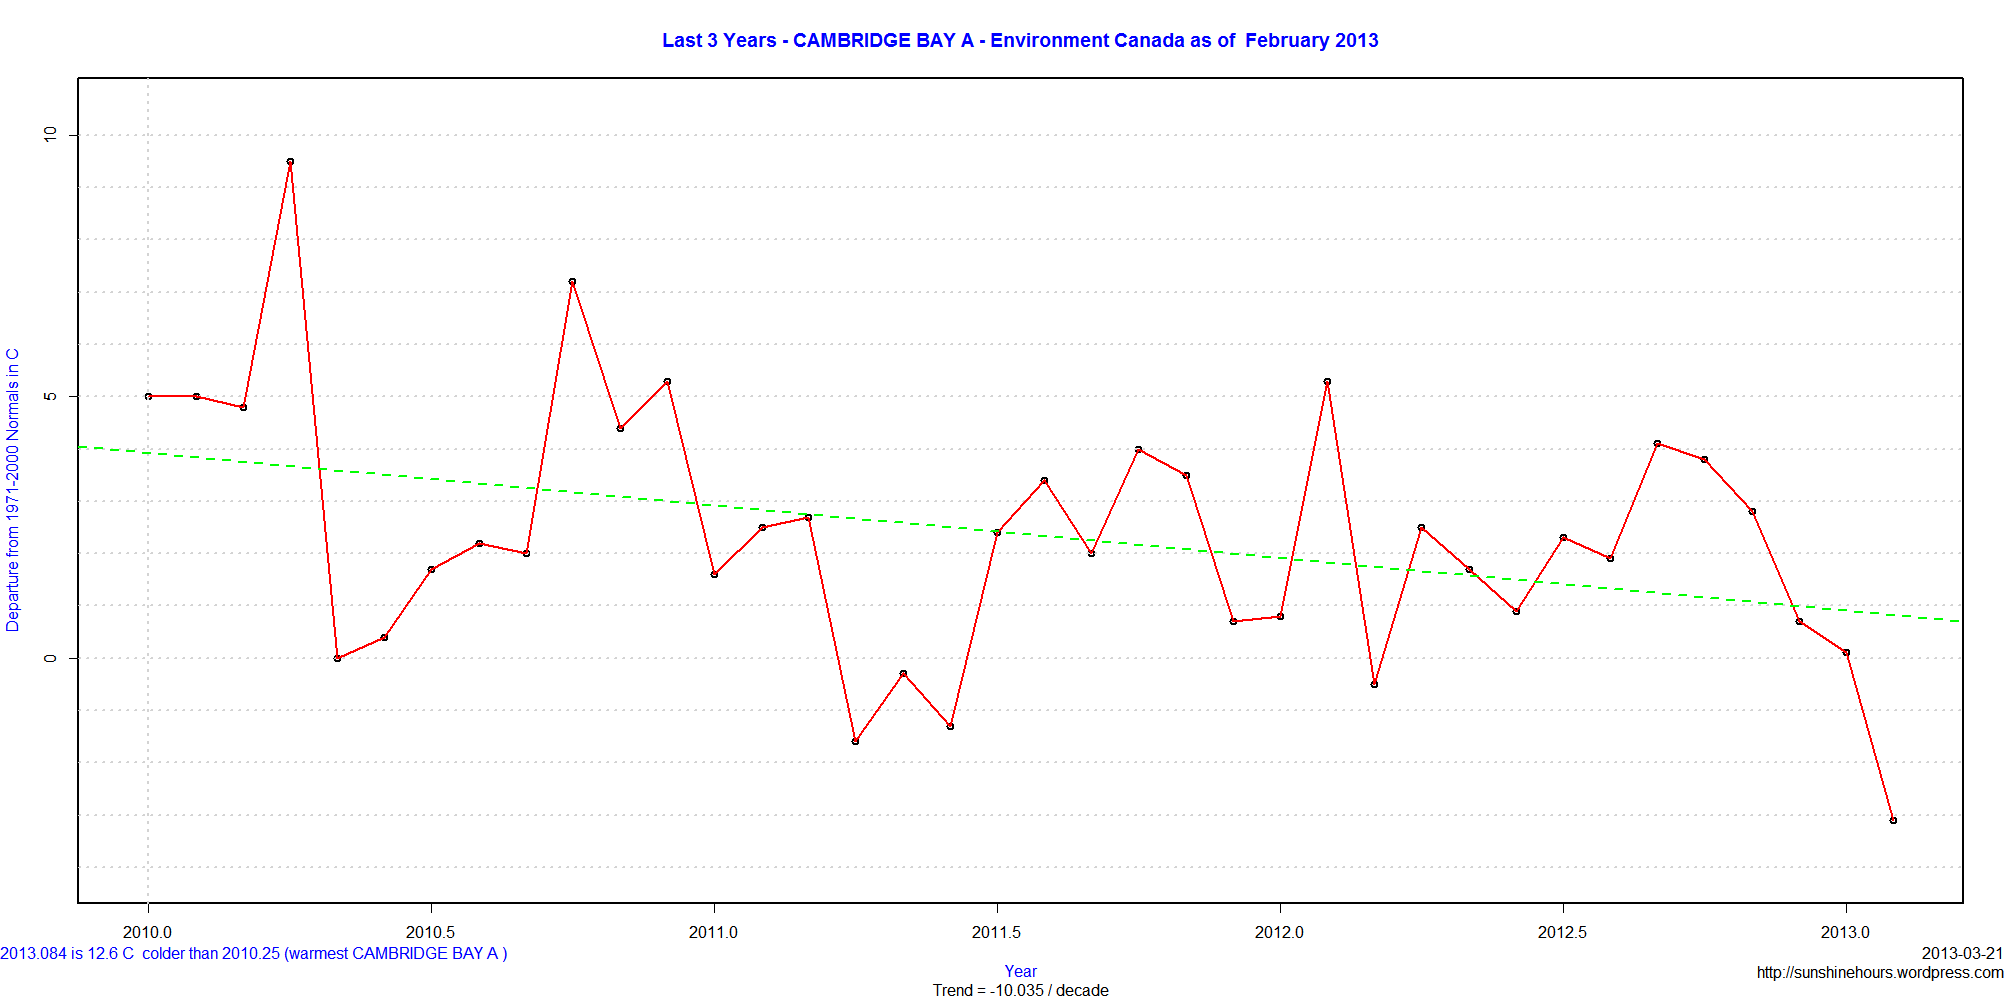
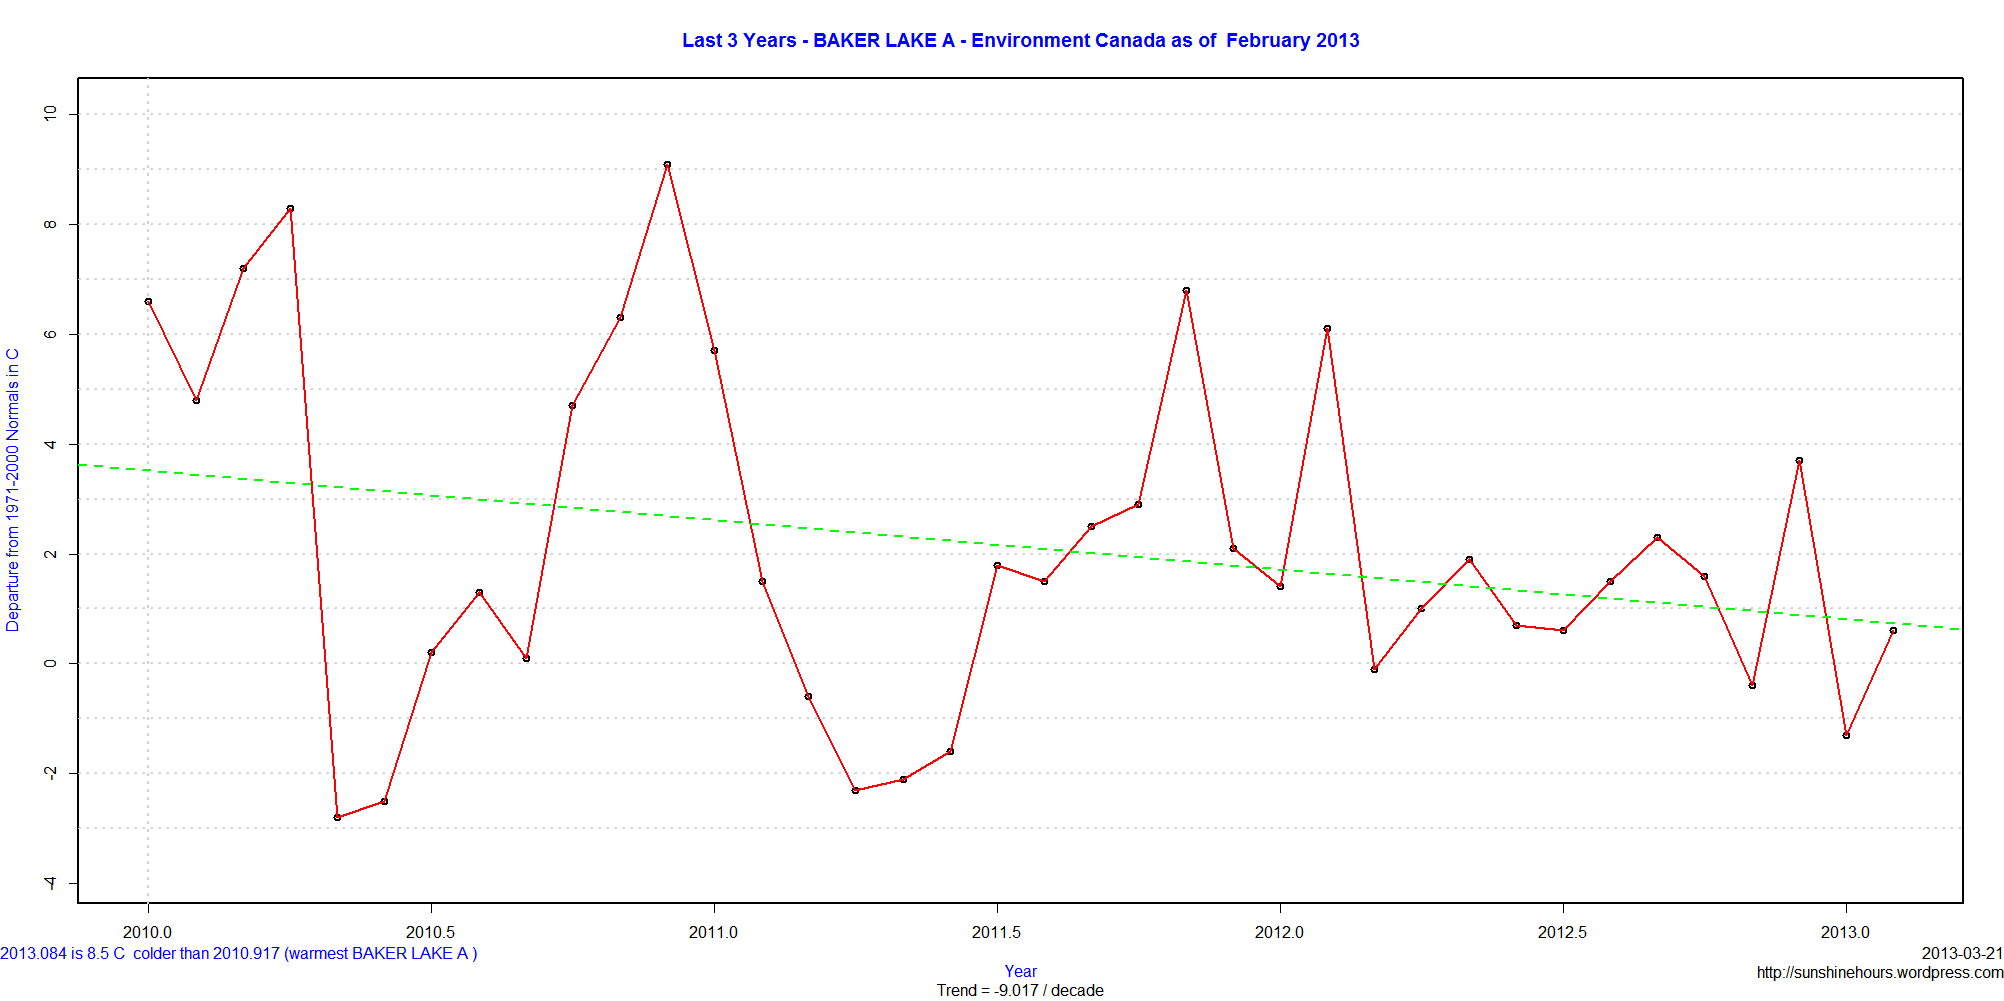
Environment Canada calculates “Normals” for a subset of stations. Those are the anomalies from the 1971-2000 average.

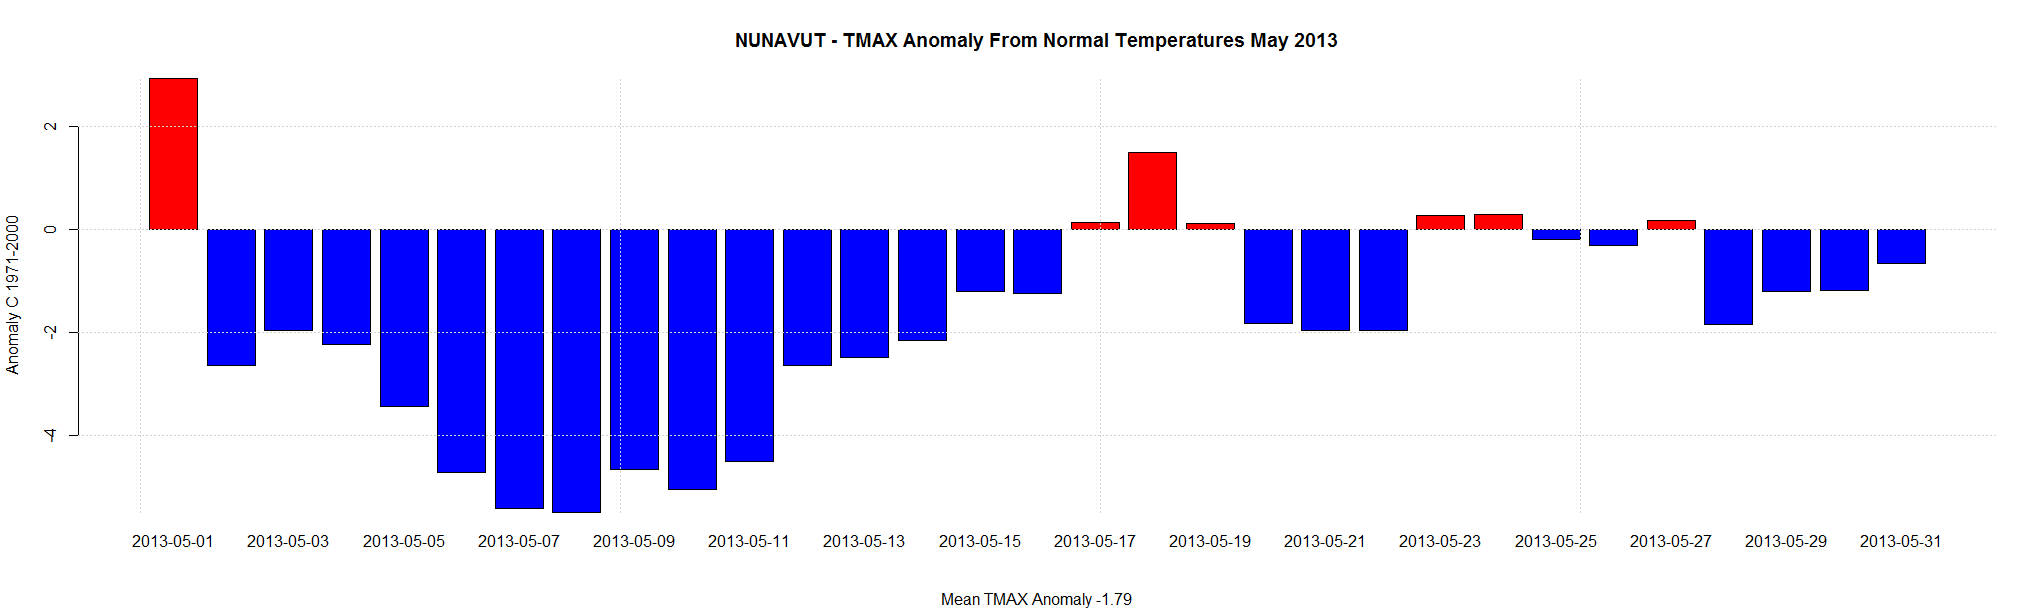
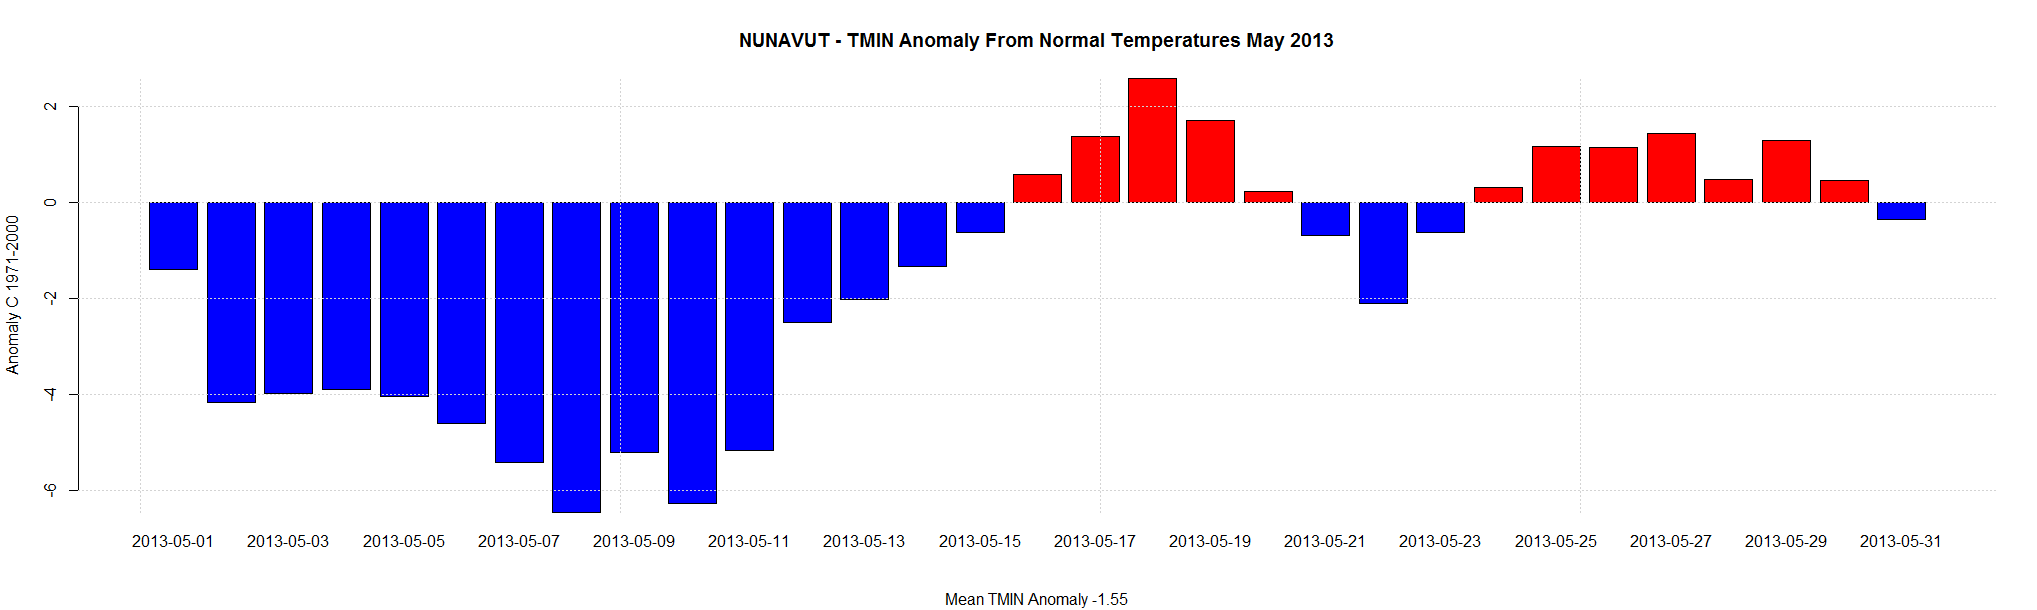
The following barplots are of the daily anomalies (TMax and TMin) for each Nunavut station (that have Normals) averaged together.

The coldest part of the month was 6 to 7C below the 1971-2000 average. So much for the overheating Arctic.

NUNAVUT - TMAX Anomaly From Normal Temperatures May 2013 NUNAVUT - TMIN Anomaly From Normal Temperatures May 2013

Nunavut (Canada’s Arctic) Temperature Falling From -8C to -12C Per Decade For Last 3 years

Yes Canada’s Arctic has warmed. I blogged about it most recently here. Many stations have a big spike around 2010.

What has happened since then?

I looked at Nunavut stations with Normals (anomalies) calculated by Environment Canada that have data for the last 3 years. (Most recent Nunavut Data Here. I’m looking at stations with data in column D)

Temperature is falling. From -8C to -12C per decade. Amazing.

Sure. Only 3 years. But did anyone else tell you this news? (Click to make bigger)

Last 3 Years - RANKIN INLET A - Environment Canada as of  February 2013 Last 3 Years - KUGLUKTUK A - Environment Canada as of  February 2013 Last 3 Years - FOX FIVE - Environment Canada as of  February 2013 Last 3 Years - EUREKA - Environment Canada as of  February 2013 Last 3 Years - DEWAR LAKES - Environment Canada as of  February 2013 Last 3 Years - CORAL HARBOUR A - Environment Canada as of  February 2013 Last 3 Years - CAPE HOOPER - Environment Canada as of  February 2013 Last 3 Years - CAMBRIDGE BAY A - Environment Canada as of  February 2013 Last 3 Years - BAKER LAKE A - Environment Canada as of  February 2013