In the UK, 2018 saw the 2nd highest sunshine hours since 1929 at 1580.7
If you graph the annual sunshine in the UK versus Annual Tmax …
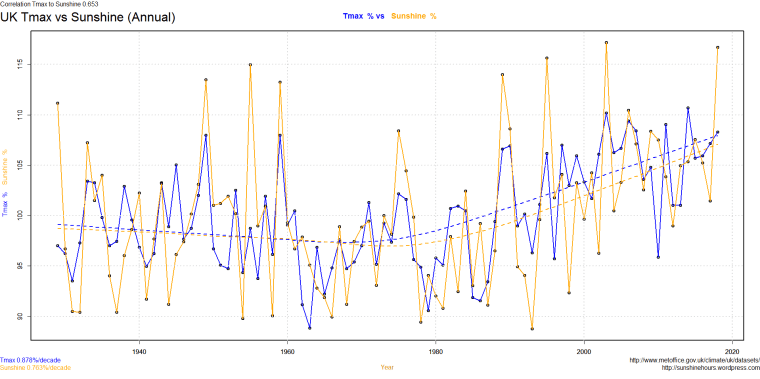
Does CO2 affect sunshine? Or is something else going on?
Data from here.
In the UK, 2018 saw the 2nd highest sunshine hours since 1929 at 1580.7
If you graph the annual sunshine in the UK versus Annual Tmax …
Does CO2 affect sunshine? Or is something else going on?
Data from here.
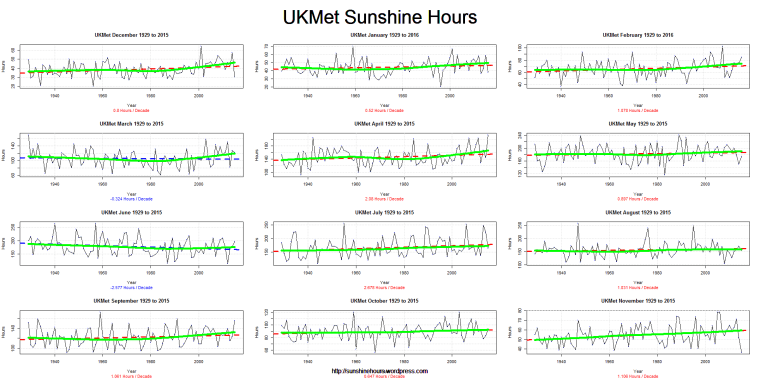
3 graphs for UK Sunshine Data. 1929 on, 1998 to 2018 and 2008 to 2018.
The trend values (red for increasing) are in hours per decade.
For the last 10 years the numbers are all over the place.
July 43 hours/decade and August 34 hours/dec. And March -23 hours/dec.


Only 2 out of 12 months in the UK show a downward trend in sunshine hours. March and June.
The trend values (red for increasing) are in hours per decade.
According to the UK Met Office 2015 was the 9th highest (since 1929) for sunshine.
Approximate 100 hours higher than the 1981-2010 average.
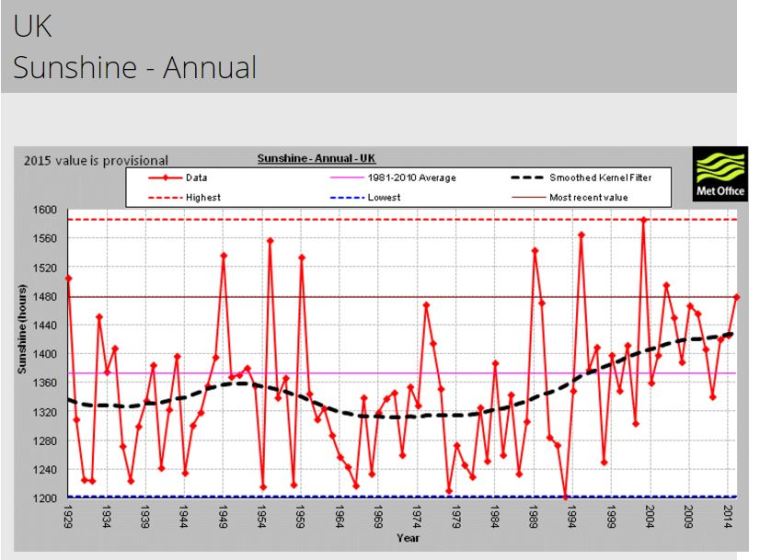
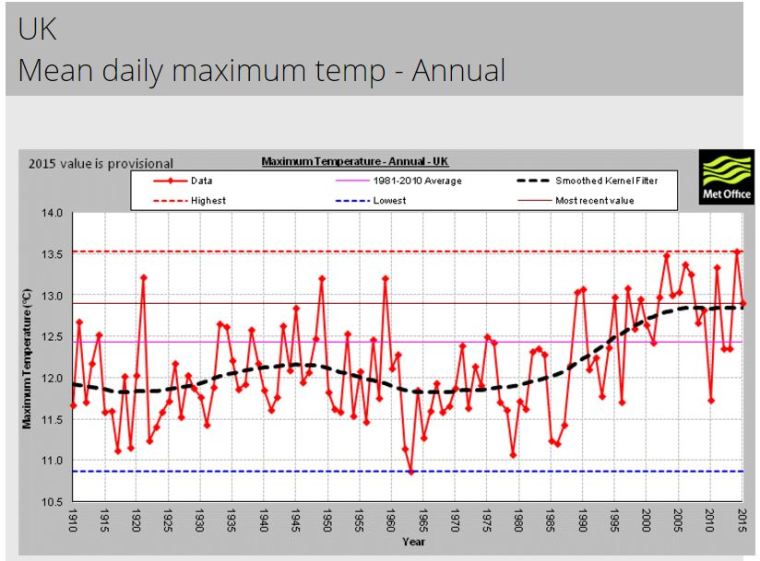
UK Max temperature graph looks similar to the sunshine graph.
Because of the floods, they are arguing about the amount of rainfall due to “climate change” over in the UK. Looking at the data from the UK Met for winter rainfall, it appears rainfall goes up and down.
I wonder if the usual AGW alarmist media blamed climate change for the dry period 2009 to 2011? Do I have to ask? Of course they did!
Guardian 17 November 2011: As well as the recent dry weather, water companies and environment regulators are expecting the UK to have more frequent dry winters as a result of climate change.
The graph below is Dec/Jan/Feb anomalies from the 1981-2010 mean. Click for a bigger version.

UK 5th Coldest Spring in 104 Years (data).
| Spring Mean in C | Year |
| 5.8 | 1962 |
| 5.81 | 1951 |
| 5.88 | 1941 |
| 5.88 | 1917 |
| 5.99 | 2013 |
| 6.03 | 1979 |
| 6.18 | 1958 |
| 6.19 | 1969 |
| 6.29 | 1932 |
| 6.3 | 1986 |
| 6.31 | 1924 |
| 6.35 | 1996 |
| 6.42 | 1955 |
| 6.47 | 1916 |
| 6.51 | 1975 |
| 6.53 | 1922 |
| 6.55 | 1931 |
| 6.57 | 1970 |
| 6.67 | 1923 |
| 6.7 | 1983 |
| 6.75 | 1984 |
| 6.77 | 1915 |
| 6.79 | 1934 |
| 6.81 | 1919 |
| 6.83 | 1968 |
| 6.86 | 1925 |
| 6.87 | 1985 |
| 6.89 | 1930 |
| 6.94 | 1947 |
| 7.02 | 1977 |
| 7.02 | 1937 |
| 7.03 | 1987 |
| 7.06 | 1966 |
| 7.06 | 1965 |
| 7.11 | 1963 |
| 7.11 | 1929 |
| 7.12 | 1973 |
| 7.13 | 1976 |
| 7.13 | 1967 |
| 7.14 | 1980 |
| 7.15 | 1936 |
| 7.16 | 1978 |
| 7.17 | 1971 |
| 7.17 | 1935 |
| 7.17 | 1910 |
| 7.18 | 1928 |
| 7.19 | 1954 |
| 7.19 | 1942 |
| 7.22 | 1974 |
| 7.22 | 1956 |
| 7.28 | 1913 |
| 7.32 | 1995 |
| 7.35 | 2006 |
| 7.37 | 1994 |
| 7.38 | 2001 |
| 7.39 | 1972 |
| 7.4 | 1918 |
| 7.42 | 1927 |
| 7.49 | 1926 |
| 7.51 | 1946 |
| 7.52 | 1953 |
| 7.53 | 1939 |
| 7.55 | 1911 |
| 7.57 | 1964 |
| 7.58 | 1949 |
| 7.6 | 2010 |
| 7.6 | 1988 |
| 7.6 | 1914 |
| 7.62 | 1950 |
| 7.64 | 1982 |
| 7.67 | 1920 |
| 7.69 | 1989 |
| 7.69 | 1944 |
| 7.72 | 1921 |
| 7.81 | 1940 |
| 7.82 | 1981 |
| 7.88 | 1991 |
| 7.94 | 1993 |
| 8.05 | 2000 |
| 8.08 | 1938 |
| 8.12 | 2005 |
| 8.13 | 2008 |
| 8.18 | 1912 |
| 8.21 | 2012 |
| 8.25 | 1933 |
| 8.26 | 1960 |
| 8.27 | 1998 |
| 8.29 | 1957 |
| 8.36 | 1948 |
| 8.42 | 2004 |
| 8.42 | 1997 |
| 8.48 | 2002 |
| 8.48 | 1943 |
| 8.52 | 1959 |
| 8.52 | 1952 |
| 8.53 | 1961 |
| 8.54 | 1992 |
| 8.56 | 1990 |
| 8.62 | 2009 |
| 8.64 | 1999 |
| 8.76 | 2003 |
| 8.8 | 1945 |
| 9.05 | 2007 |
| 9.15 | 2011 |
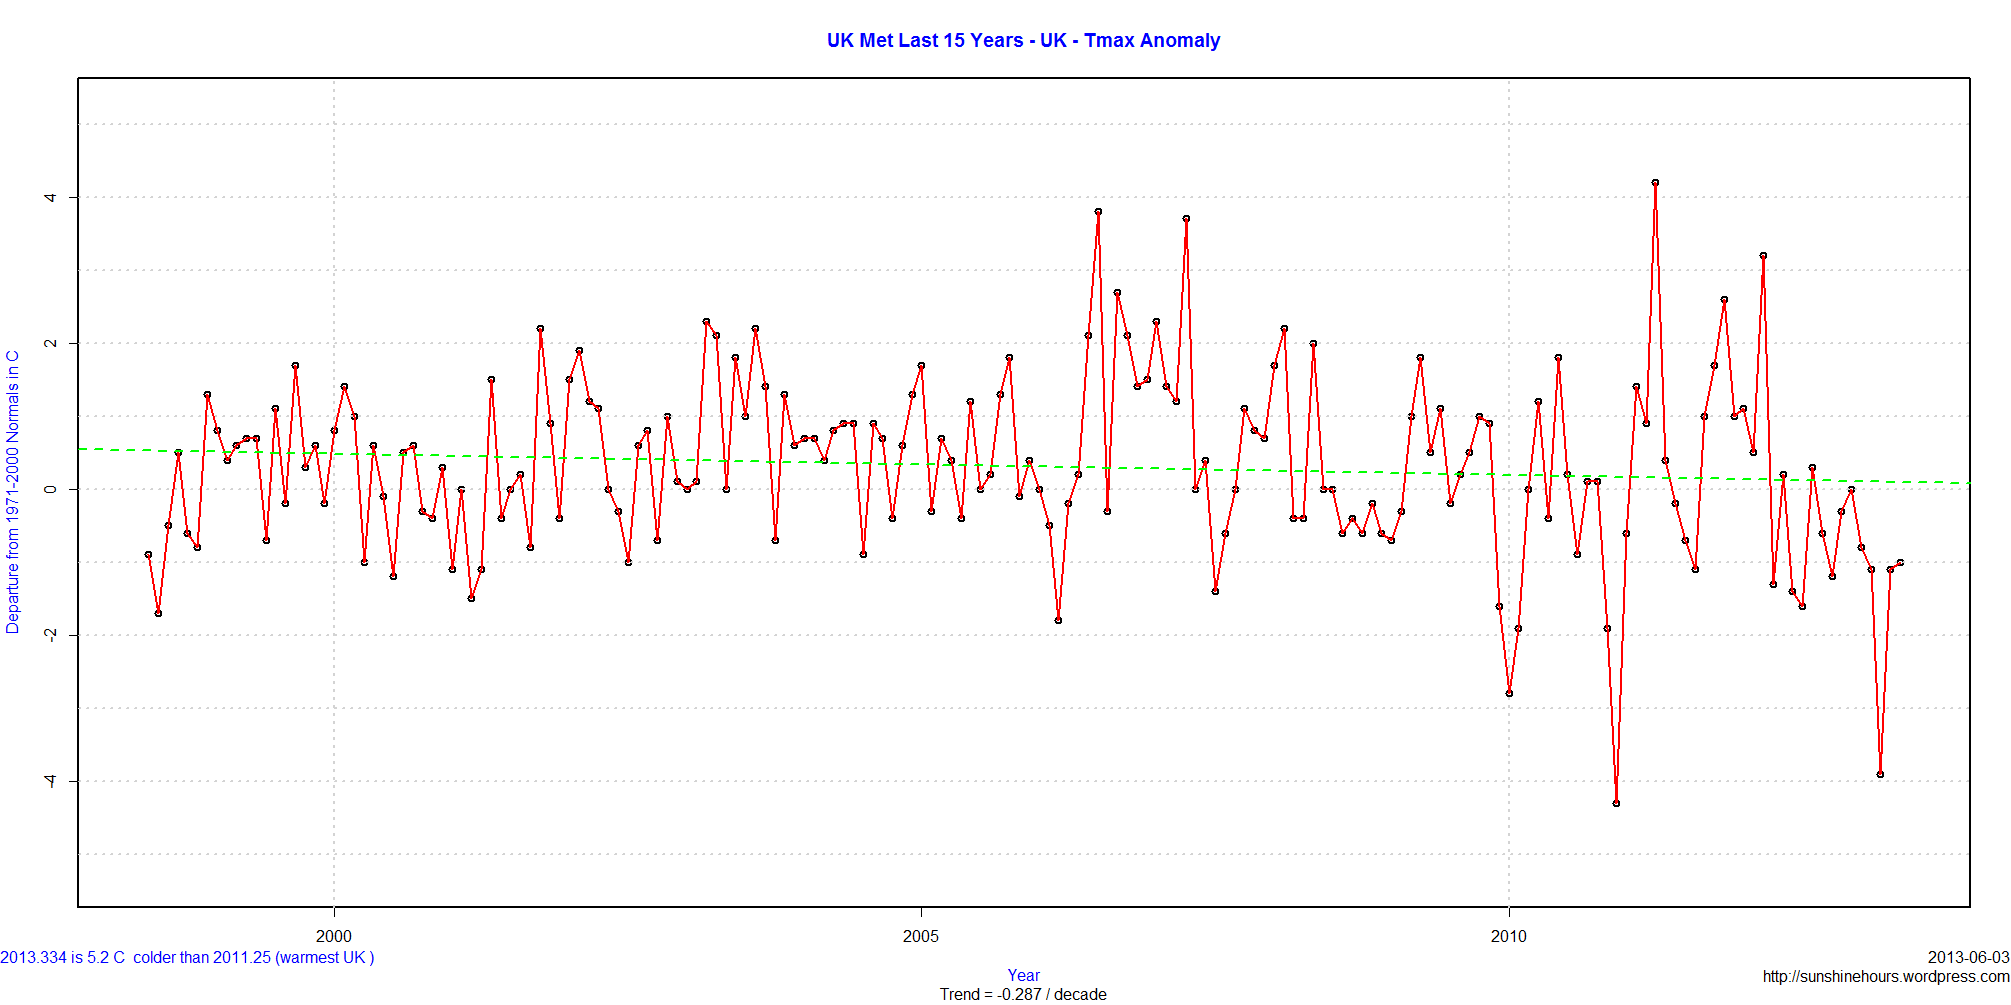
UK Met data shows that UK Daily Tmax (mean maximum temperature) is cooling at at -1.088C / decade for the last 5 years.

The 15 year trend is lower at -0.287C / decade.
Using data from the UK Met, May Tmax (mean maximum temperature) in the UK is cooling at -.618C / decade for 15 years.
The warmest May Tmax (in the last 104 years) was 16.9C in 1992. May 2013 was 13.8C. Tied for 33rd coldest out of 104.
CO2 seems to not work in May in the UK ….

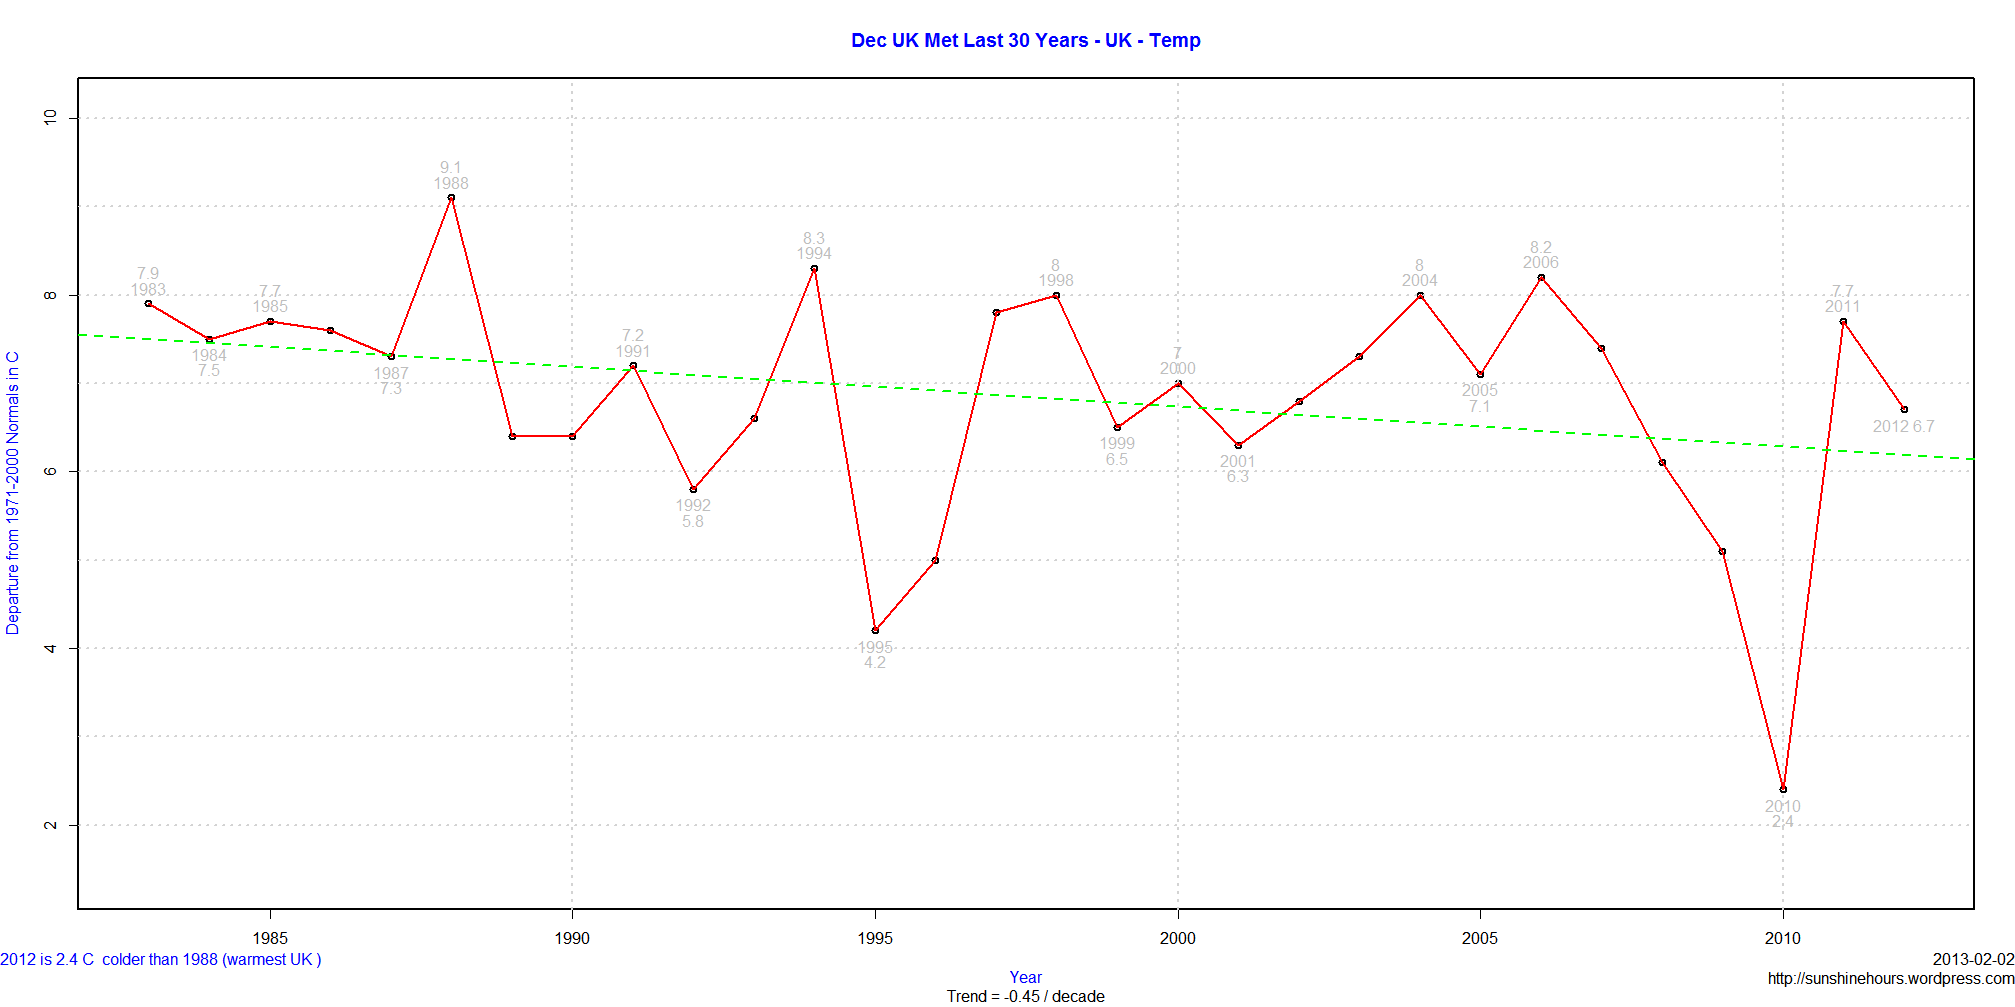
Using UK Met data from here, I noticed that Tmax for Decembers are cooling at -.45C / decade for 30 years. Thats a lot!
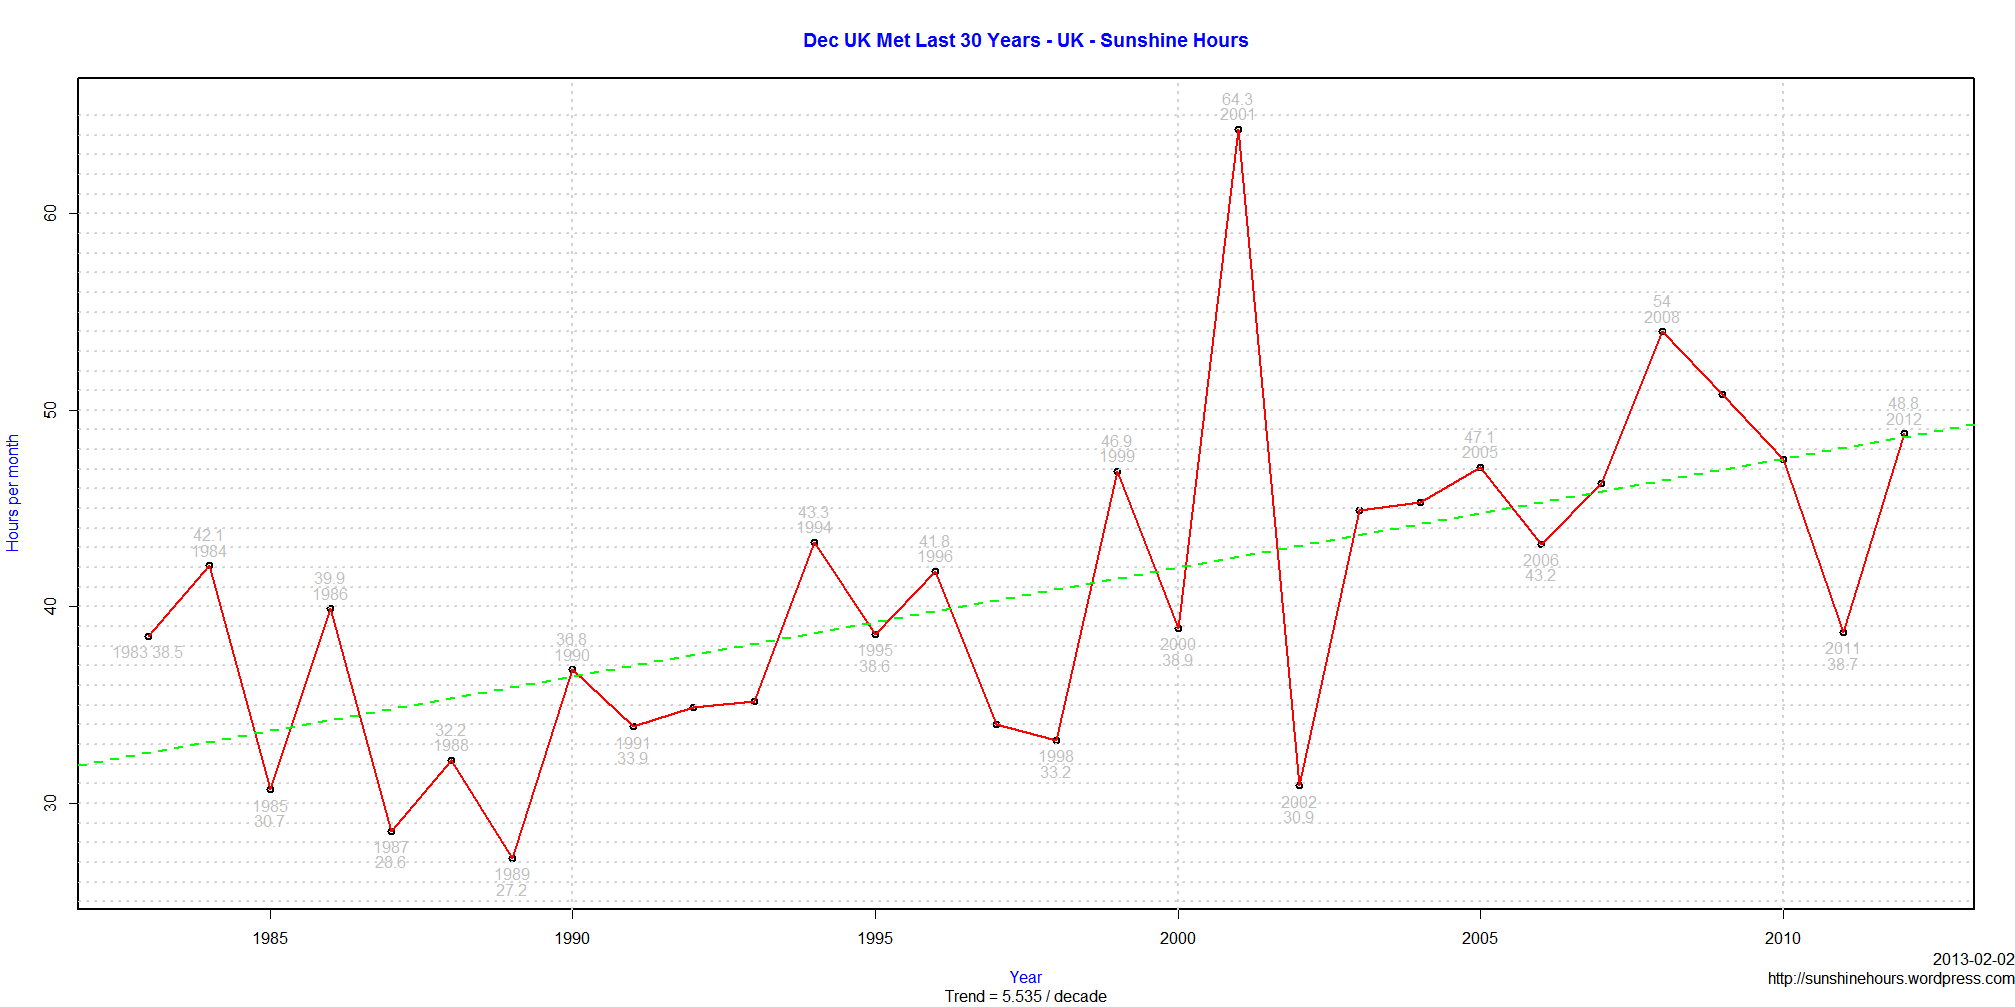
And then I wondered why? A theme I have returned to over and over is that hours of bright sunshine has increased because of cleaner air. Could more sunshine in December lead to cooler Decembers since clear skies can lead to colder temperatures in winter?
Guess what. Sunshine is up an average of 5.5 hours per year in December for the last 30 years. And compared to 1988 sunshine is up 80% in December. Instead of 28 hours of sunshine in December, the average is closer to 48.
Click on the graphs to enlarge.