Category: USA48
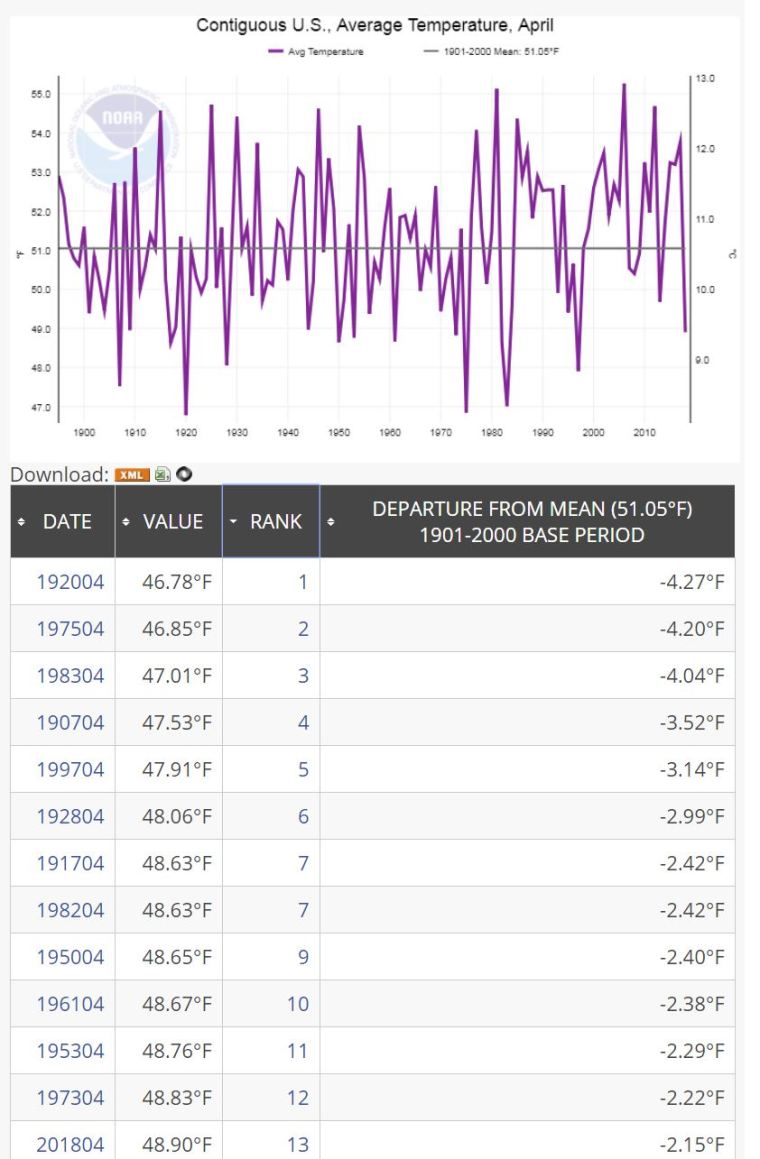
April was Cold in the USA
April was cold in the USA
3F colder than the 30 year average
Coolest April since 1997 (47.5°F)
Almost 5°F cooler than last year (53.2°F).
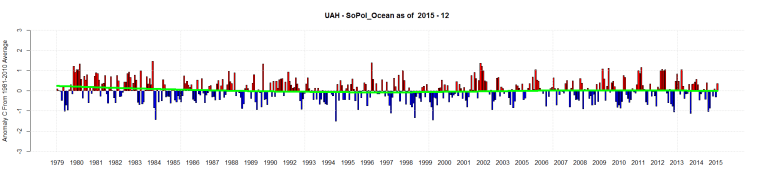
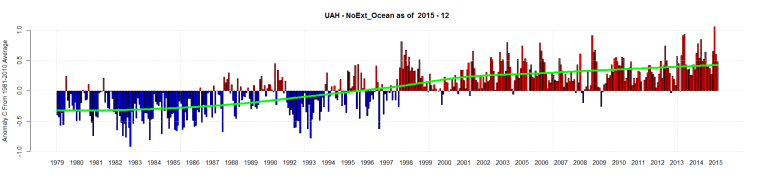
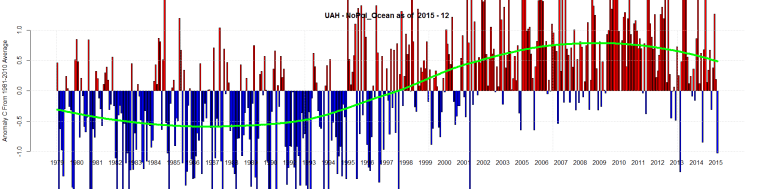
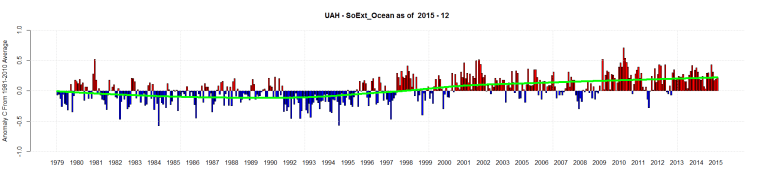
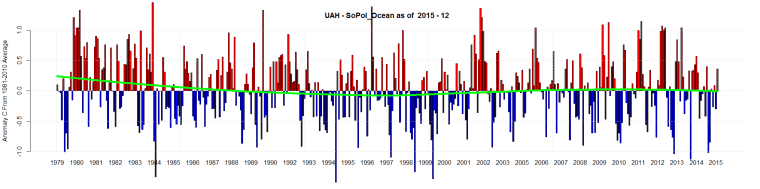
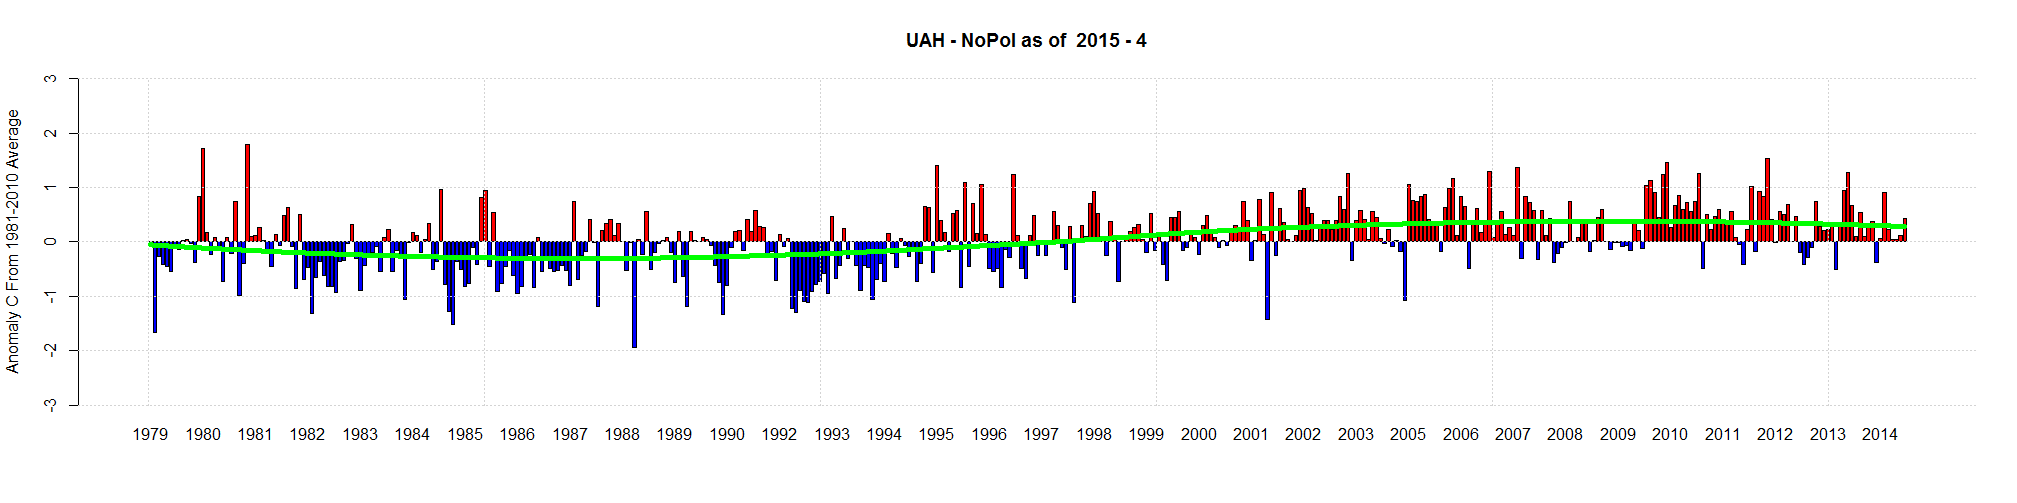
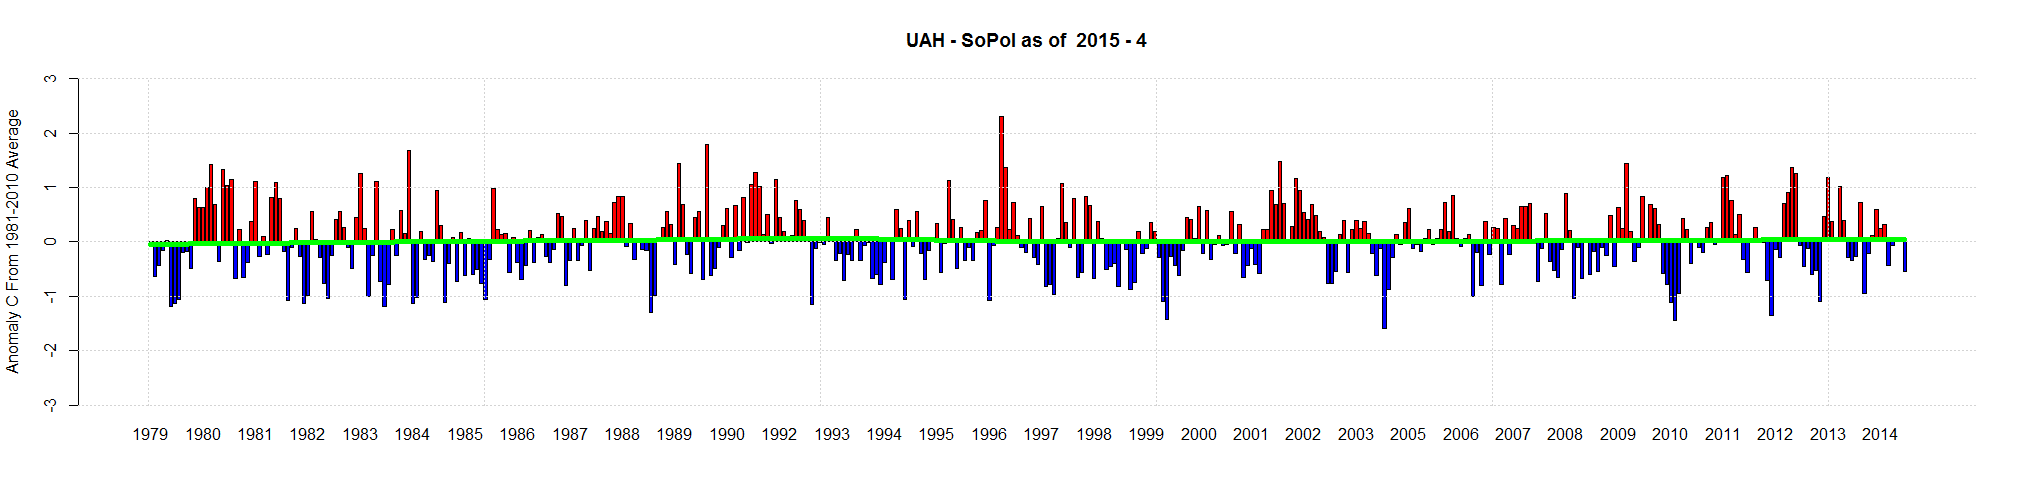
UAH December 2015
UPDATE: The original version of this post had the y axis going from -1 to 1. I’ll leave those graphs at the bottom.
The new graphs have -3 to 3. Notice how much the NoPol Ocean temperatures fluctuate compared to the other 3 regions.
UAH for December 2015 is out.
Here is the South and North Pole Ocean Data plus the Southern and Northern Extent Ocean Data
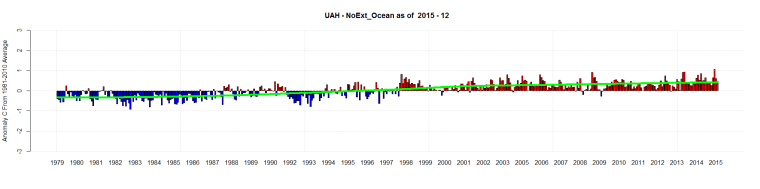
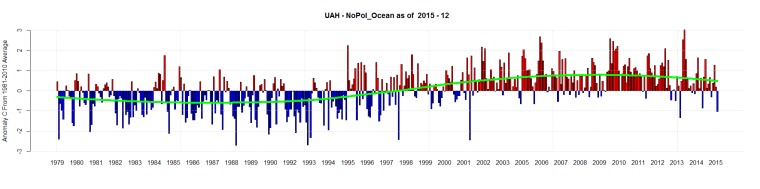
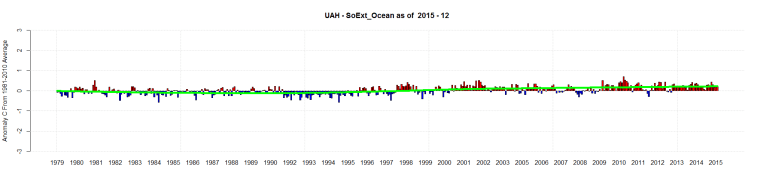
Original graphs:
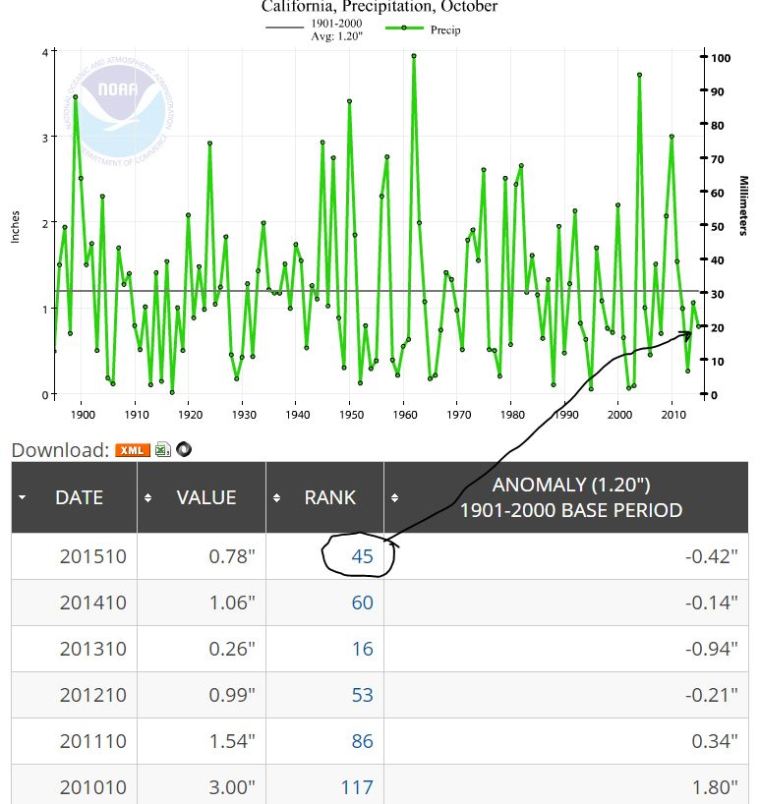
NOAA October 2015 – 45th Driest in California
The NOAA ranked October 2015 precipitation in California as 45 out of 121 with 121 being wettest.
That means 44 Octobers were drier. Up and down — dry and then wet. That is normal. Its not climate change.
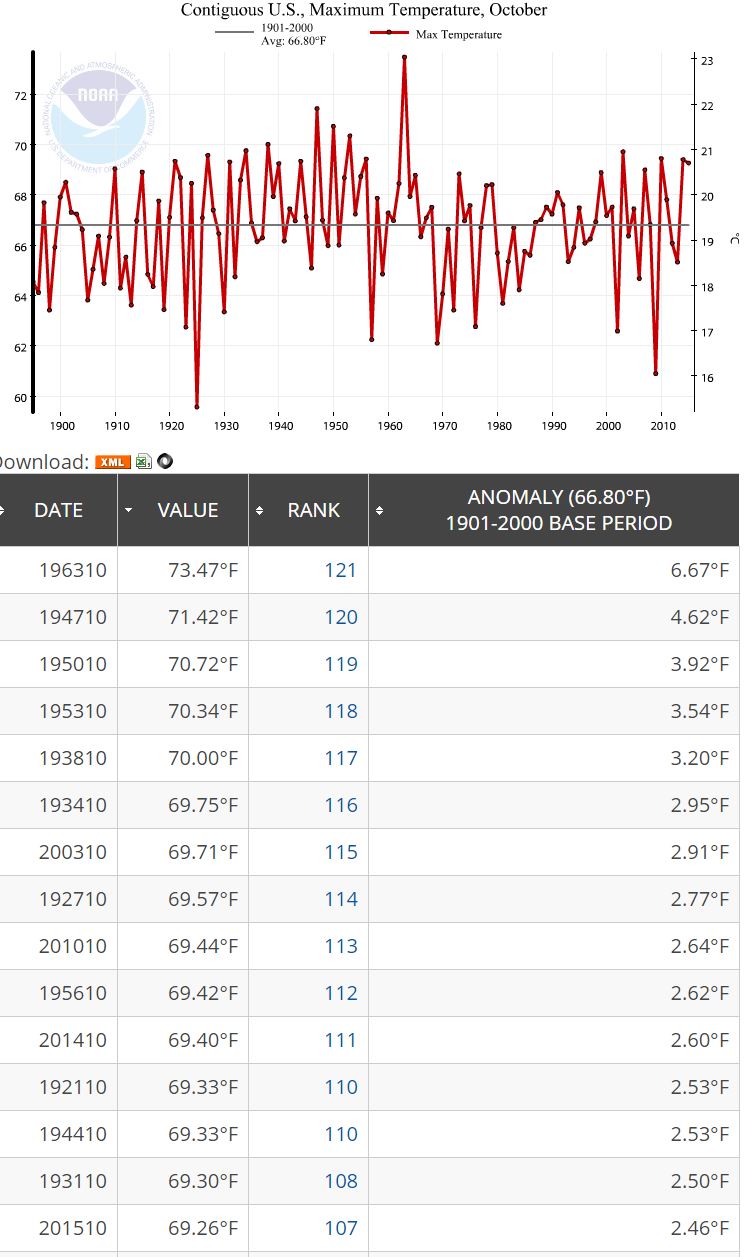
NOAA October 2015 – USA – Maximum was 4.2F Colder Than 1963
NOAA says it was the 15th hottest October maximum temperature since 1895 in the USA.
But it was 4.2F colder that October 1963. (Rank was 107 out of 121 where 121 is hottest)
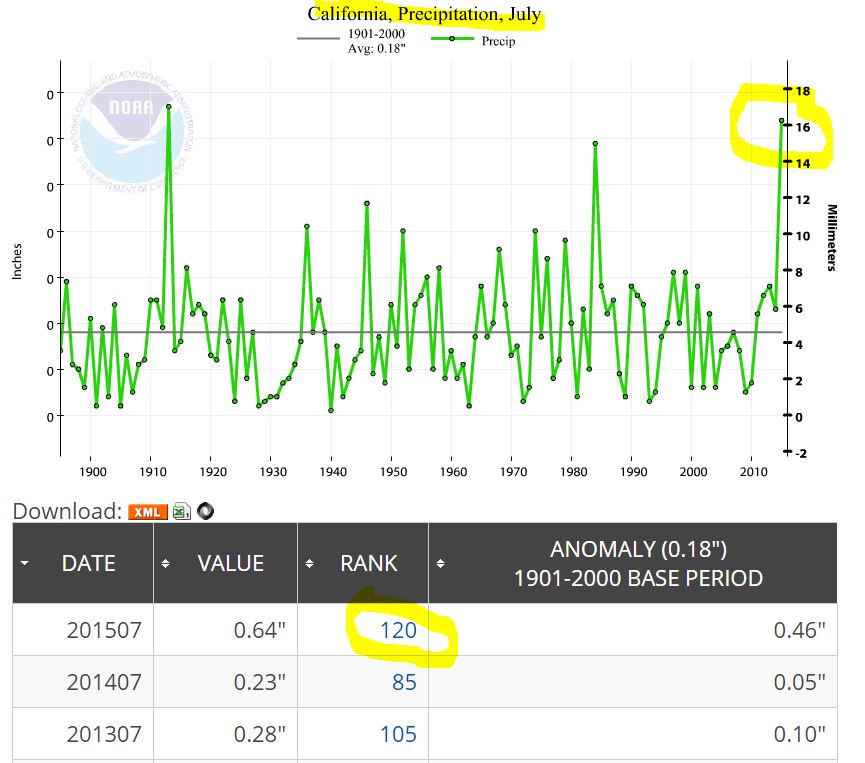
NOAA July 2015 – USA – 2nd Wettest July in California History
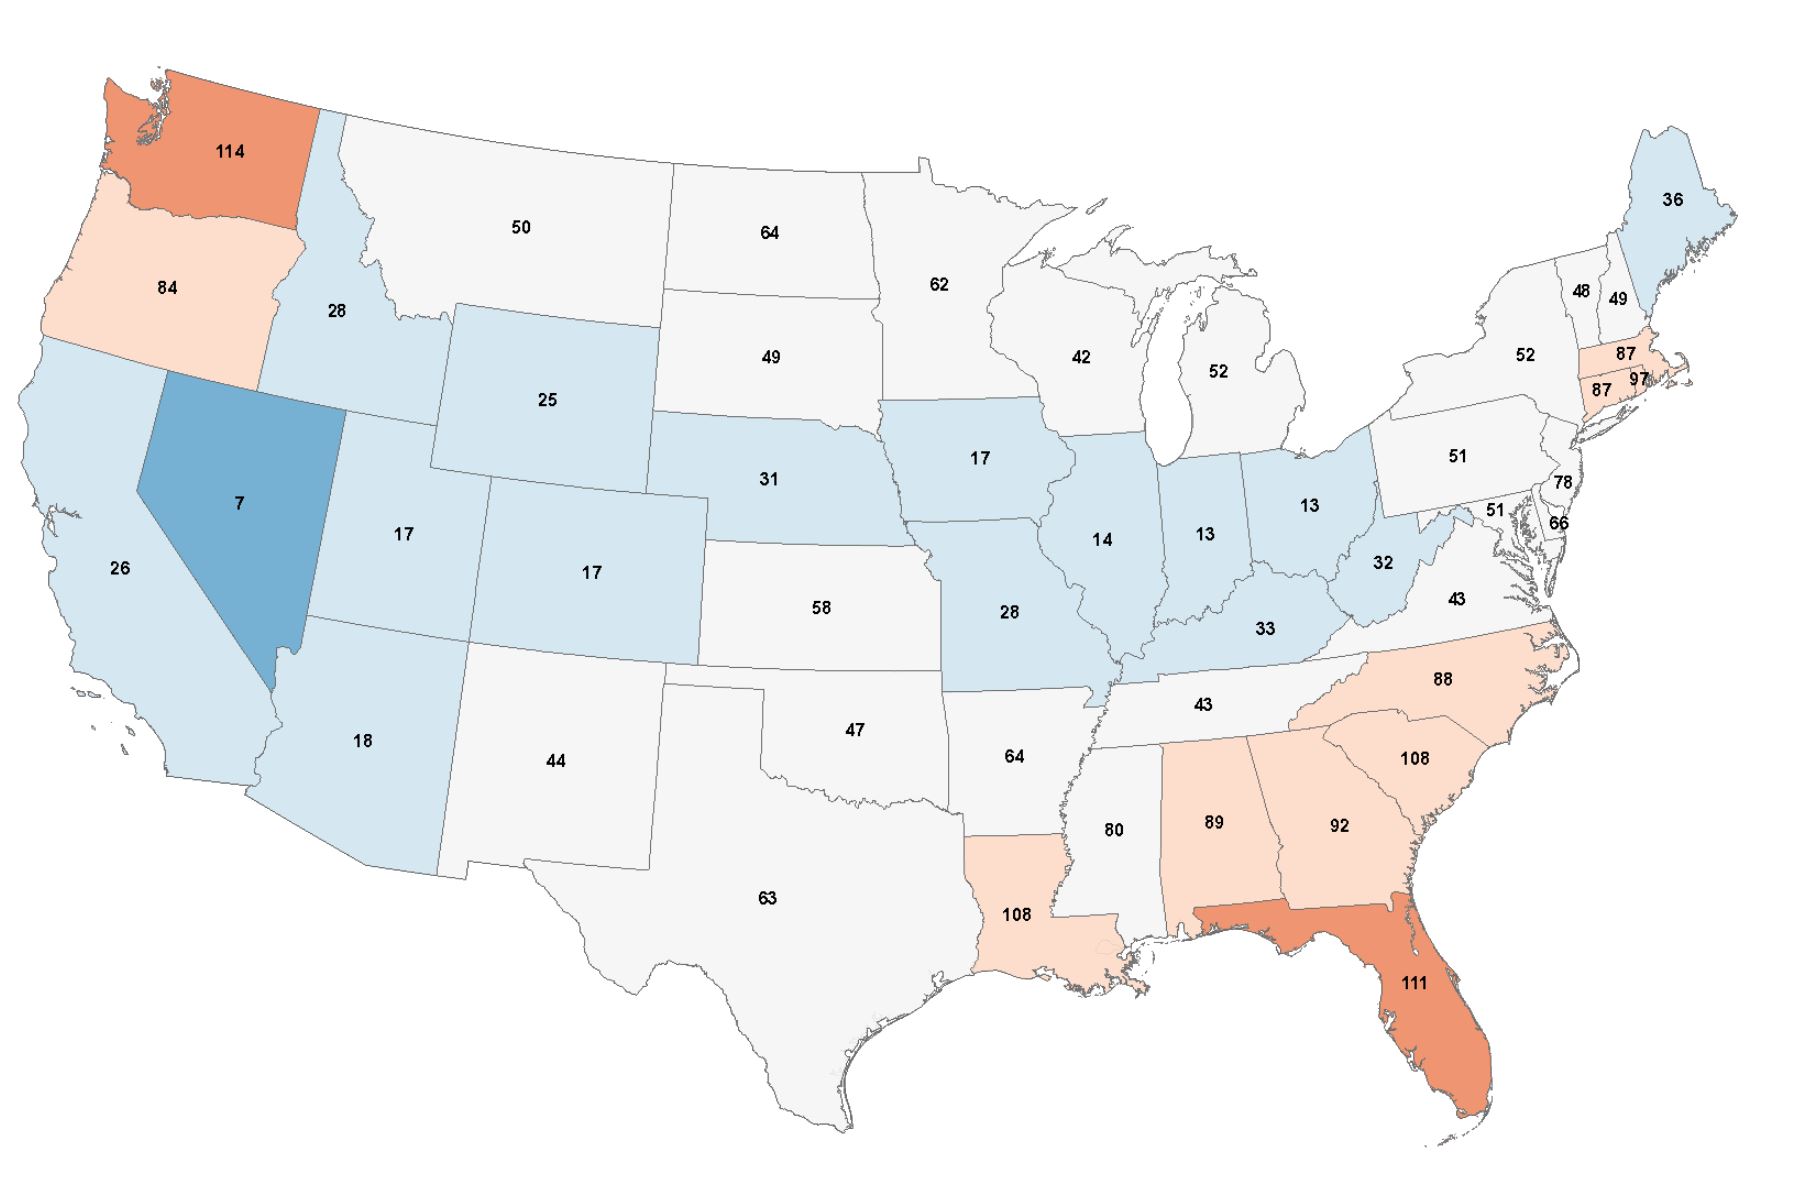
NOAA July 2015 – USA Maximum – July Was Cold
These are the NOAA rankings by state for maximum temperatures for July 2015.
A rankingof 121 would be the highest. 1 would be the lowest.
Nevada was ranked 7th. That means only 6 July’s in Nevada were colder.
All those blue and white states had a pretty cold July.
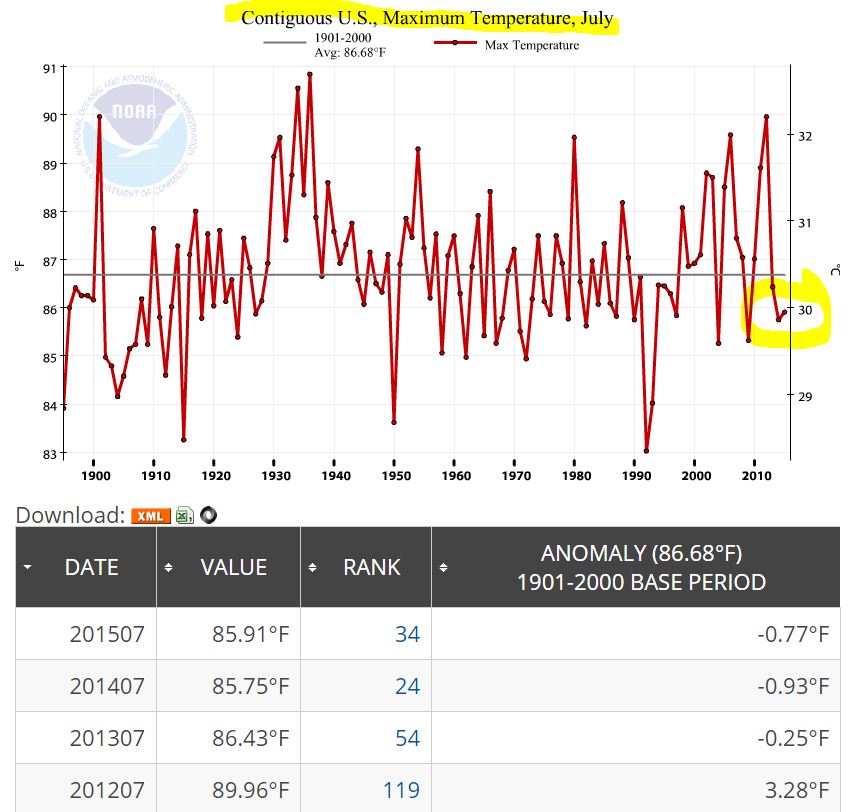
NOAA July 2015 – USA – Below Normal For 3rd Year in a Row
Update: Data here
According to the NOAA , Maximum temperatures in the USA were -0.77F colder than the 1901-2000 average.
1936 was ranked 121 (121 is hottest) and was 4.93F hotter than 2015.
2015 was only ranked 34.
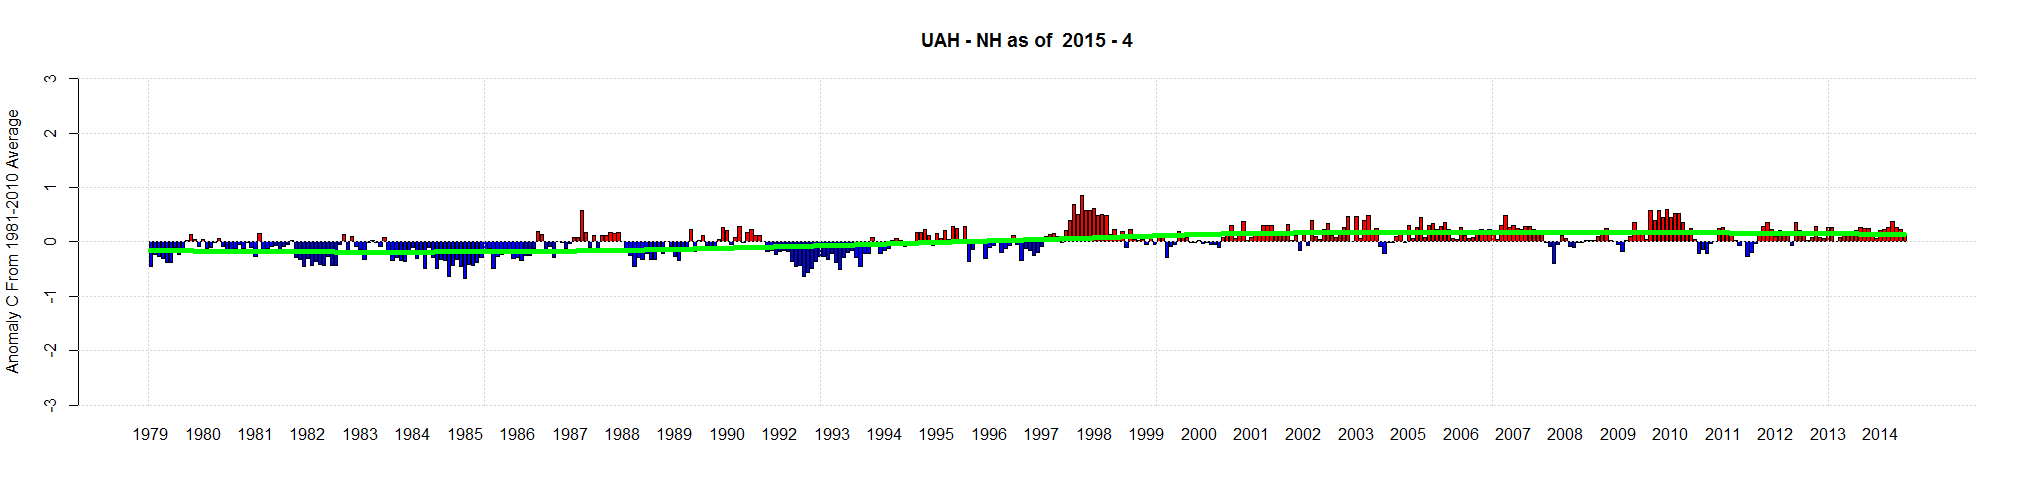
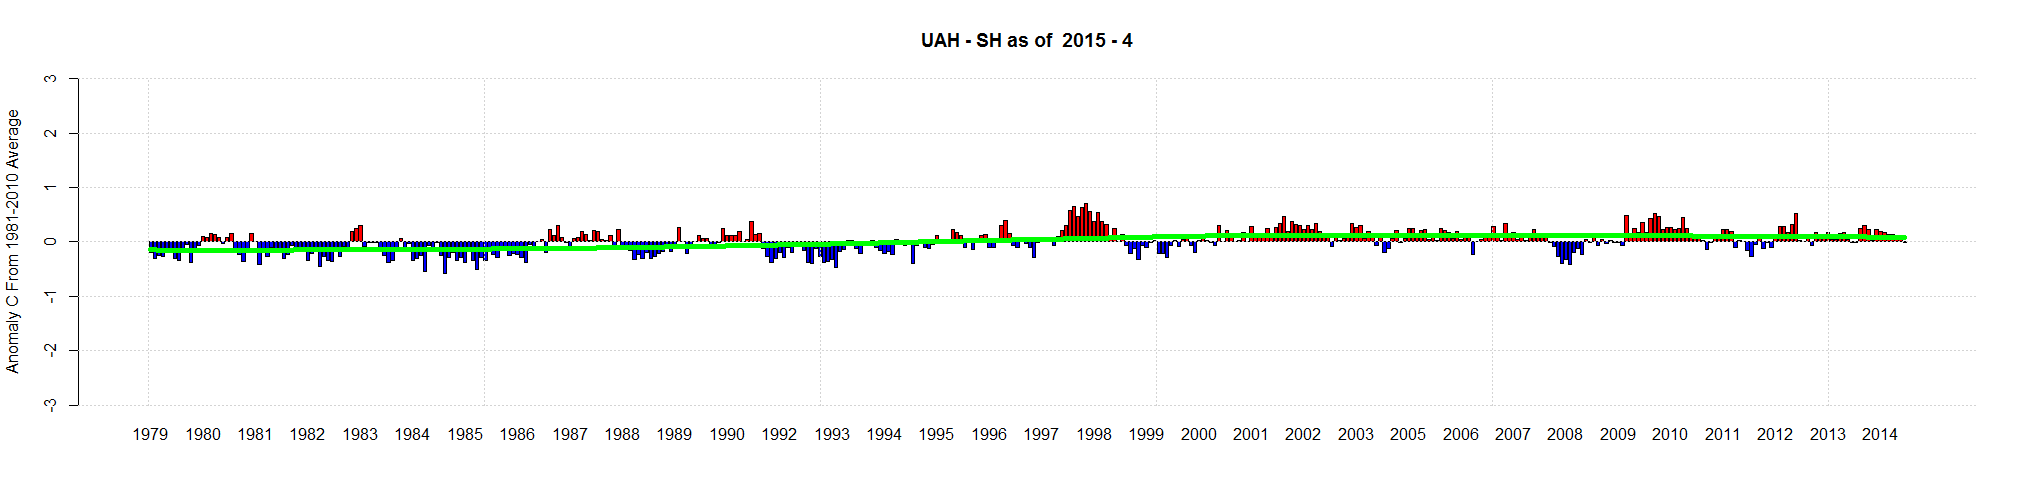
UAH April 2015 v6.0
The Streak – 1933/1934 and 2011/2012
The Hockey Schtick blog brought a recent paper to my attention.
The abstract says:
“A recent observation in NOAA’s National Climatic Data Center’s monthly assessment of the state of the climate was that contiguous US average monthly temperatures were in the top third of monthly ranked historical temperatures for thirteen straight months from June 2011 — June 2012. The chance of such a streak occurring randomly was quoted as (1/3)13, or about one in 1.6 million.”
I’m not going to discuss the “chances”. But I am going to simply note the following.
The NOAA ranks months temperature and precipitation based on the number of months from 1895. So 2012 was the 118th year. If a month is ranked 118 (as of 2012) then it was the warmest month from 1895 to 2012.
Using the same 12 month June to June time frame and using data from October 2012 ( before NOAA’s recent update) it took me about 10 minutes to find out a similar streak.
From June 1933 to to June 1934 8 months were ranked 100 and above. 2 of them were ranked 118.
From June 2011 to June 2012 8 months were ranked 100 and above. 1 of them was ranked 118.
| year | Month | Rank |
| 1933 | 6 | 118 |
| 1933 | 7 | 104 |
| 1933 | 9 | 116 |
| 1933 | 12 | 115 |
| 1934 | 1 | 114 |
| 1934 | 4 | 107 |
| 1934 | 5 | 118 |
| 1934 | 6 | 108 |
| year | Month | Rank |
| 2011 | 7 | 114 |
| 2011 | 8 | 117 |
| 2012 | 1 | 115 |
| 2012 | 2 | 104 |
| 2012 | 3 | 118 |
| 2012 | 4 | 116 |
| 2012 | 5 | 117 |
| 2012 | 6 | 107 |
What are the odds of that occurring 80 years apart!
