
Category: Jaxa
DMI Arctic Ice Chart Shows 2016 Crossing 2012
2012 was the lowest minimum sea ice according to most sea ice extent charts.
DMI is now showing 2016 crossing to be higher than 2012. JAXA doesn’t show this yet.

Jaxa Version 2 – All The Graphs Updated
Yesterday I posted all the JAXA V2 versus V1 graphs. I was in a rush and I didn’t set the axis to be identical.
Here are the fixed graphs:


Jaxa Version 2 – Increased Difference Between 2007 and 2012 by 200,000 sq km.
Yesterday I graphed the difference between JAXA version 1 and version 2 here and here.
Some AGW apologists said “Whats the big deal … the rankings didn’t change?”
So I graphed the difference between the 2007 minimum (2nd lowest) and the 2012 minimum (lowest).
Guess what? JAXA V2 increased the difference between 2007 and 2012 by 200,000 sq km. V2 dropped 2007 by 200,000 sq km. V2 dropped 2012 by 400,000 sq km.
Gotta love the AGW cult. They never lose an opportunity to adjust the data in their favor.
Red/pink are from 2007. V1 is red. V2 is pink.
Blue/lightblue are 2012. V1 is blue. V2 is lightblue.

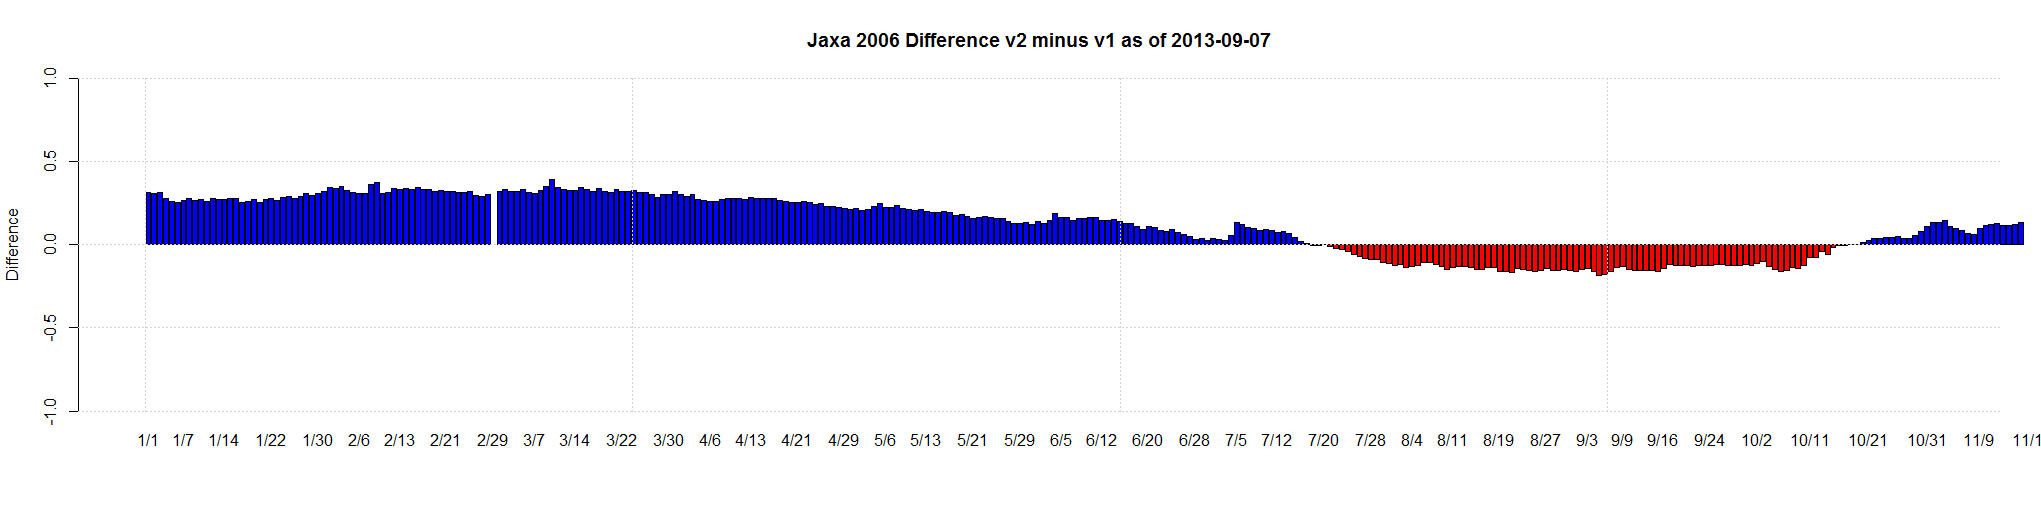
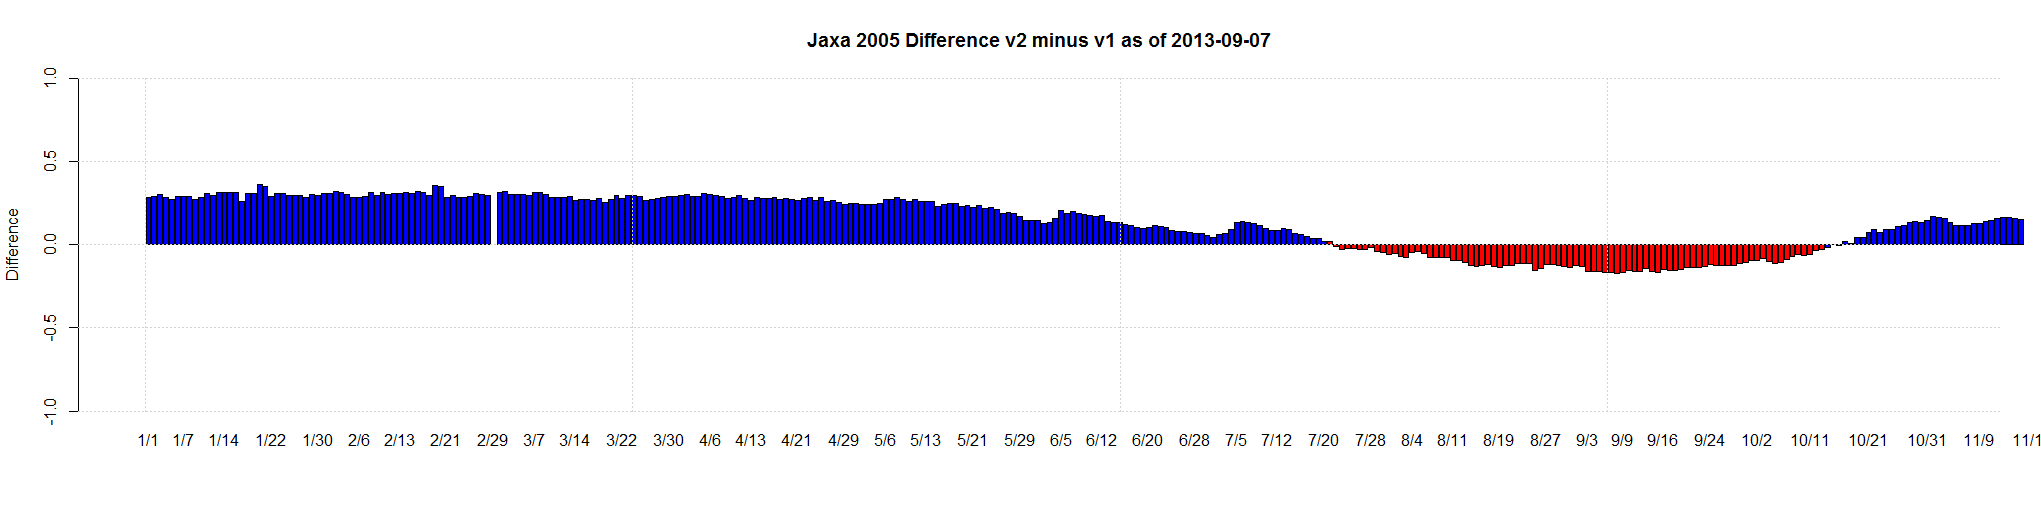
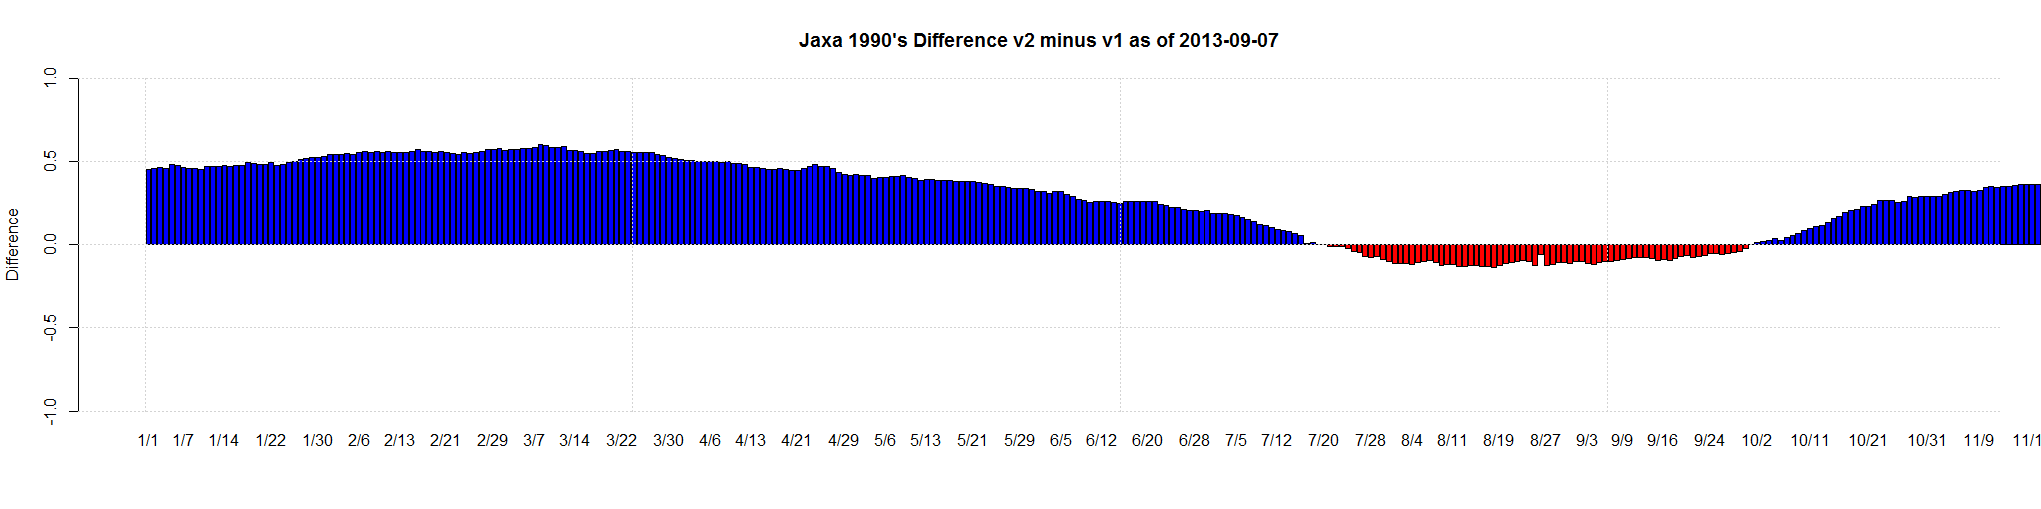
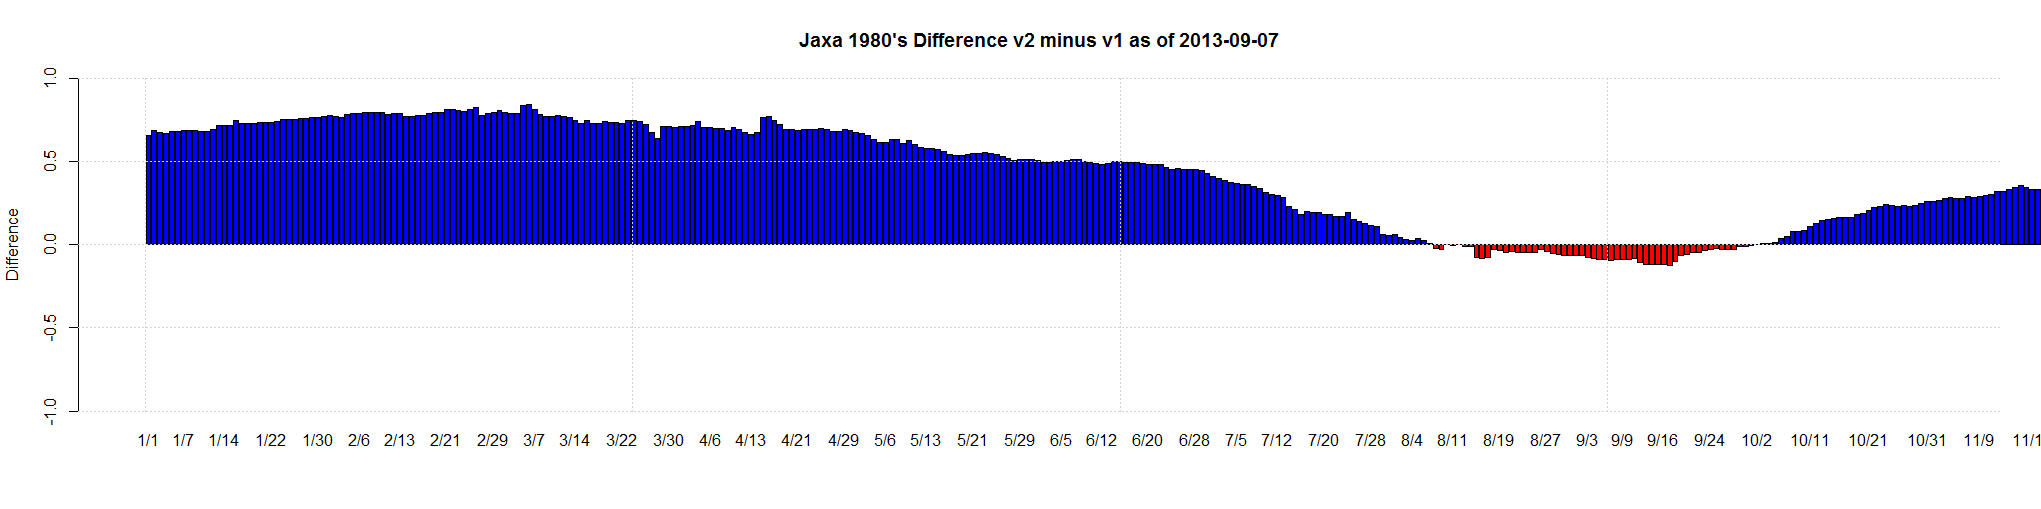
Jaxa Version 2 – All The Other Graphs Compared
UPDATE: Graphs with identical axis here.
Earlier today I noted that JAXA version 2 is out and I certainly didn’t like the new revision.
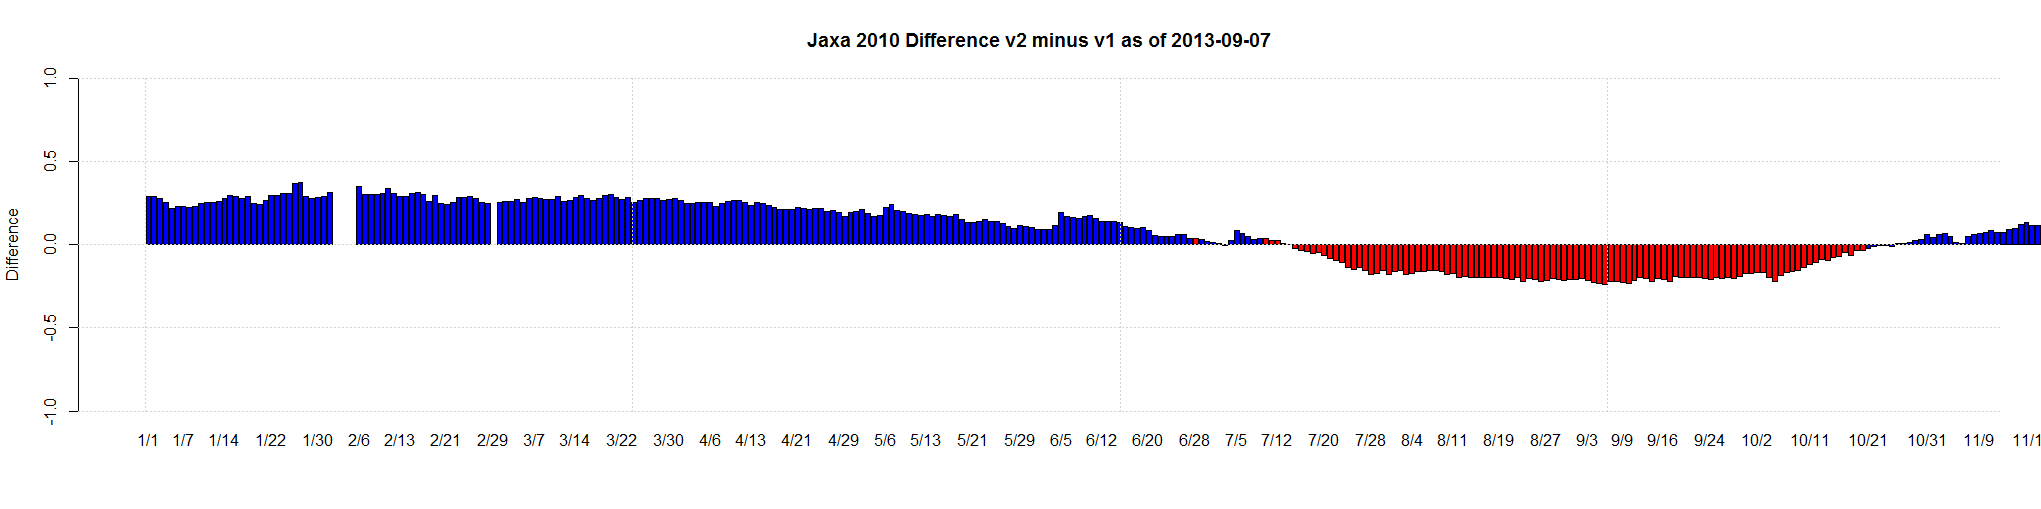
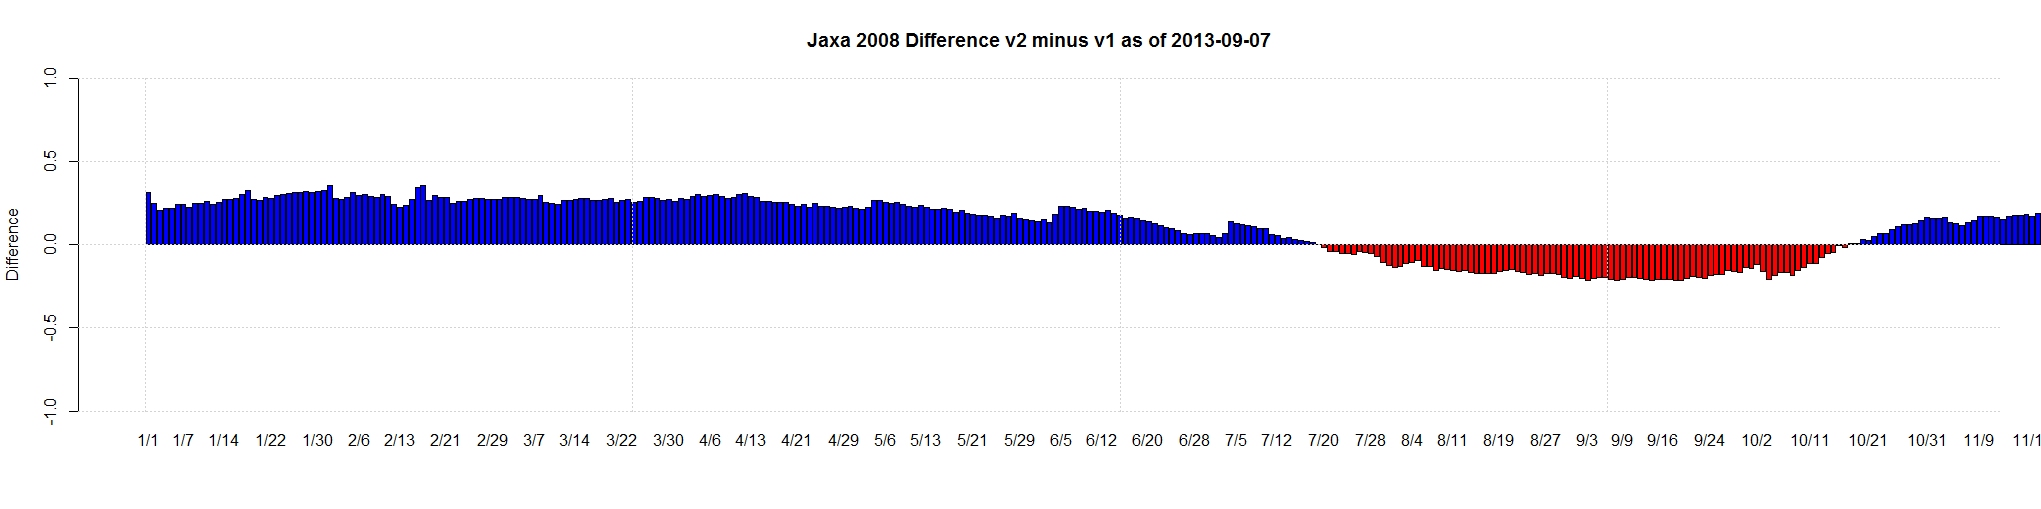
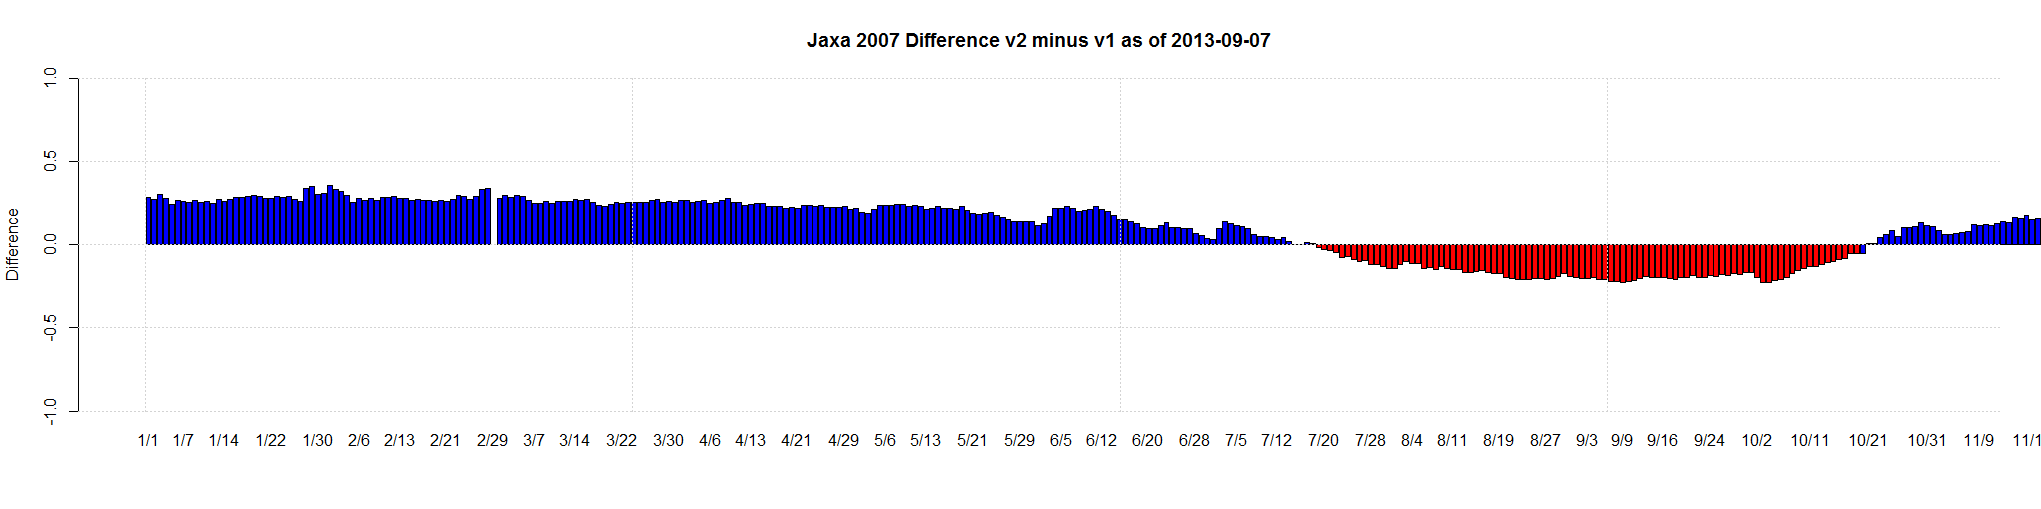
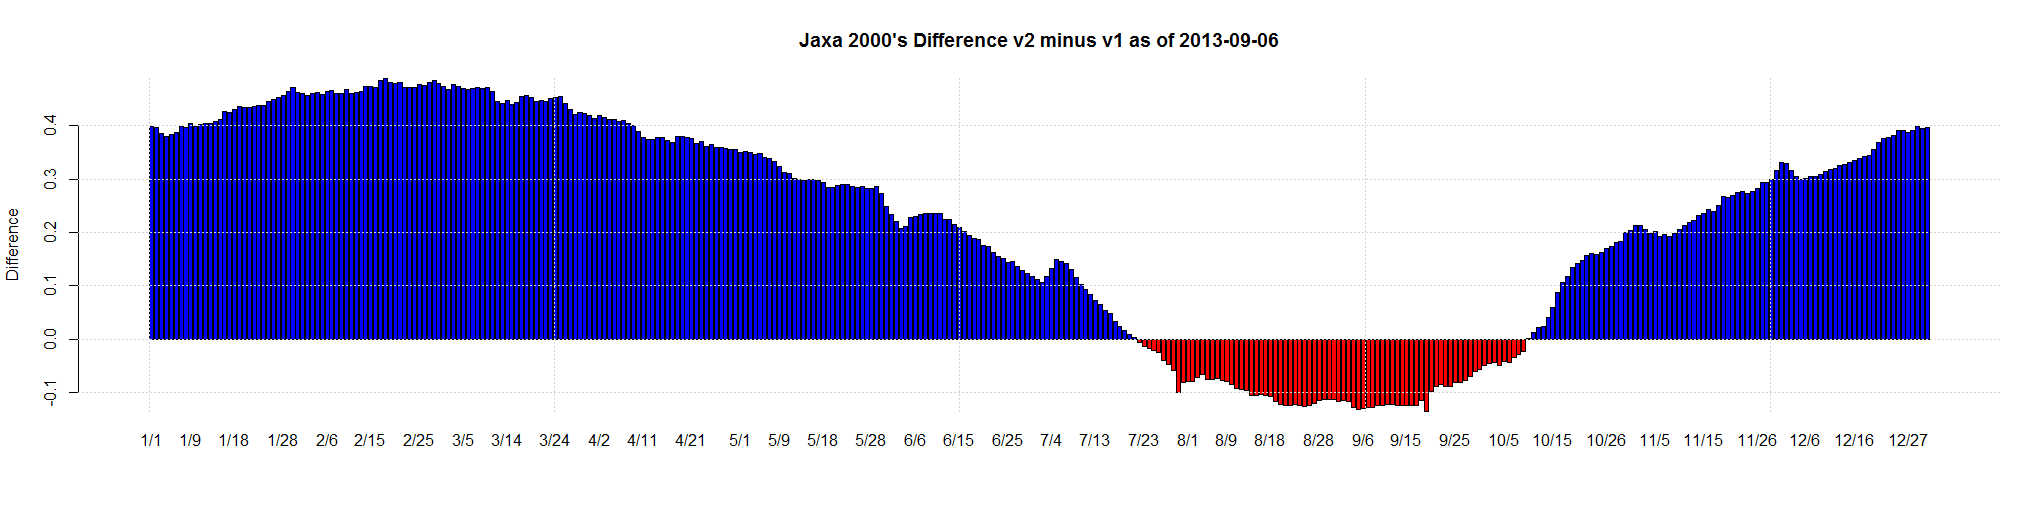
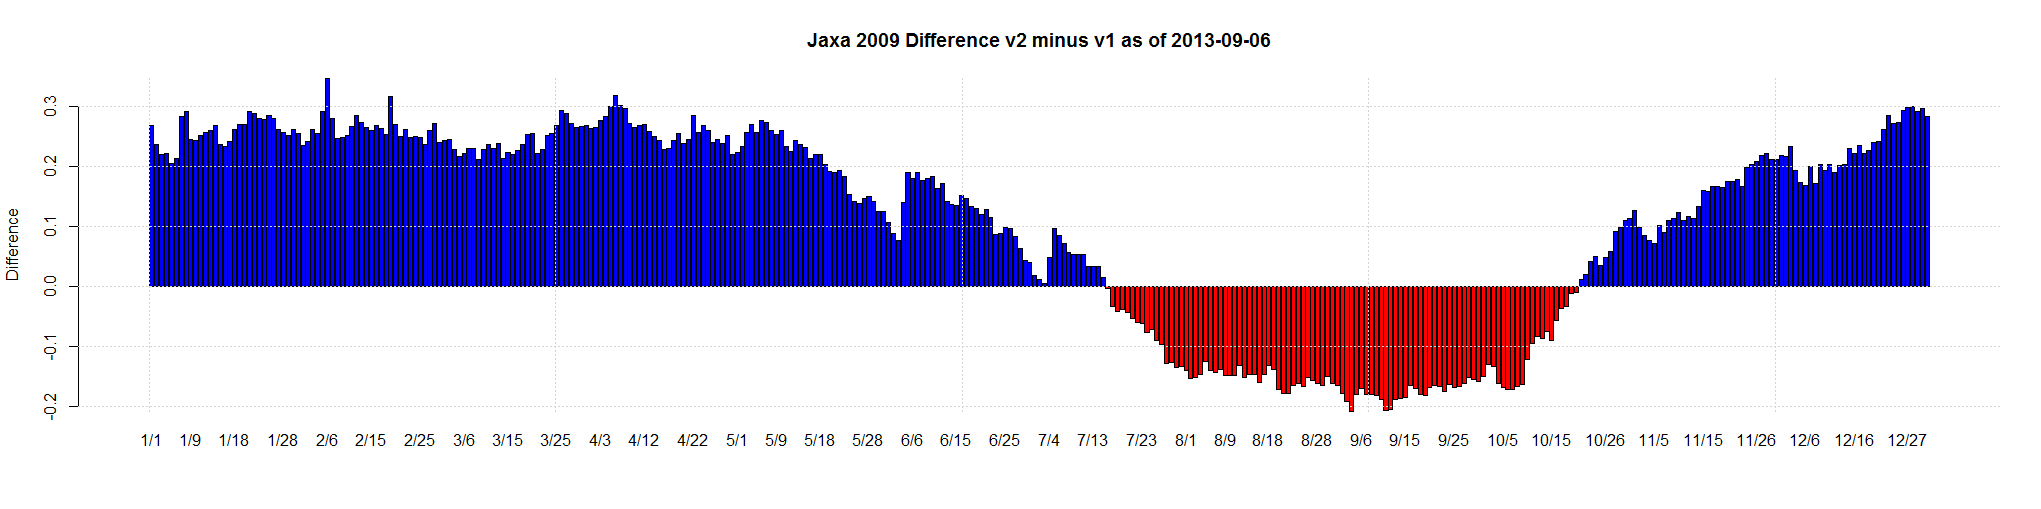
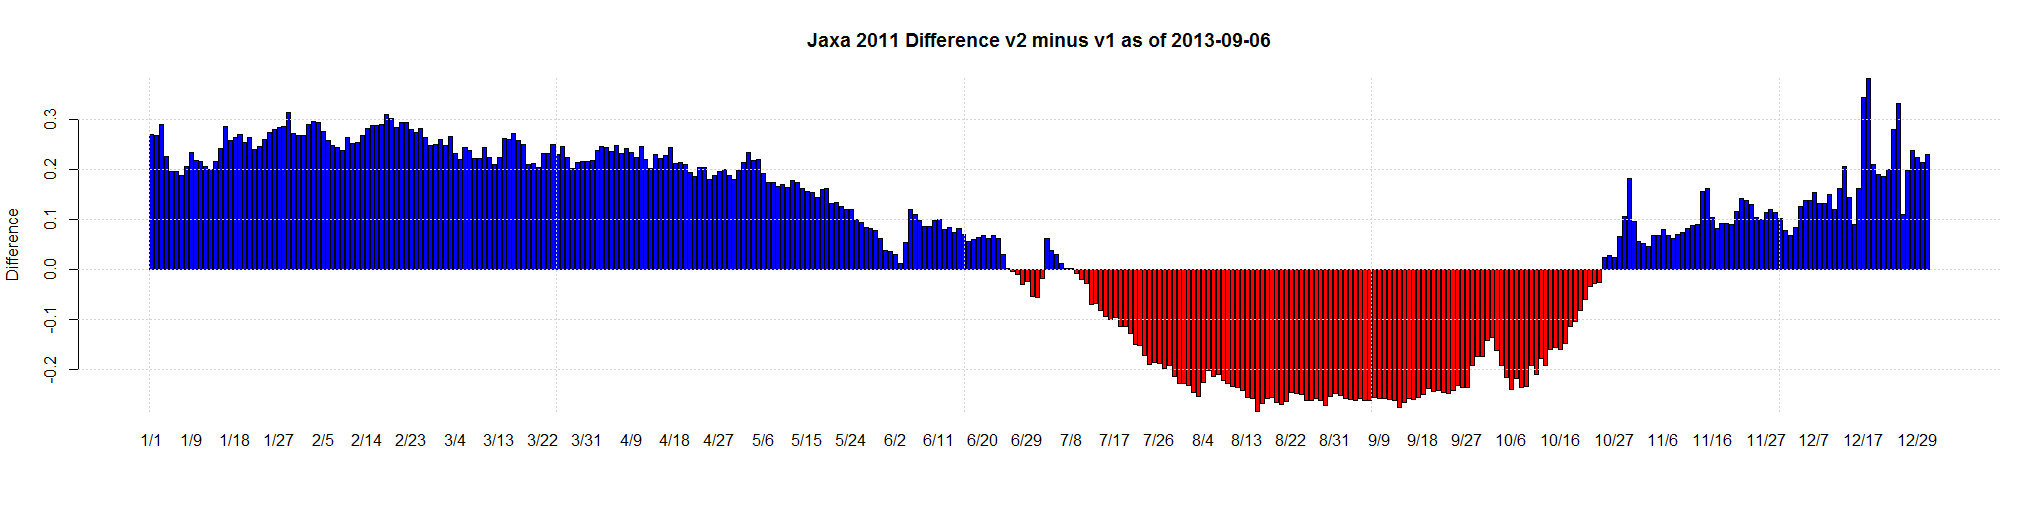
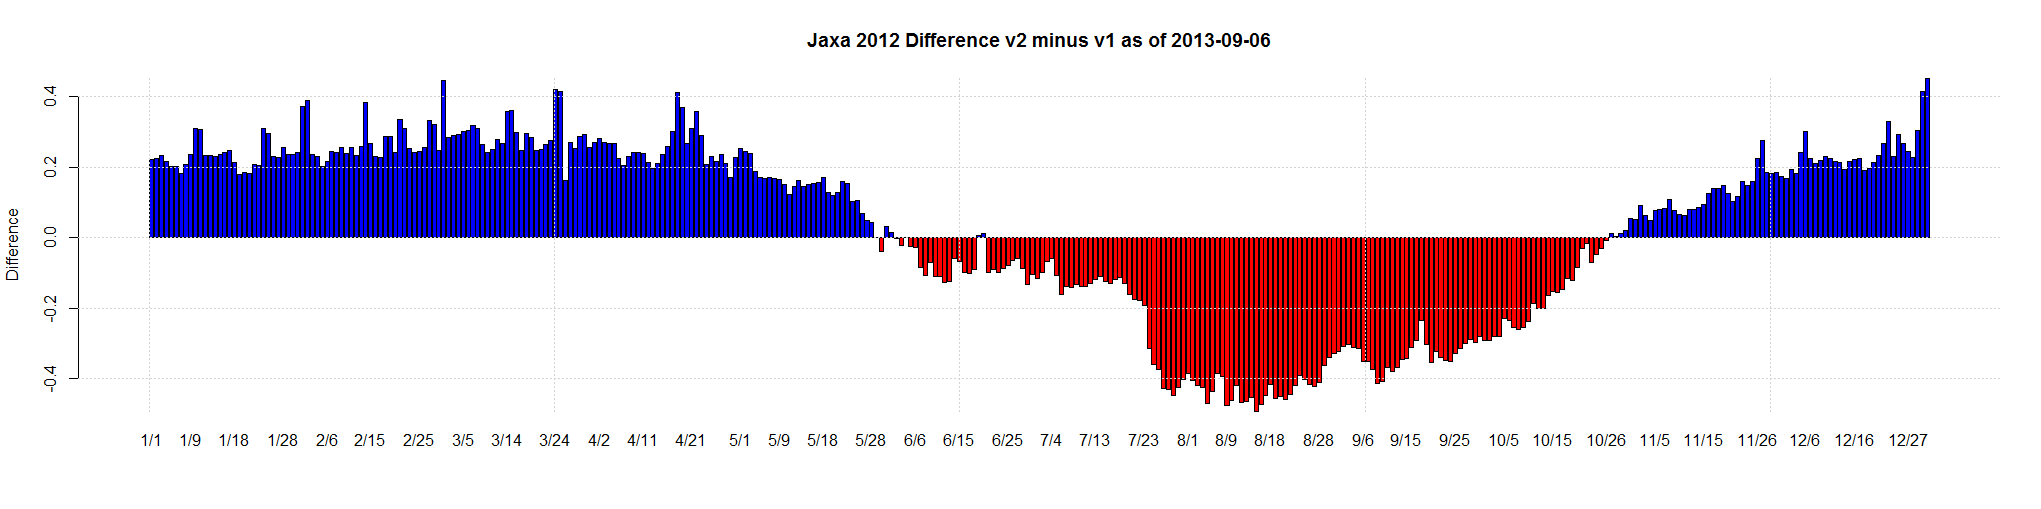
Here are all the years/decades compared. Remember the 1980’s, 1990’s and 2000’s are averages for the whole decade. And 2002 is incomplete and starts in June. And 2013 is incomplete because the year isn’t over.
I don’t understand how the 1980s / 1990s / 2000s “red” adjustment is so small compared to 2013 etc.


Jaxa Version 2 – Make The Low Even Lower (and the Great Big Con continues)
UPDATE: All the graphs are here.
Jaxa is one of the other sea ice monitoring agencies. They just came out with a version 2 of their data.
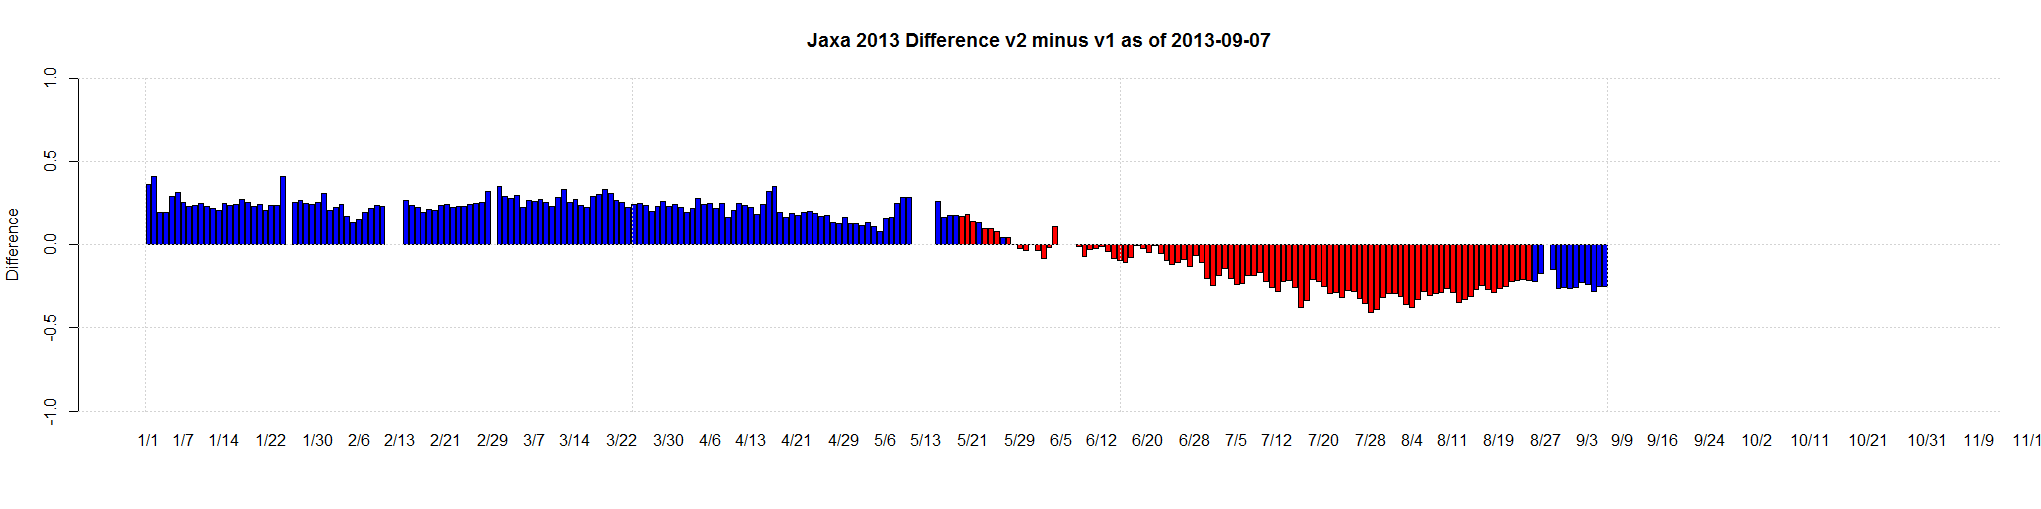
I thought … why not graph the difference between version 1 and version 2 for 2013.
Red = Version 2 Lower Than Version 1
Blue = Version 2 Higher Than Version 1
Guess what the following graph shows? It makes the minimum dramatically lower (400,000 sq km lower) and the maximum higher so the minimum looks even worse when graphed.
For shame.

