NOAA October 2015 – USA – 20th Wettest (Tied With 1900 and 1972)

According to the NOAA, October 2015 was ranked 102 out of 121 for precipitation.

20th Wettest! (Tied With 1900 and 1972)

5.5x as much rain as 1952. Permanent AGW Drought? Bull****.

Capture


Take a look at all the green states. Green is near record rainfall. Light green is much above normal.

Capture

NOAA Precipitation Update as of Feb 2014 – Last 12 Months Were Normal

I missed this when it came out last month, but according to the NOAA Precipitation for the 12 month period ending February 2014 was normal.

It was .19 inches above the 1901-2000 mean.

Wasn’t there supposed to be a permanent “Climate Change” drought?


NOAA_Feb_2014_Precipitation_12 Months


Addendum: If you split the NOAA Climate History in two (March – February), these are the averages:

1895 – 1955 = 29.45 inches

http://www.ncdc.noaa.gov/cag/time-series/us/110/00/pcp/12/02/1895-2014?base_prd=true&firstbaseyear=1896&lastbaseyear=1955

1956 – 2014 = 30.44

http://www.ncdc.noaa.gov/cag/time-series/us/110/00/pcp/12/02/1895-2014?base_prd=true&firstbaseyear=1956&lastbaseyear=2014


One last one:

1980 – 2014 = 30.75 inches

http://www.ncdc.noaa.gov/cag/time-series/us/110/00/pcp/12/02/1895-2014?base_prd=true&firstbaseyear=1980&lastbaseyear=2014


Climate Change … bringer of slightly more precipitation.

California February 2014 – Almost 6 Times As Much Rain Compared to January

Update: I had 2013 in the title. Sorry. (thanks justsoeguy31167)

According to the NOAA, California averaged 3.43 inches of rain in February 2014, which was only .42 inches below the 1901-2000 mean.

That is about 5.7X as much rain compared to January when California only averaged only .6 inches of rain.

One month of average rainfall won’t end a drought, but it sure helps.

NOAA_Feb_2014_California_Rainfall

Winter Rainfall UK 1910 to Jan 2014

Because of the floods, they are arguing about the amount of rainfall due to “climate change” over in the UK. Looking at the data from the UK Met for winter rainfall, it appears rainfall goes up and down.

I wonder if the usual AGW alarmist media blamed climate change for the dry period 2009 to 2011? Do I have to ask? Of course they did!

Guardian 17 November 2011: As well as the recent dry weather, water companies and environment regulators are expecting the UK to have more frequent dry winters as a result of climate change.

The graph below is Dec/Jan/Feb anomalies from the 1981-2010 mean. Click for a bigger version.

UK WINTER Rainfall Anomaly From 1981-2010 Mean

5th Wettest July in USA History – NOAA 2013

With all the claims about 2012 being the worst drought in USA history (total joke), I thought I would mention that July 2013 was the 5th wettest July ever according to the NOAA.

Only 1950, 1958, 1992 and 1915 were wetter. July 2013 was .71 inches above the 1901 – 2000 average. July 1930 was the driest.

The 1895 to 2013 trend for precipitation in July is 0. Flat. No trend at all. Perfectly average.

Year To Date precipitation for 2013 is 23rd wettest. 1.54″ above the long term average.

NOAA_July_2013_USA_Precipitation

Precipitation Canada February 2013

The data is from the monthly summaries put out by Environment Canada. The Normals are the station where the anomaly from the 1971-2000 average is calculated by EC.

Precipitation is in mm of rain equivalent. Some of it would be snow. About 25mm to the inch for the non-metric.

Boat Bluff’s 677mm is about 27 inches. In one month.  Toronto had 328% of normal. Triple.

Top 10 Wettest Stations in Canada by % of Normal. (Only stations with EC Normals)

Province Station Year Month Precipitation (mm) Precipitation % of Normal
ONT TORONTO 2013 2 165.4 328
SASK LEROY 2013 2 27 244
ONT TORONTO LESTER B. PEARSO 2013 2 92 216
SASK QUAPPELLE 1 2013 2 25.1 212
ONT WROXETER 2013 2 117.9 211
QUE GASPE A 2013 2 121.8 206
ONT FOLDENS 2013 2 98.4 192
SASK DUVAL 2013 2 20.6 186
NU RANKIN INLET A 2013 2 16.2 183
NWT FORT SIMPSON A 2013 2 31.6 181

Top 10 Wettest Stations by amount of precipitation.  Any station is eligible. NA means EC does not calculate normals.

Province Station Year Month Precipitation (mm) Precipitation % of Normal
BC BOAT BLUFF 2013 2 677.2 147
BC ZEBALLOS MURAUDE CREEK 2013 2 473.9 NA
BC TOFINO A 2013 2 469.6 NA
BC ESTEVAN POINT 2013 2 430.8 125
BC PRINCE RUPERT MONT CIRC 2013 2 430.7 NA
BC ADDENBROKE ISLAND 2013 2 425.4 NA
BC LENNARD ISLAND 2013 2 419.5 120
BC BELLA BELLA 2013 2 396 NA
BC PORT ALICE 2013 2 387.2 101
BC TAHSIS VILLAGE NORTH 2013 2 370.5 NA

Are Toronto City Councillors Dumber Than A Sack Of Hammers?

Are Toronto City Councillors  Dumber Than A Sack Of Hammers?

Some climate committee wants them to spend billions to deal with huge new increases in projected rainfall.

“Toronto must overhaul its aging infrastructure to adapt to dramatic new climate change projections — a process that could cost billions — say some councillors and environmentalists.”

“The city’s roads, sewers, storm drains and electrical grids were simply not built to withstand the new climate, said Councillor Gord Perks, a member of the committee.”

What new climate??????

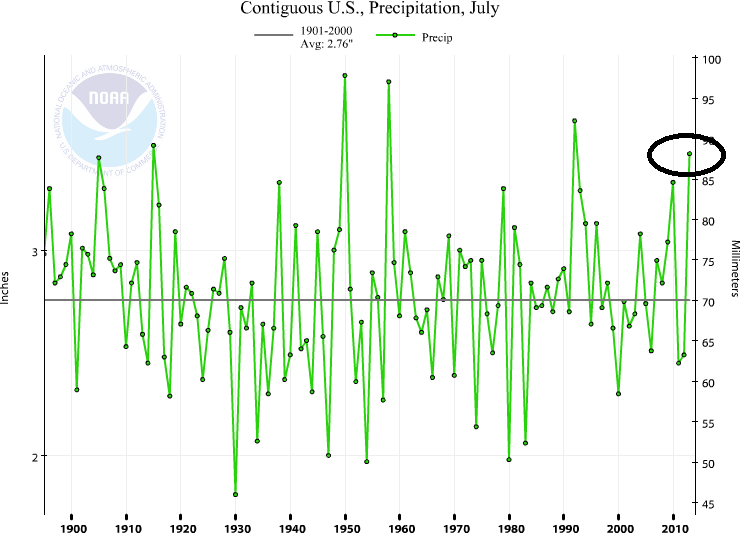
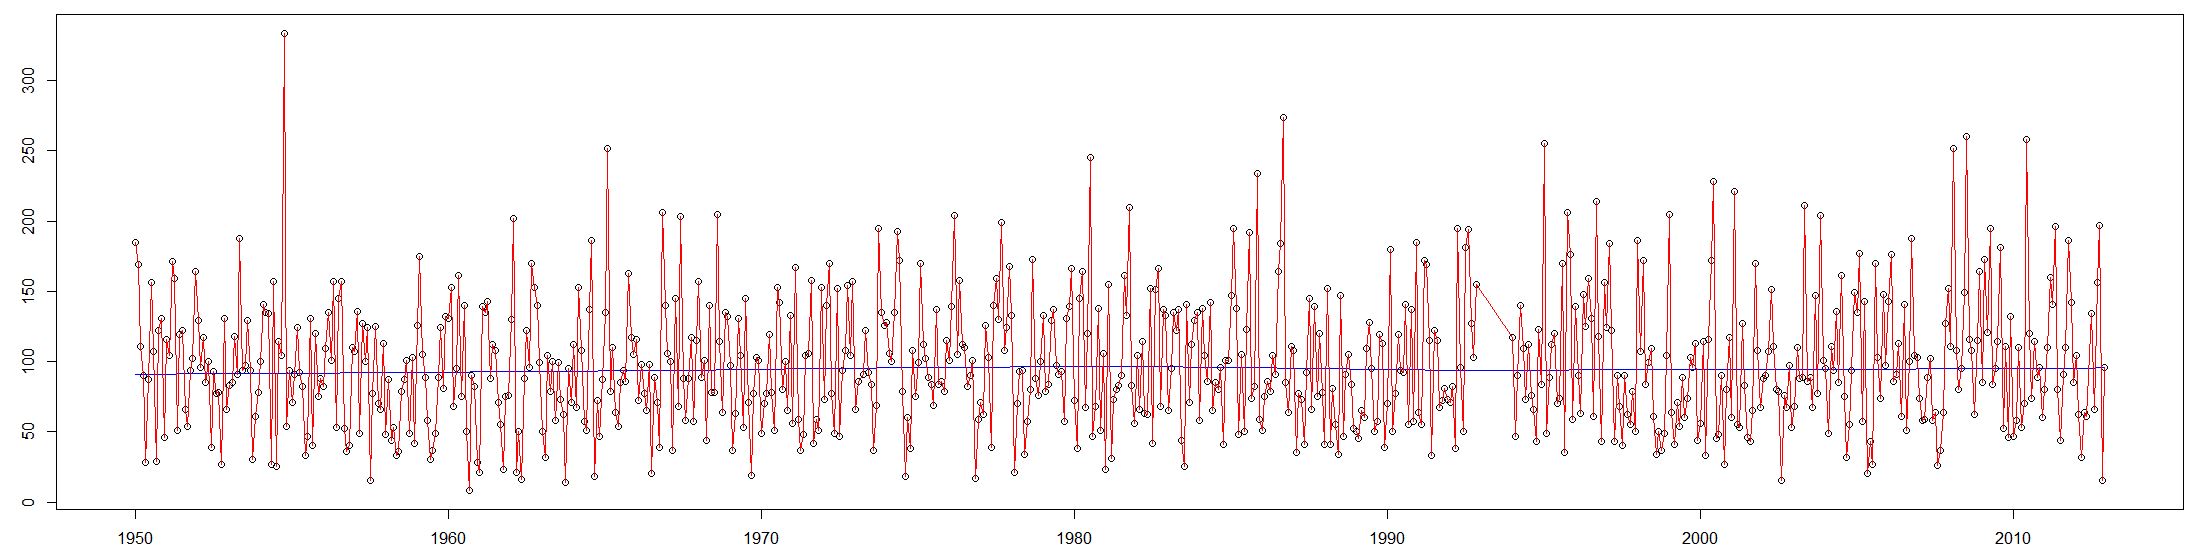
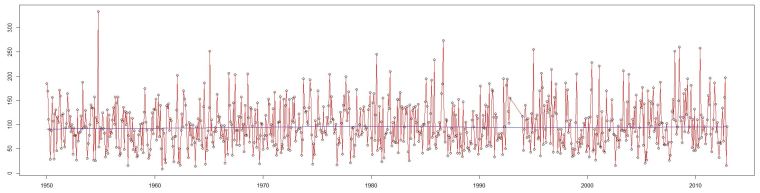
Here is rainfall data from Environment Canada for Toronto’s Pearson Airport from 1950.

There is no new trend in rainfall. Click on the graph to make it bigger. Values on the left are % of the 1971-2000 average. Each month with data is a dot. The blue line is the Loess Curve.

Toronto_Rainfall

NOAA September 2012 Precipitation

Four of the 48 continental US states set a record for lowest rainfall in September 2012 according to the NOAA. The ranks are out of 118 with 1 being driest. 19 out of the 48 states were below average (rank 59 and lower) and 29 were ranked above average.

Indiana, Kentucky, Mississippi, Missouri, Tennessee and Nebraska’s driest September were before 1900.

State Sep 2012 Sep Rank Driest Sep Lowest Rainfall Wettest Sep Highest Rainfall
Minnesota 0.56 1 2012 0.56 2010 6.7
Montana 0.15 1 2012 0.15 1986 3.71
North Dakota 0.24 1 2012 0.24 1900 5
South Dakota 0.24 1 2012 0.24 1986 4.27
Washington 0.11 2 1975 0.09 1959 4.78
Nebraska 0.51 3 1899 0.44 1973 6.5
Oregon 0.07 4 1999 0.03 1986 2.83
Idaho 0.19 7 1987 0.08 1959 3.23
Wisconsin 1.61 9 1952 0.78 1986 8.25
Wyoming 0.31 9 1979 0.22 1923 3.42
Iowa 1.62 15 1939 0.84 1926 9.75
California 0.1 24 1974 0.02 1904 2.42
South Carolina 2.36 24 2005 0.81 1928 13.12
Georgia 2.77 33 2005 0.93 2004 12.32
Michigan 2.69 36 1979 0.98 1986 8.62
Kansas 2.08 39 1956 0.29 1973 8.35
Florida 5.66 42 1921 2.13 1979 12.98
Oklahoma 2.9 55 1956 0.27 1945 7.86
New Mexico 1.49 58 1956 0.08 1941 5.84
Utah 0.85 61 1979 0.04 1982 3.71
Arizona 1.18 63 1953 0.02 1939 4.14
New Jersey 3.97 71 1941 0.27 1938 9.78
Colorado 1.4 72 1956 0.1 1961 2.93
Delaware 4.09 74 1941 0.15 1935 11.59
North Carolina 4.89 77 1990 1.22 1999 13.3
Maryland 4.16 81 1941 0.58 1999 10.45
Mississippi 4.15 85 1897 0.72 1906 10.06
Virginia 4.08 85 2005 0.79 1999 10.47
Nevada 0.69 90 1922 0.02 1982 2.57
Missouri 5.23 92 1897 0.7 1993 11.65
Rhode Island 5.2 92 1941 0.5 2008 9.51
Texas 4.01 92 1931 0.55 1936 6.9
Alabama 5.55 95 1984 0.66 1906 10.03
Maine 4.95 97 1948 1.26 1999 9.1
Massachusetts 5.32 97 1914 0.58 1933 9.66
Arkansas 5.19 98 2004 0.41 1913 9.94
Louisiana 6.01 98 1953 0.96 1913 12.92
Vermont 5.08 98 1908 0.96 1999 8.61
New Hampshire 5.46 99 1914 0.77 1938 9.81
New York 4.8 99 1964 1.18 1977 7.87
Connecticut 5.96 100 1914 0.35 1938 13.89
Pennsylvania 5.21 103 1943 0.79 2011 10.08
Illinois 5.12 104 1979 0.49 1926 9.68
Indiana 5.2 105 1897 0.6 1926 8.25
Tennessee 6.02 107 1897 0.6 1977 7.86
West Virginia 5.45 108 1985 0.69 2004 7.45
Kentucky 5.99 112 1897 0.28 2006 8.55
Ohio 5.57 115 1908 0.58 1926 7.16

The 1940-1959 period has the largest number of driest Septembers.