WUWT announced that CRUTEM4 is now on Google Earth.
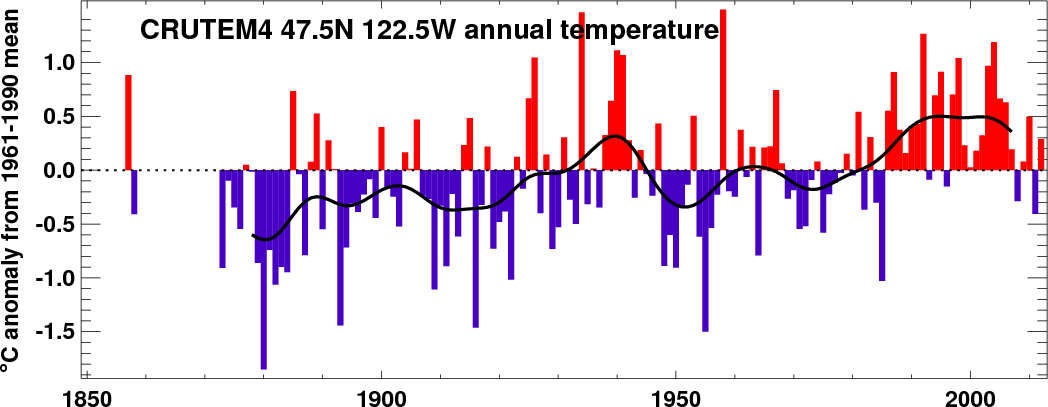
Of course the first thing I did was check out my grid square. Guess what? Its been warmer in the past and it is cooling now. No wonder I am not a member of the AGW Cult.
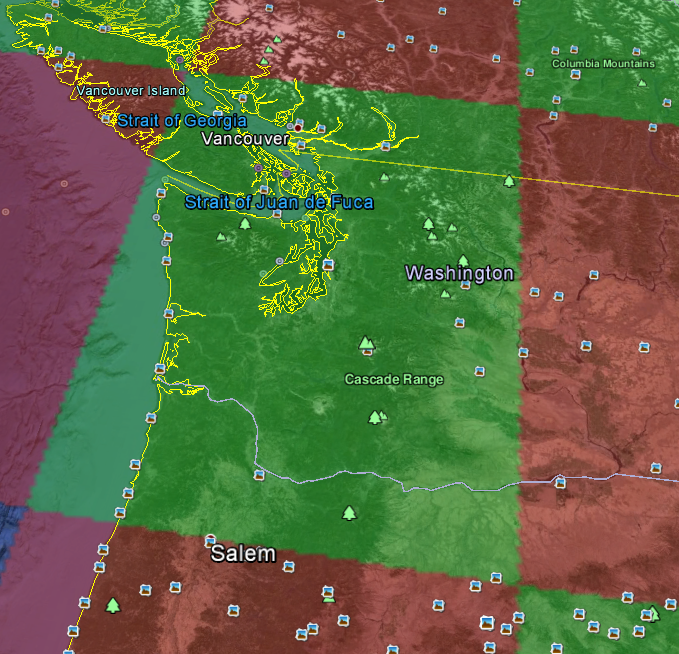
CRUTEM4 is the dataset put out by the Climate Research Unit as East Anglia.
Did you ever notice that the data for the Southern Hemisphere in the 1850s was really, really hot?
Like 2.9C warmer than 1961-1990 hot?
Here is a barplot of 1851 to 1856 and 2006 to 2013 mashed together so you can compare (click to make bigger):
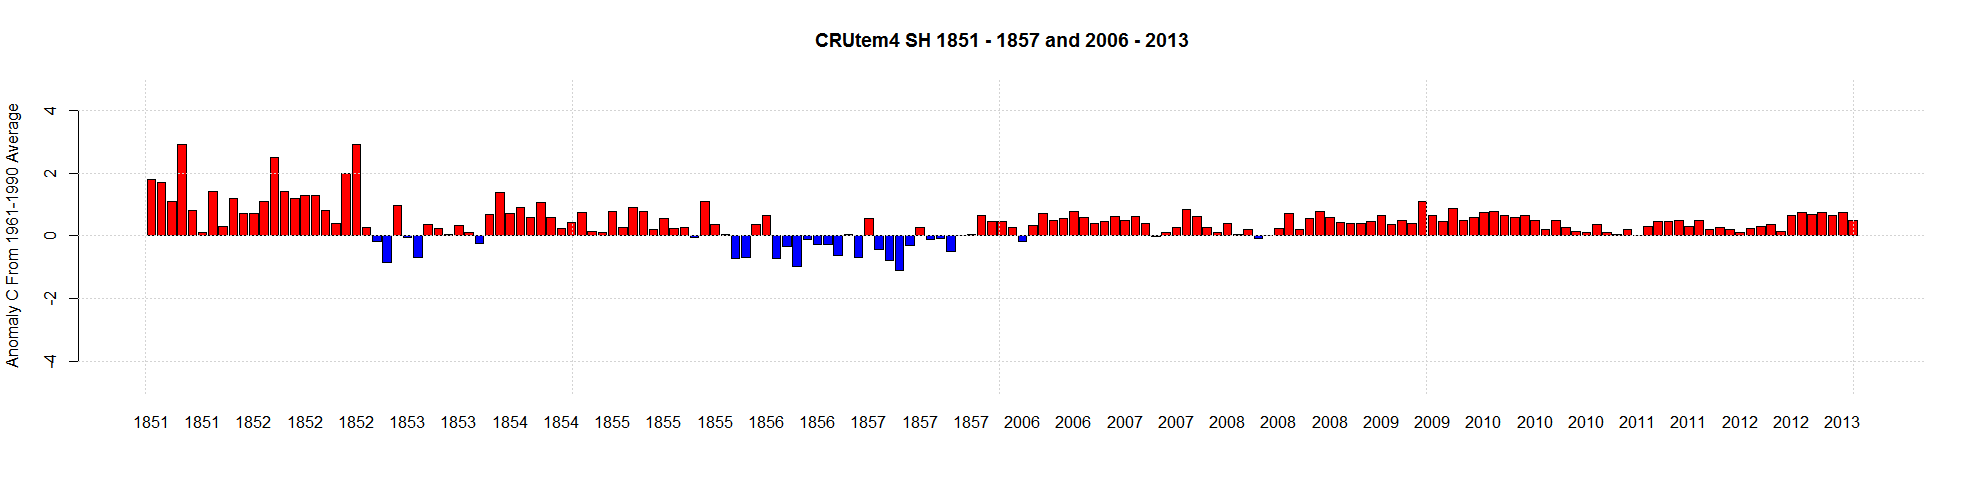
Here is a table of the same data. Only one post-2005 monthly anomaly would make the top 20:
| Year | Month | data1 |
| 1851 | 4 | 2.9 |
| 1852 | 12 | 2.9 |
| 1852 | 3 | 2.5 |
| 1852 | 11 | 2 |
| 1851 | 1 | 1.8 |
| 1851 | 2 | 1.7 |
| 1851 | 7 | 1.4 |
| 1852 | 4 | 1.4 |
| 1854 | 2 | 1.389 |
| 1852 | 6 | 1.3 |
| 1852 | 7 | 1.3 |
| 1851 | 10 | 1.2 |
| 1852 | 5 | 1.2 |
| 2009 | 8 | 1.106 |
| 1851 | 3 | 1.1 |
| 1852 | 2 | 1.1 |
| 1855 | 10 | 1.094 |
| 1854 | 6 | 1.047 |
| 1853 | 4 | 0.968 |
| 1855 | 3 | 0.909 |
