UAH Satellite Global Lower Temperature shows 2018 as 6th warmest.

UAH Satellite Global Lower Temperature shows 2018 as 6th warmest.
The Version 6.0 global average lower tropospheric temperature (LT) anomaly for September, 2018 was +0.14 deg. C, down a little from +0.19 deg. C in August:
This was the coolest September in the last 10 years in the global average.

UPDATE: The original version of this post had the y axis going from -1 to 1. I’ll leave those graphs at the bottom.
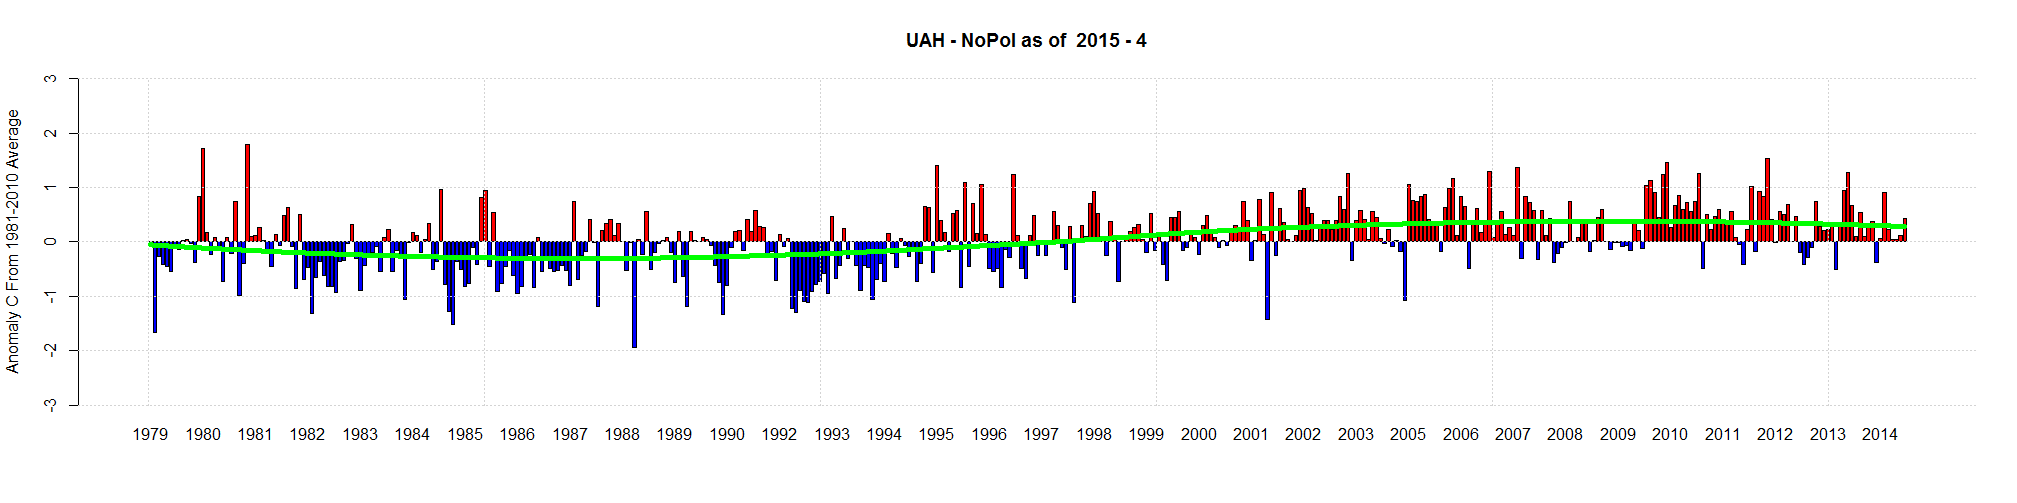
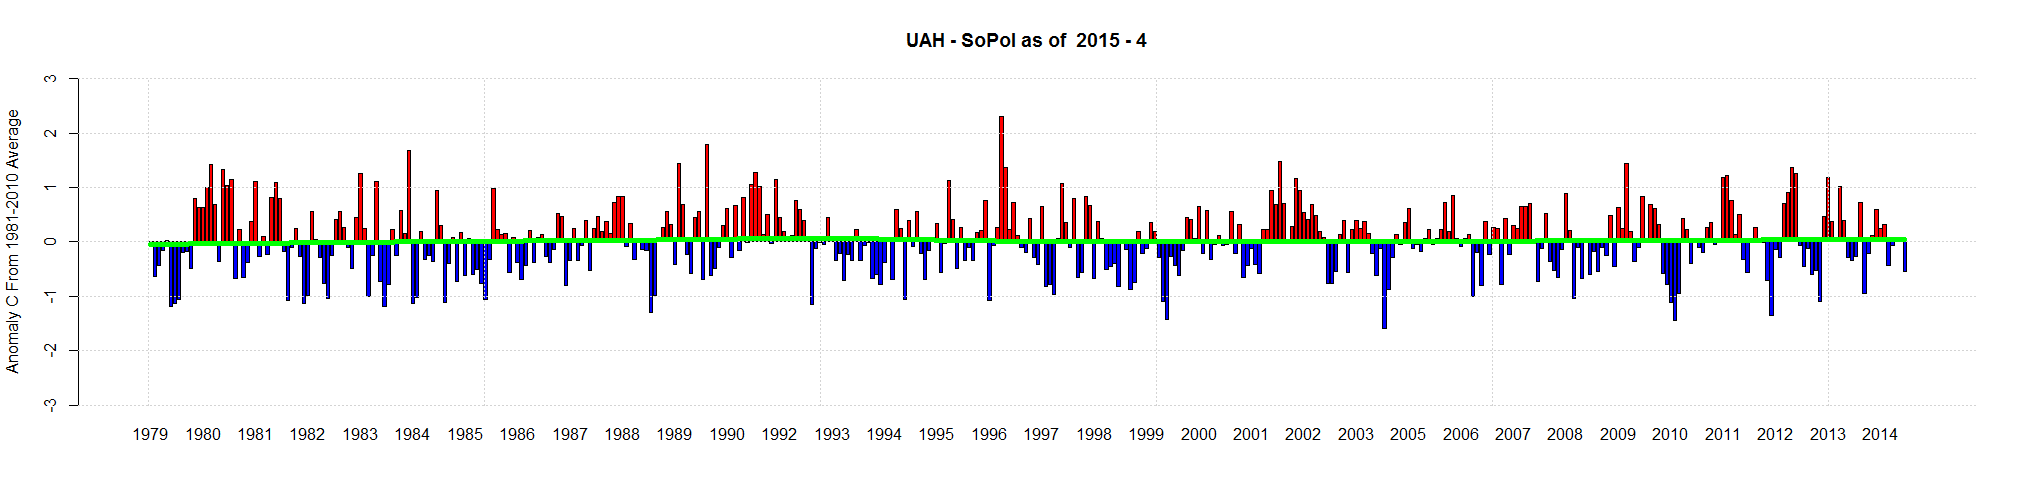
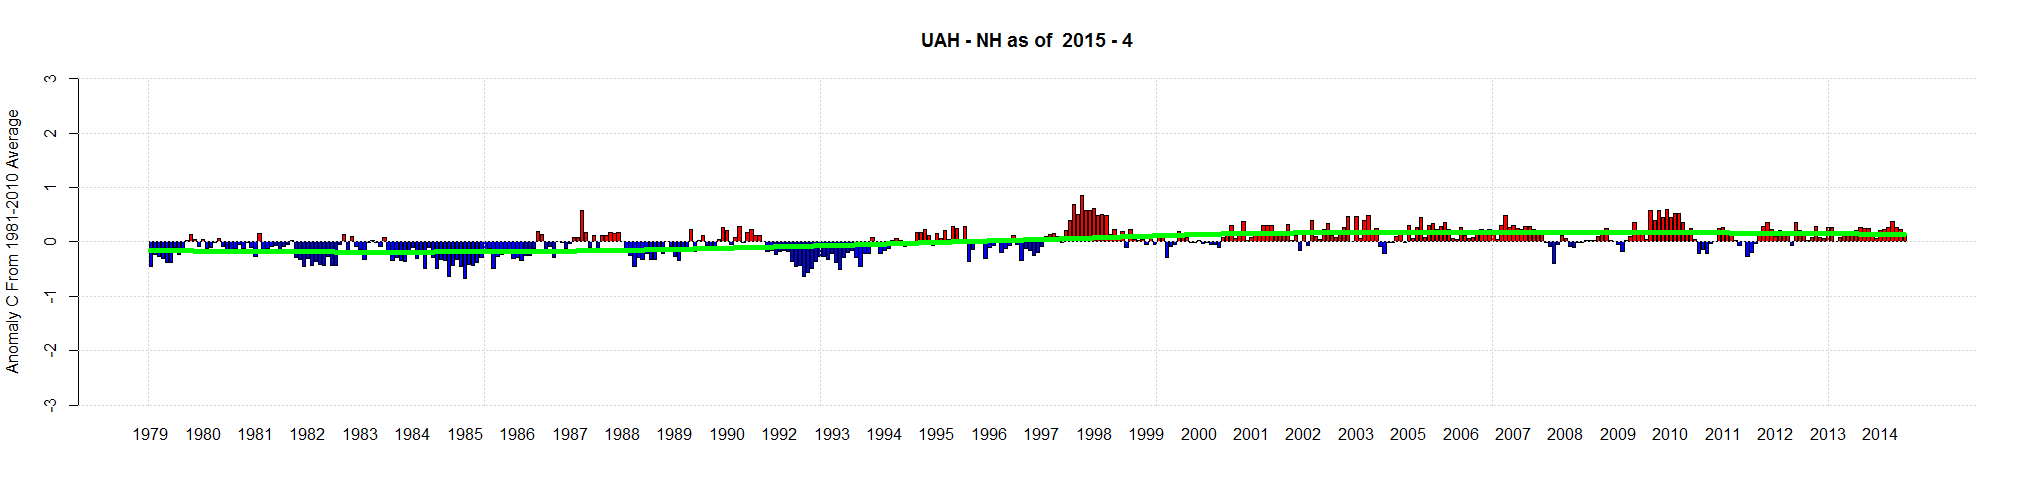
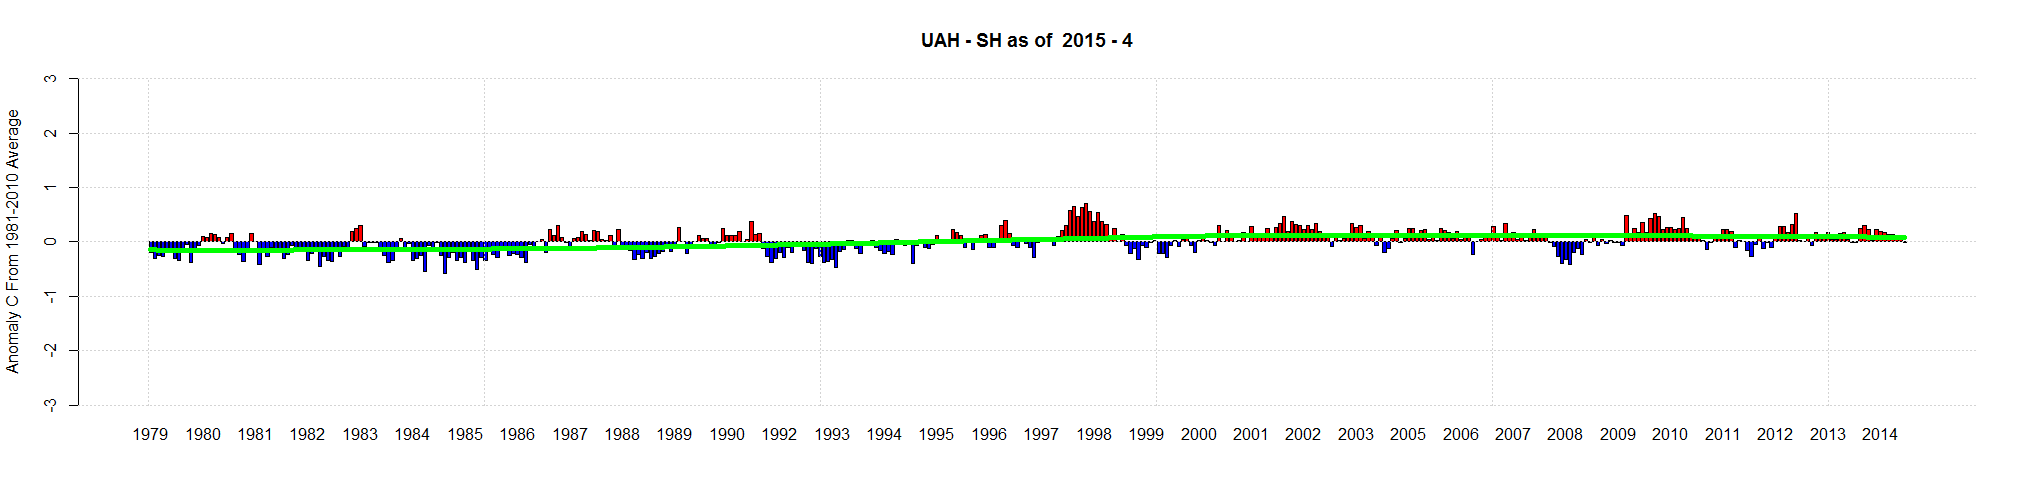
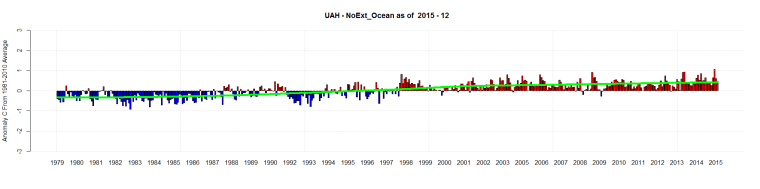
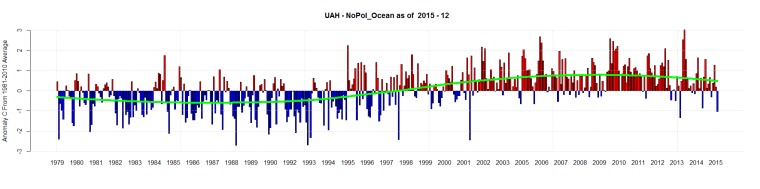
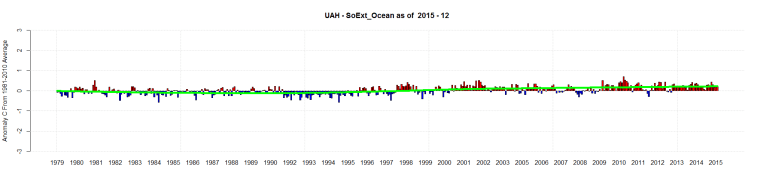
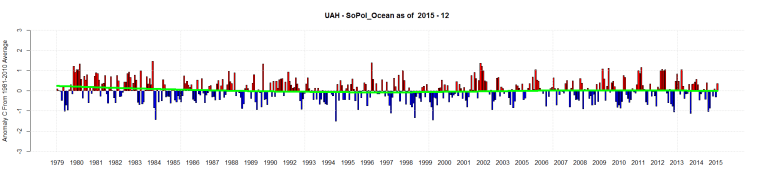
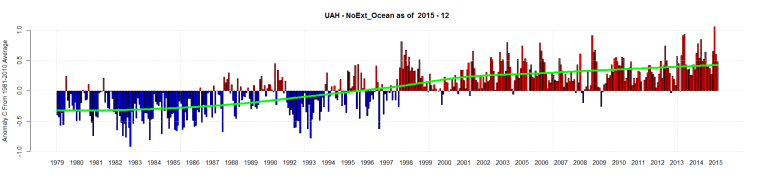
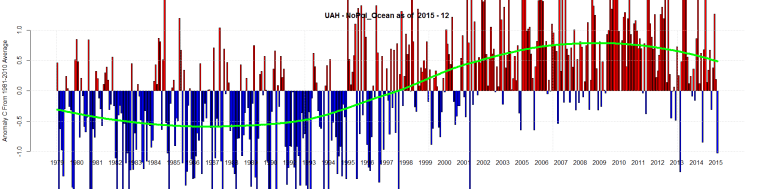
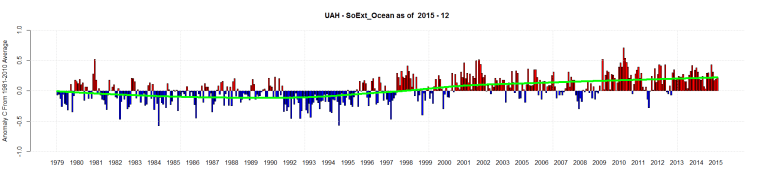
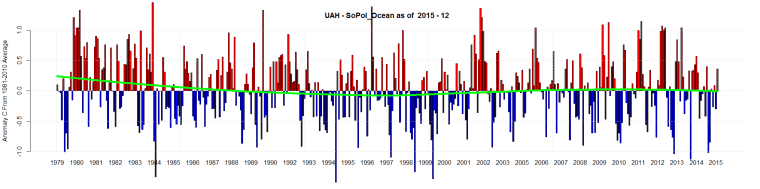
The new graphs have -3 to 3. Notice how much the NoPol Ocean temperatures fluctuate compared to the other 3 regions.
UAH for December 2015 is out.
Here is the South and North Pole Ocean Data plus the Southern and Northern Extent Ocean Data
Original graphs:
UAH is a satellite temperature dataset, developed at the University of Alabama in Huntsville.
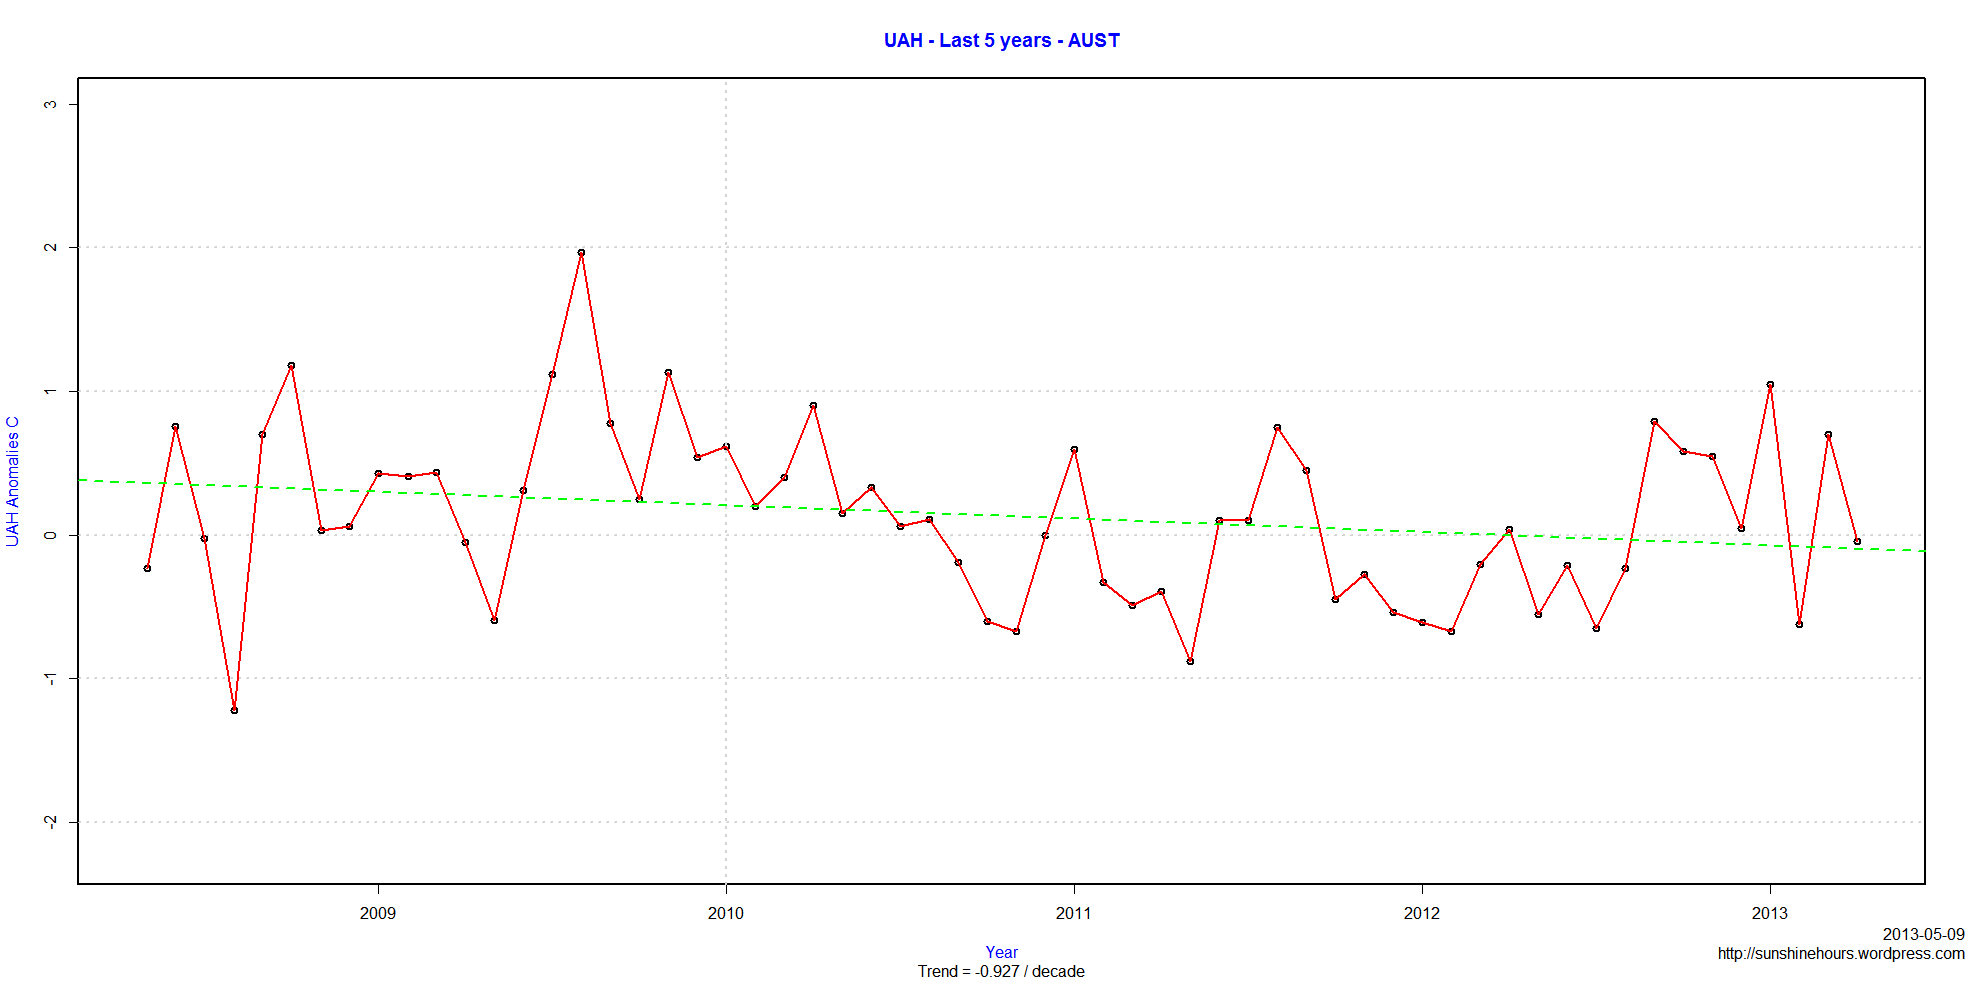
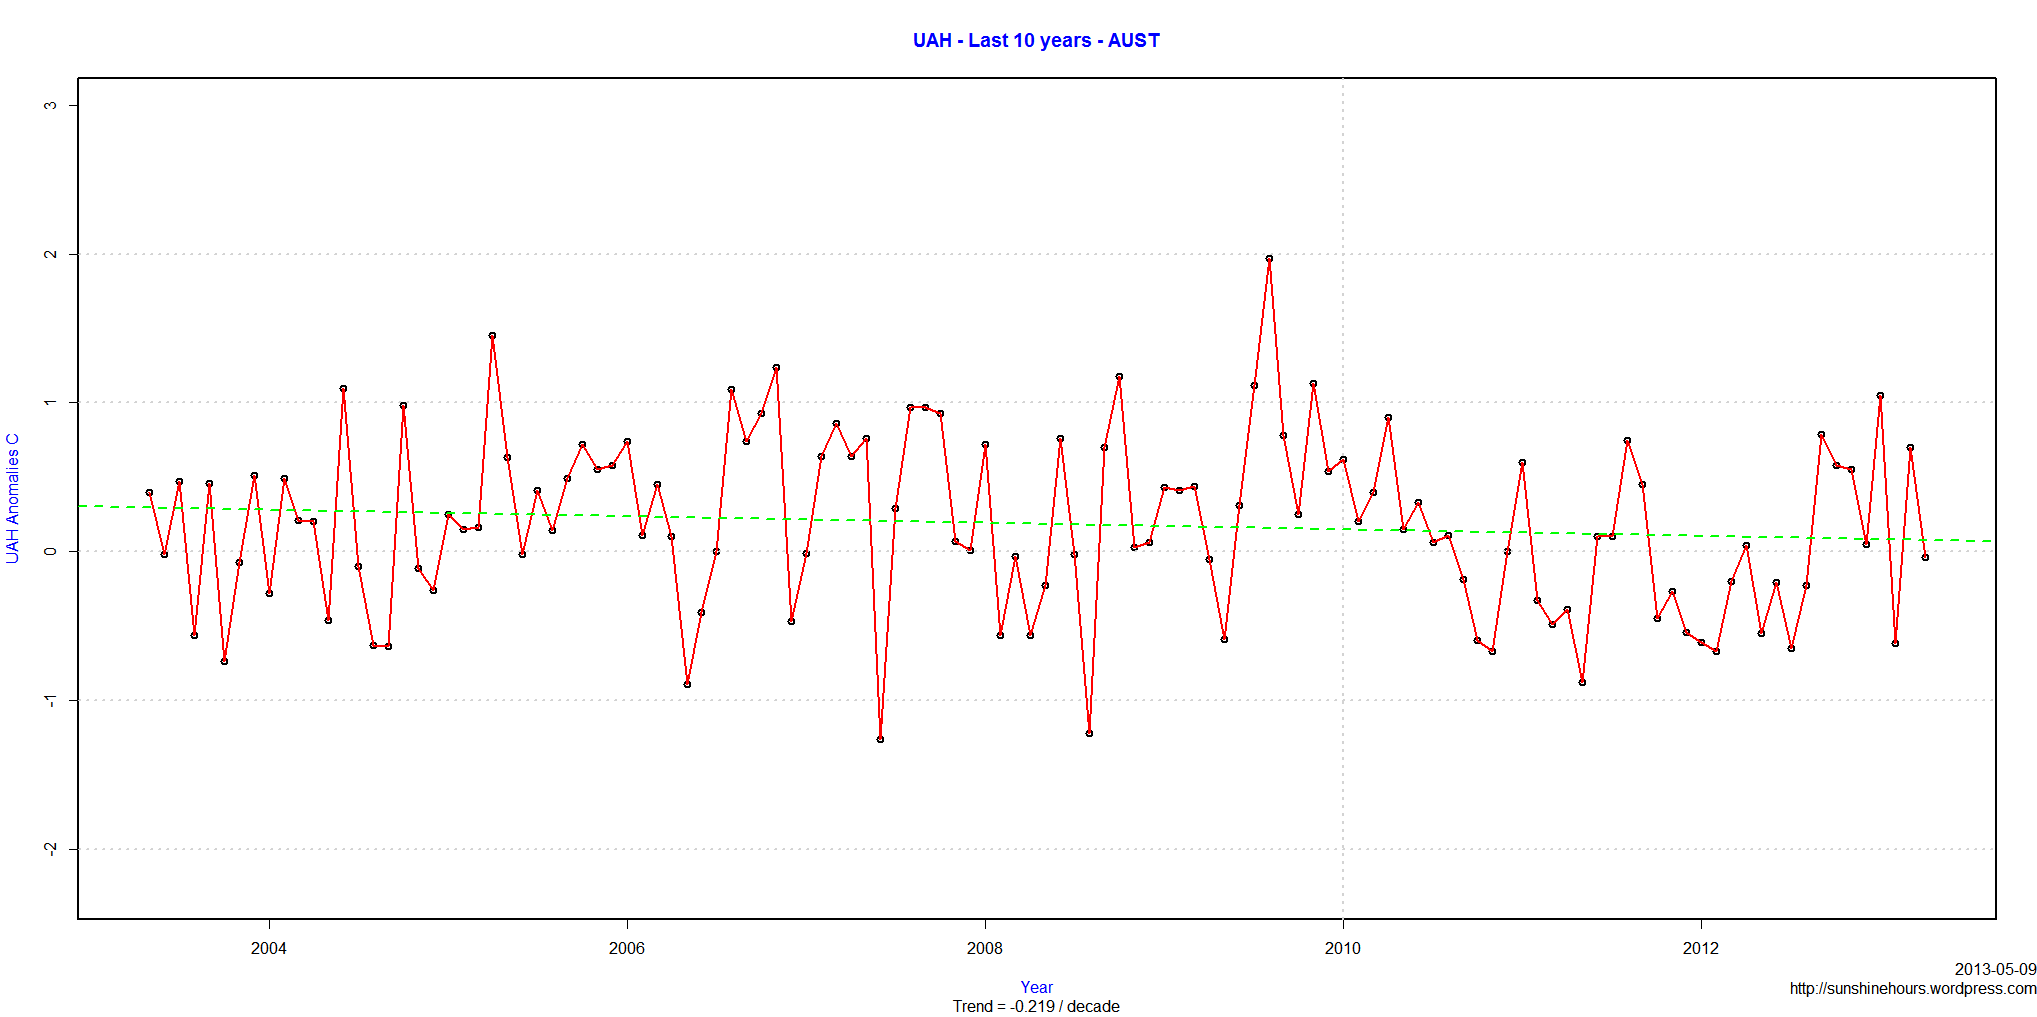
Last month UAH added AUST to its satellite data temperature set. AUST is Australia.
According to UAH, Australia is cooling at -.927C per decade over the last 5 years and cooling at -.291C per decade over the last 10 years.
UAH for April 2013 is out.
5th coldest April in USA49 history (which is USA 48 + Alaska)
| year | Mo | USA49 |
| 1983 | 4 | -2.68 |
| 1982 | 4 | -1.61 |
| 1984 | 4 | -1.6 |
| 1997 | 4 | -1.5 |
| 2013 | 4 | -0.93 |
| 1998 | 4 | -0.62 |
| 1995 | 4 | -0.61 |
| 1979 | 4 | -0.6 |
| 1993 | 4 | -0.58 |
| 1980 | 4 | -0.56 |
| 1996 | 4 | -0.53 |
| 1985 | 4 | -0.22 |
| 1986 | 4 | -0.16 |
| 2008 | 4 | -0.15 |
| 2009 | 4 | -0.11 |
| 2011 | 4 | -0.1 |
| 1988 | 4 | -0.01 |
| 1999 | 4 | 0.14 |
| 1991 | 4 | 0.21 |
| 2007 | 4 | 0.25 |
| 1992 | 4 | 0.31 |
| 2005 | 4 | 0.44 |
| 2004 | 4 | 0.47 |
| 2003 | 4 | 0.48 |
| 1994 | 4 | 0.5 |
| 2000 | 4 | 0.51 |
| 2001 | 4 | 0.53 |
| 1987 | 4 | 0.57 |
| 2010 | 4 | 0.66 |
| 1989 | 4 | 0.74 |
| 2002 | 4 | 0.82 |
| 1990 | 4 | 0.92 |
| 2006 | 4 | 1.33 |
| 2012 | 4 | 1.48 |
| 1981 | 4 | 1.51 |
2nd UPDATE: UAH is out. My post here.I knew if I complained it would all show up. 🙂
UPDATE: HADCRUT4 for March 2013 is out. My post is here.
Anyone know where the UAH and HADCRUT data is?
While some of the UAH data arrived a few days ago, the downloadable file is still missing April’s data. March’s data arrived April 2.
HADCRUT is usually available by the 28th of the following month. February’s data came out March 28. It is now 10 days late.
Are they having a conference? March and April too cold to explain?
RSS is out. HADCET is out. NCDC is due soon, but not overdue.
UAH for March 2013 is out.
According to WUWT there are two new products added:
“The two new products are a USA49, which includes Alaska with the lower 48, and a listing for Australia, which includes Tasmania. Both of these new products will include temperature anomaly and trend data going back to the beginning of the UAH dataset in December 1978.”
3rd Coldest March in USA49 history! (Since 1979 anyway)
10 coldest March’s USA49 ranked coldest to 10th coldest
| Year | Mo | USA49 |
| 1980 | 3 | -1.37 |
| 1981 | 3 | -0.93 |
| 2013 | 3 | -0.87 |
| 1984 | 3 | -0.82 |
| 2001 | 3 | -0.8 |
| 1988 | 3 | -0.75 |
| 1983 | 3 | -0.73 |
| 2002 | 3 | -0.73 |
| 2008 | 3 | -0.71 |
| 1996 | 3 | -0.63 |
USA48 has March 2013 as the 6th coldest
| year | Mo | USA48 |
| 1981 | 3 | -1.55 |
| 1980 | 3 | -1.49 |
| 1984 | 3 | -1.31 |
| 1996 | 3 | -1.24 |
| 2002 | 3 | -1.2 |
| 2013 | 3 | -1.00 |
| 1983 | 3 | -0.91 |
| 2001 | 3 | -0.85 |
| 2005 | 3 | -0.81 |
| 1988 | 3 | -0.71 |
UAH Global Temperature Update for August, 2012 came out at : +0.34 deg. C above the 1981-2010 average.
USA48 trend is cooling at -0.059C / decade.