Nanaimo ‘Extreme’ Weather

I thought I would look at the year in which daily records for Nanaimo BC (near where I live).

The data starts in 1947 and goes to 2016. You can get data here.

There must be a fingerprint of Extremeness somewhere … right?

I guess not. The early 40s/50s set a  lot of cold records. The high records are all over the place.

Mass Extinction! They blamed warming. It was cooling.

Warming did it. Cooling did it.

“The Earth has known several mass extinctions over the course of its history. One of the most important happened at the Permian-Triassic boundary 250 million years ago. Over 95% of marine species disappeared and, up until now, scientists have linked this extinction to a significant rise in Earth temperatures. But researchers have now discovered that this extinction took place during a short ice age which preceded the global climate warming.”


Scientists Lie … and They Admit It

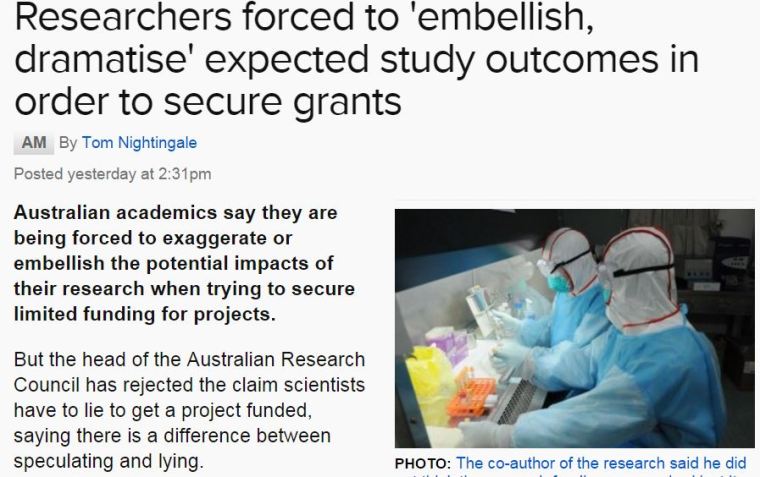
“Australian academics say they are being forced to exaggerate or embellish the potential impacts of their research when trying to secure limited funding for projects.

Key points:

  • Study based on 50 interviews of unnamed academics in Australia and UK
  • Australian academics said they struggled to be “fully frank and honest”
  • Australian Research Council funds more than $700 million worth of projects each year
  • The council rejects claims scientists have to lie to get funding

But the head of the Australian Research Council has rejected the claim scientists have to lie to get a project funded, saying there is a difference between speculating and lying.

The revelations are included in a study of a relatively new system where academics forecast the impact of their research when applying for funding.

The study is based on 50 interviews of unnamed academics in Australia and Britain.

The 25 Australian academics said it was difficult to give an accurate answer when a grant application asked them to predict the impact of their project.

“It’s virtually impossible to write one of these grants and be fully frank and honest in what it is you’re writing about,” one unnamed academic said.

“I don’t know what you’re supposed to say. Something like, ‘I’m Columbus, I’m going to discover the West Indies’,” a second unnamed academic said.

The proposals are reviewed by experts who do have a really good and sharp sense of what’s plausible and what’s implausible, and what’s fictitious and what’s not.

Professor Aidan Byrne, Australian Research Council

It’s really virtually impossible to write an Australian Research Council grant without lying, and this is the kind of issue they should be looking at,” a third unnamed academic said.”


http://www.abc.net.au/news/2016-03-11/academics-dramatise-expected-study-outcomes-for-funding-study/7238694

Screenshot.

Capture


10 MORE Random Canadian Tmax from 1980

A few days I published 10 more randomly chosen graphs of TMAX using Environment Canada’s monthly summaries.

I was fiddling with the graphing code to add the overall rate of temp change and color the title – red for warming and blue for cooling.

I took a closer look at 3 stations (2 are airports).

Tmax temperatures falling at -.414C /dec, -.224/dec and -.246/dec

April Tmax in Brandon have fallen 7C in 35 years.

Tx - SWIFT CURRENT CDA SK . 1980 to 2015 . -0.414 C per decade

Tx - FORT MCMURRAY A AB . 1980 to 2015 . -0.224 C per decade

Tx - BRANDON A MB . 1980 to 2015 . -0.246 C per decade


10 MORE Random Canadian Tmax from 1980

A few days I published 10 randomly chosen graphs of TMAX using Environment Canada’s monthly summaries.

I picked 1980 to 2015 partly to create a round number and partly because that is sort of when AGW became noticeable.

I picked TMAX because I think TMIN’s are rising because of UHI.

The red lines indicate a warming trend. The blue a cooling trend.

Anyone see evidence of CO2 making it warm?

Here are 10 more.

Tx - BONILLA ISLAND BC - 1980 to 2015

Tx - CASTLEGAR A BC - 1980 to 2015

Tx - BRANDON A MB - 1980 to 2015

Tx - GOLDEN A BC - 1980 to 2015

Tx - KANANASKIS POCATERRA AB - 1980 to 2015

Tx - MICA DAM BC - 1980 to 2015

Tx - SWIFT CURRENT CDA SK - 1980 to 2015

Tx - FORT MCMURRAY A AB - 1980 to 2015

Tx - VANCOUVER HARBOUR CS BC - 1980 to 2015

Tx - BONILLA ISLAND BC

10 Random Canadian Tmax from 1980

Every once in a while I visit the data for the Canada. Earlier today I looked at the station nearest me (NANAIMO A).

But since I have the code … I thought why not look at 10 random stations that have data in 1980 and 2015.

Today I am looking at TMAX monthly data (using Environment Canada monthly summaries) for 10 random stations from 1980.

Each line of graphs is a season  – Dec/Jan/Feb …. etc.


Tx Average BEAUCEVILLE QC


Tx Average NEW GLASGOW ON


Tx Average TERRACE A BC


Tx Average WHITECOURT A AB


Tx Average AROOSTOOK NB


Tx Average BARWICK ON


Tx Average MIDLAND WATER POLLUTION CONTROL PLANT ON


Tx Average QUALICUM R FISH RESEARCH BC


Tx Average UCLUELET KENNEDY CAMP BC


Tx Average GIBSONS GOWER POINT BC


Nanaimo Tmax from 1980

Every once in a while I visit the data for the weather station closest to my hometown on the west coast of Canada.

Today I am looking at TMAX monthly data (using Environment Canada monthly summaries) for NANAIMO A from 1980.

Each line of graphs is a season  – Dec/Jan/Feb …. etc.

5 months are warming. 4 are cooling. 3 are cooling ever so slightly.

If there is a CO2 signal in there I am missing it.

Tx Average NANAIMO A


Nanaimo BC Temperature Range

I live near Nanaimo BC (data from 1947 at “NANAIMO A”). I was curious what the temperature range for any given day would be.

By temperature range I mean find the warmest it has ever been for a particular day and then subtract the coldest it has ever been.

December 1st , February 4th, November 14th and May 16 have the biggest range = 32.8C.

November 18th has the lowest range = 16.9C. (I find it interesting it has never been colder than -4.4C on November 18 when it has been -16.1C on November 14th.

(Remember this when someone says humans and animals will notice a 1C change in the next 100 years).

Top 10 and bottom 10 below.

Biggest Difference:

Month Day Min Max Difference
12 1 -18.9 13.9 32.8
2 4 -16.7 16.1 32.8
11 14 -16.1 16.7 32.8
5 16 -4.4 28.4 32.8
6 17 0.6 33.3 32.7
5 29 1.7 34.3 32.6
5 12 0 32.4 32.4
5 28 0.6 33 32.4
5 14 -0.6 31.7 32.3
12 24 -13.9 18.2 32.1

Lowest Difference:

Month Day Min Max Diffference
11 18 -4.1 12.8 16.9
3 15 -3.3 14.5 17.8
12 5 -7.1 12.1 19.2
11 10 -4.4 14.9 19.3
12 11 -6.1 13.5 19.6
12 3 -5.9 14 19.9
12 12 -6.3 13.9 20.2
2 23 -5.6 14.6 20.2
3 14 -3.9 16.6 20.5
3 17 -5 15.7 20.7

Nanaimo Tmax from 1947 to 2015

Every once in a while I visit the data for the weather station closest to my hometown on the west coast of Canada.

Today I am looking at daily TMAX data  from Nanaimo Airport (1947 – 2015).

1987 was the warmest year (1958 was 2nd warmest FYI) . 1955 was the coldest They are shown as the orange and blue lines.

Here I have graphed all the available data in the style I usually use for Sea Ice data.

2015 is in red. There are gaps because Environment Canada doesn’t seem to care.

Notice that temps can fluctuate by 20C for the same day in different years.

Ponder this … why can we humans (and crops and animals)  adapt to 20C swings but we can’t adapt to a 1C change over 100 years?

Click graph for larger.

NANAIMO_MAXTEMP_Antarctic_Style

Update: I added Tmin
NANAIMO_MINTEMP_Antarctic_Style

Nanaimo Tmax from 1913 to 2014 Using Two Overlapping Stations

Every once in a while I visit the data for the weather station closest to my hometown on the west coast of Canada.

Today I am looking at daily data (using KNMI) from Departure Bay (1913 – 1992) and Nanaimo Airport (1947 – 2014).

I’ve summarized the data by monthly mean.

The data does overlap. The first graph is just Tmax. The second graph is Tmax anomaly from the overlap period of 1948 to 1992

Nanaimo TMax - Data From KNMI - Departure Bay and Airport

Nanaimo TMax - Data From KNMI - Departure Bay and Airport - Anomaly From Overlapping 1948-1992