Arctic Sea Ice Extent Sept 10 2014 – -1,062,000 sq km below the 1981-2010 mean. Data for Day 252. Data here.
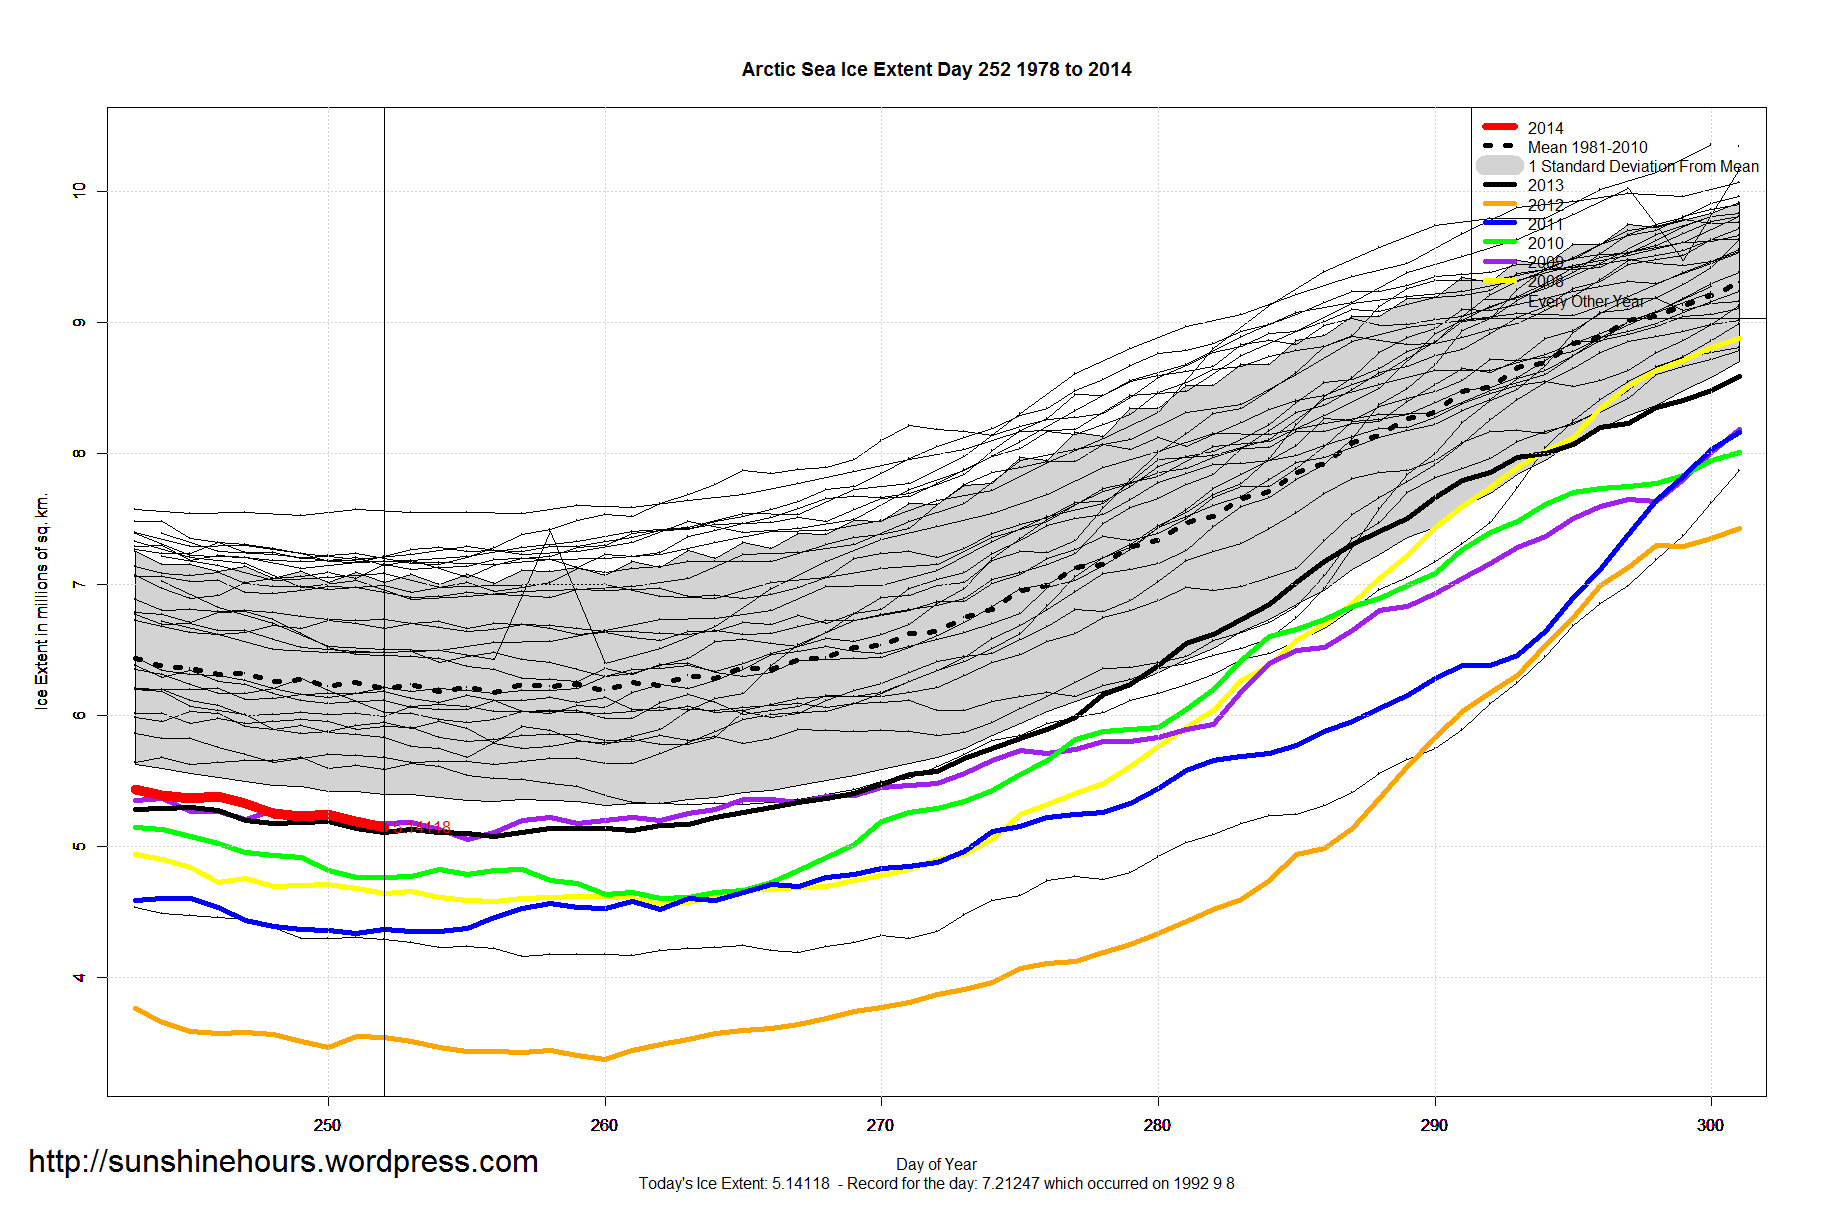

Arctic Sea Ice Extent Sept 10 2014 – -1,062,000 sq km below the 1981-2010 mean. Data for Day 252. Data here.
Arctic Sea Ice Extent Sep 09 2014 – -1,063,000 sq km below the 1981-2010 mean. Data for Day 251. Data here.


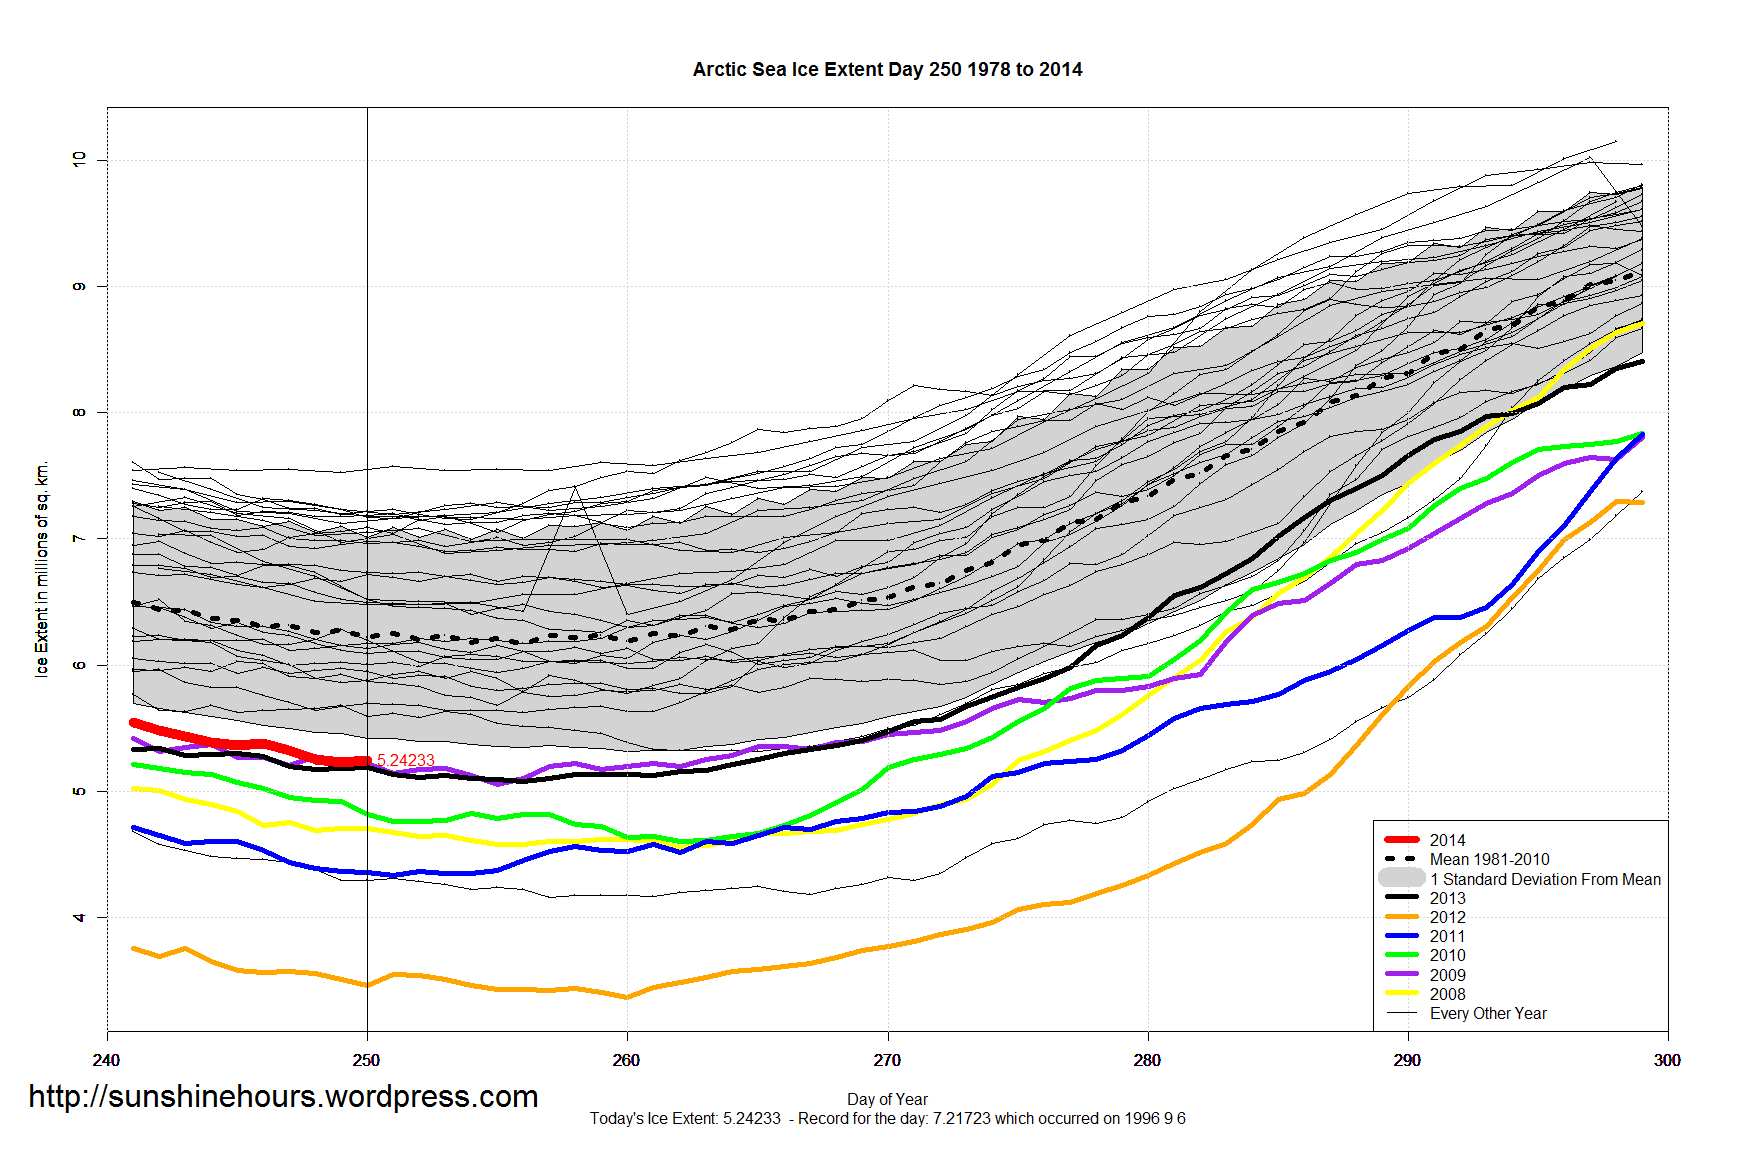
Arctic Sea Ice Extent Sep 08 2014 – -976,000 sq km below the 1981-2010 mean. Data for Day 250. Data here.

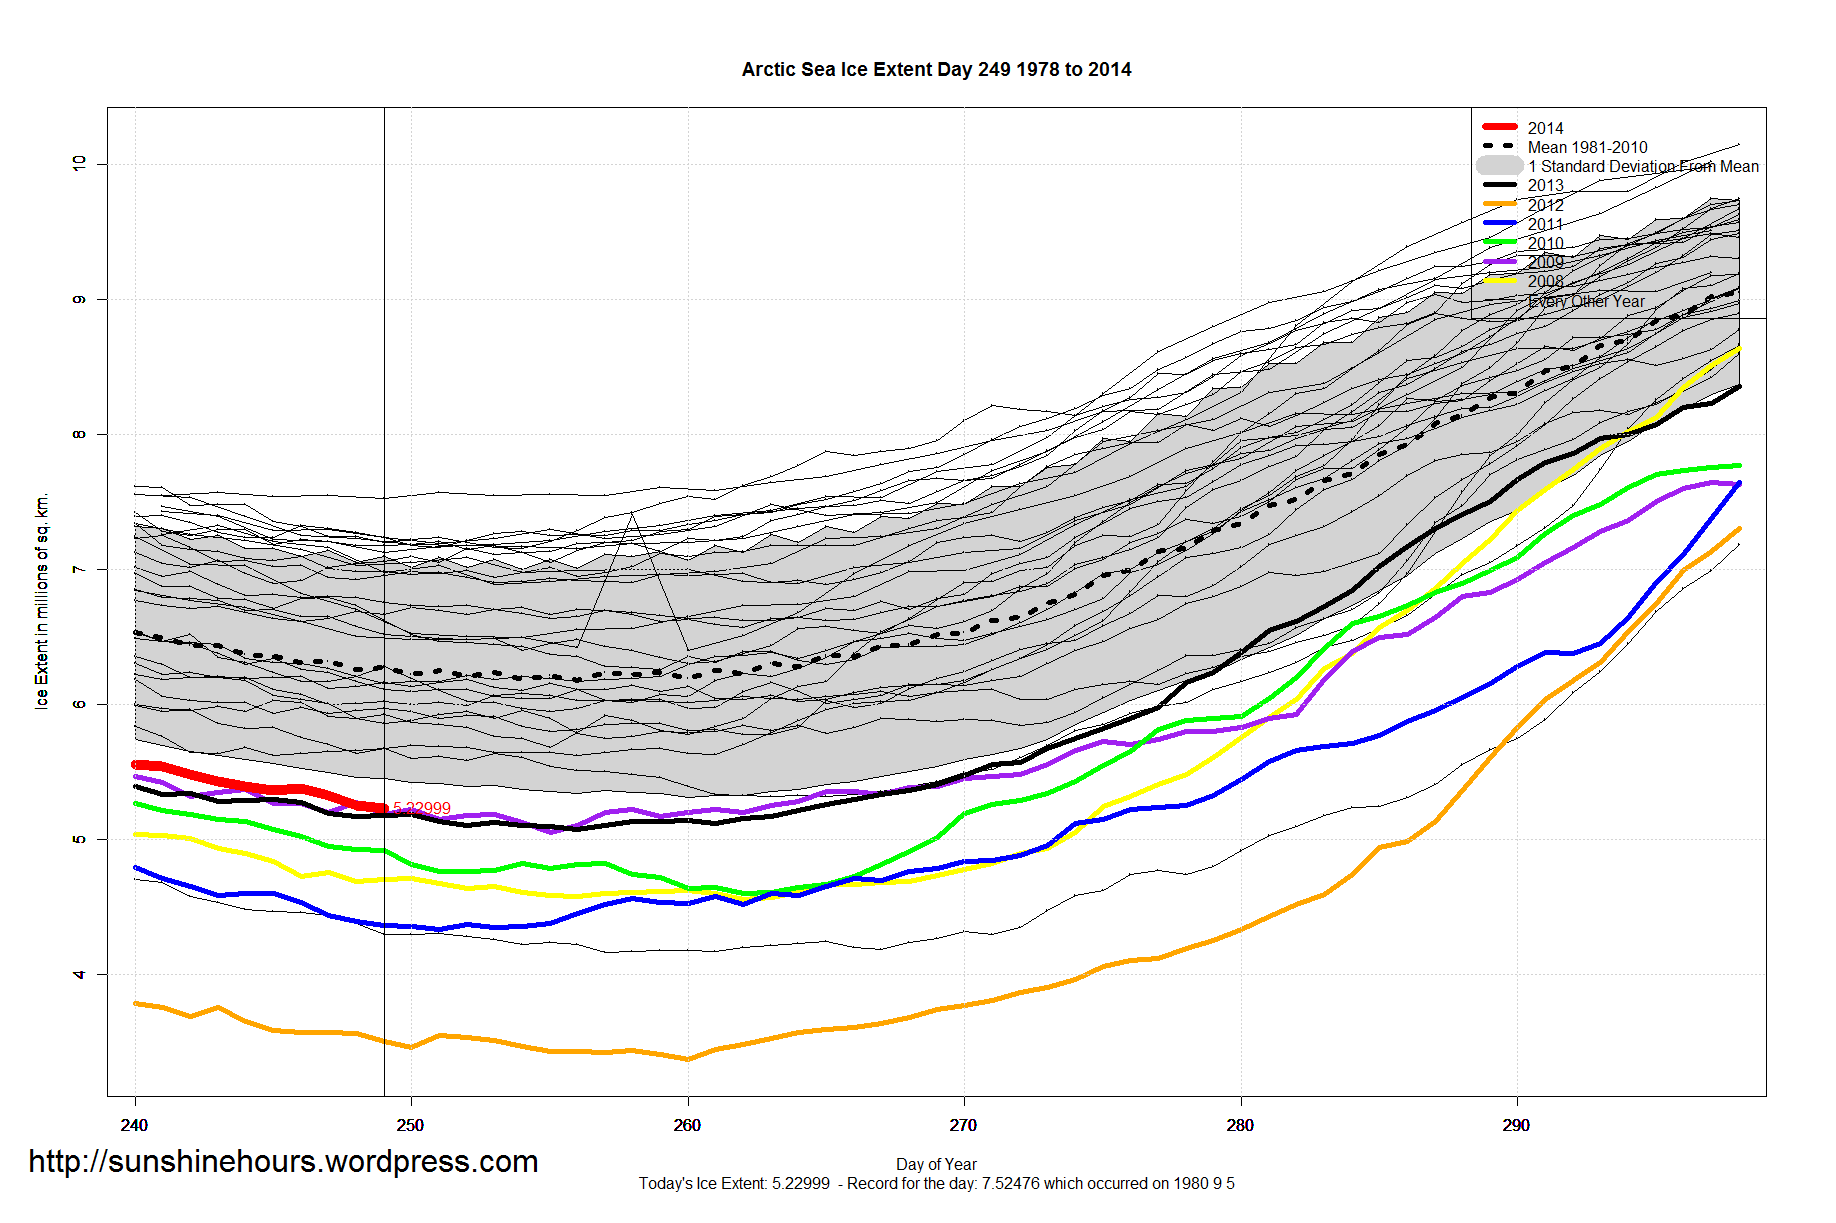
Arctic Sea Ice Extent Sep 07 2014 – -1,045,000 sq km below the 1981-2010 mean. Data for Day 249. Data here.

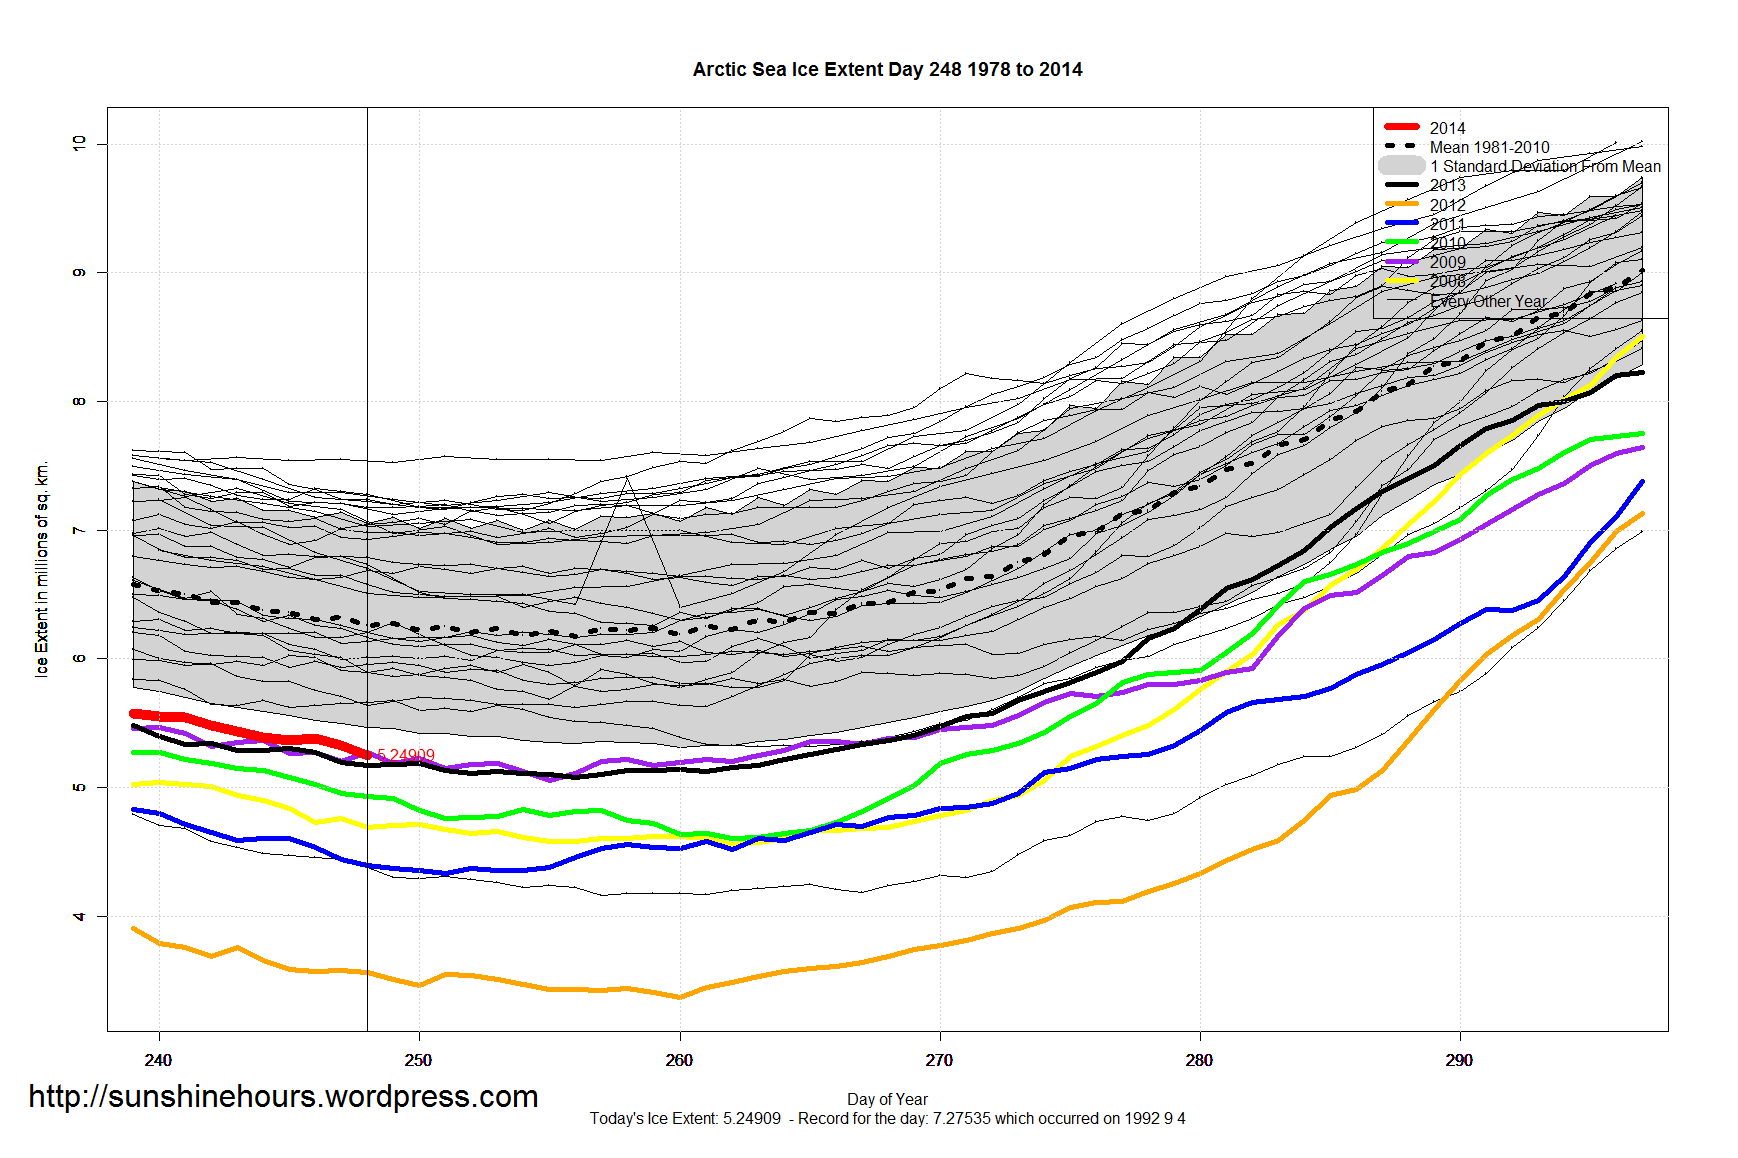
Arctic Sea Ice Extent Sep 06 2014 – -1,007,000 sq km below the 1981-2010 mean. Data for Day 248. Data here.

Arctic Sea Ice Extent Sep 05 2014 – -991,000 sq km below the 1981-2010 mean. Data for Day 247. Data here.


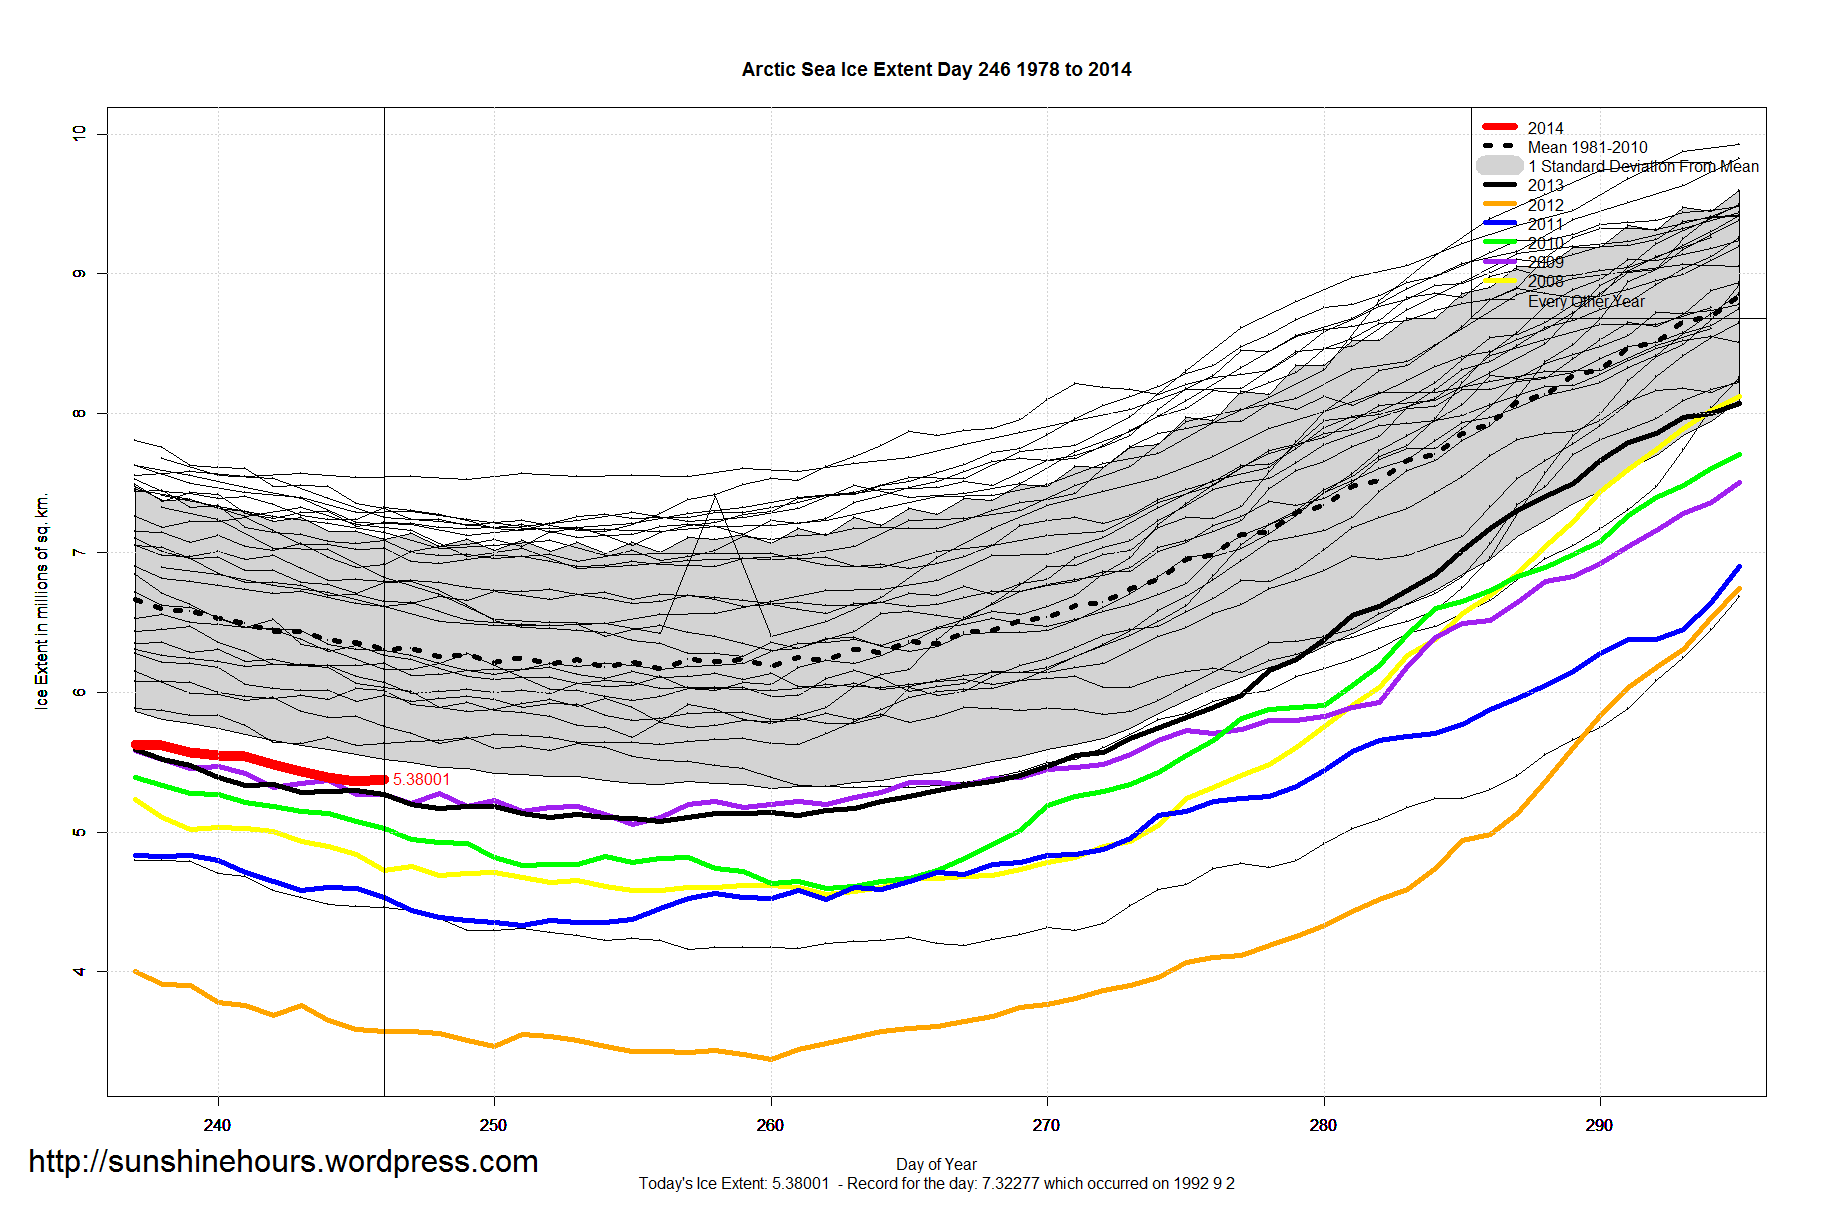
Arctic Sea Ice Extent Sep 04 2014 – -929,000 sq km below the 1981-2010 mean. Data for Day 246. Data here.

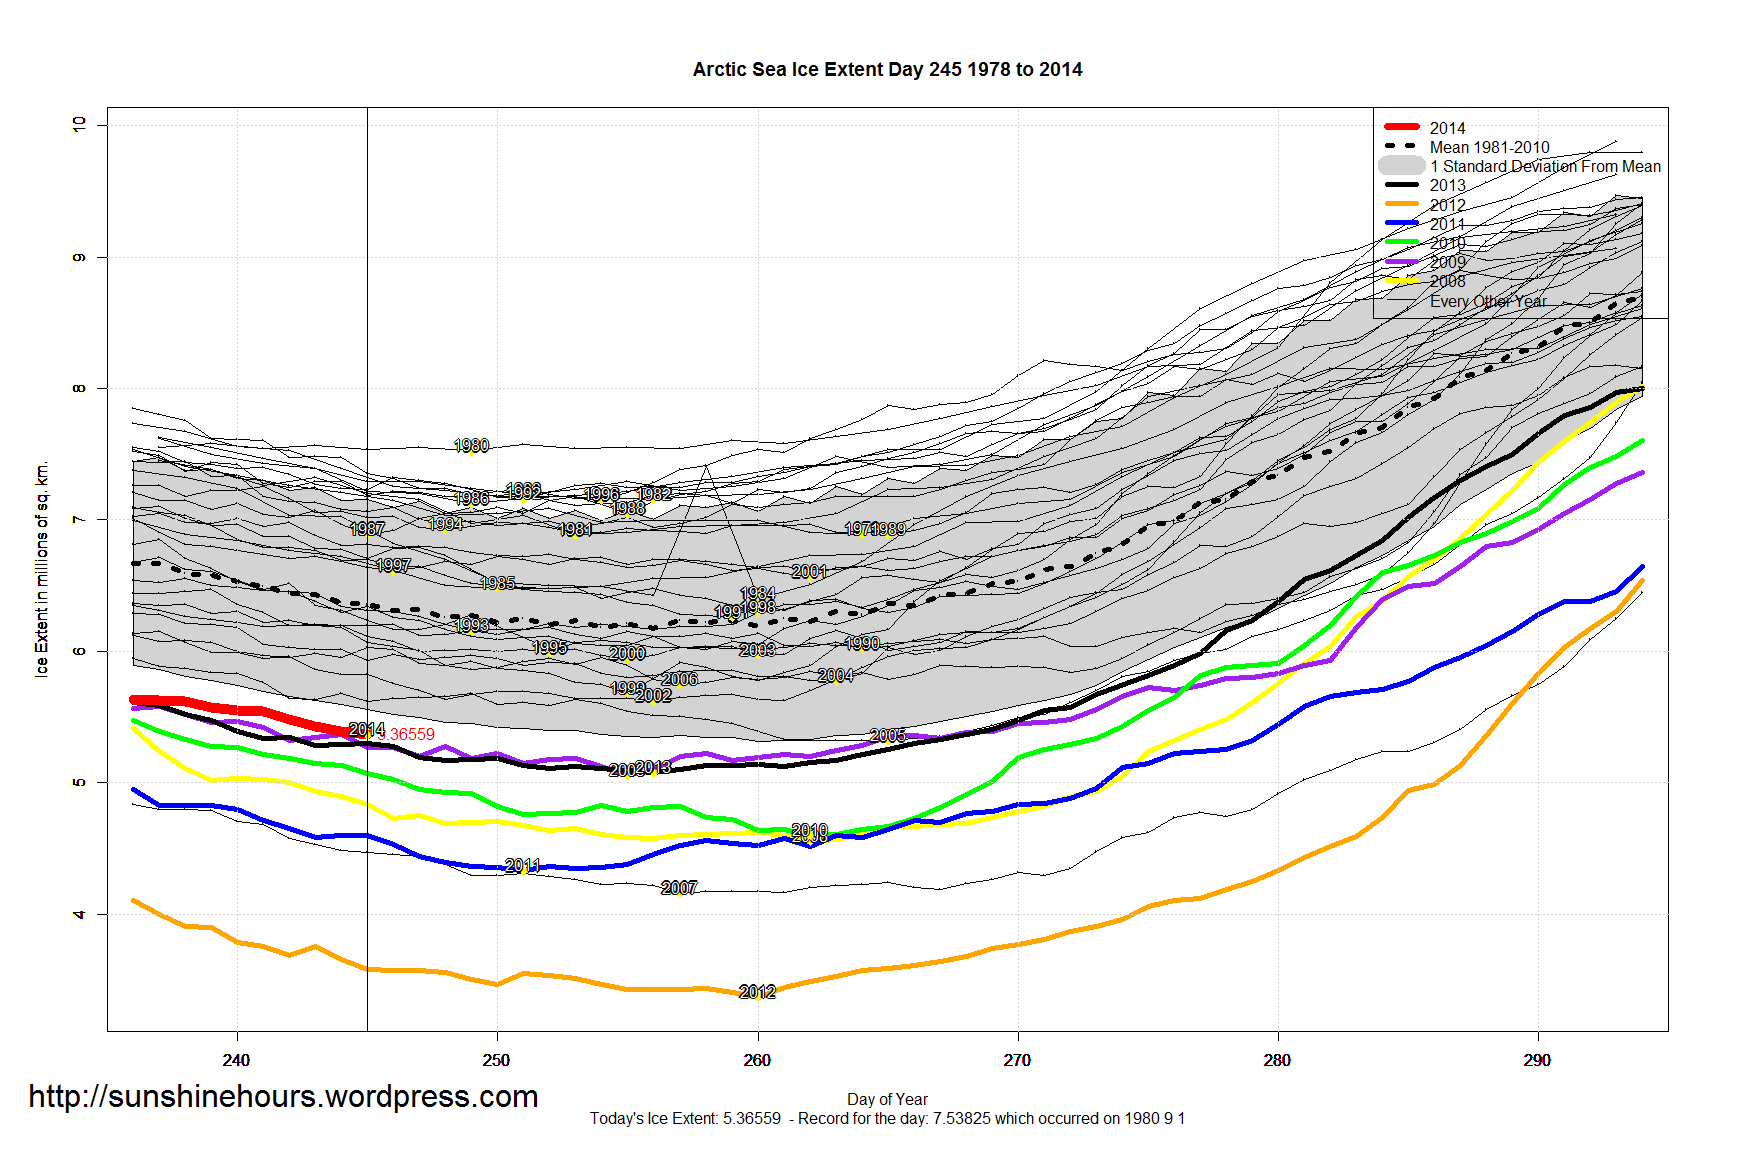
Arctic Sea Ice Extent Sep 03 2014 – -992,000 sq km below the 1981-2010 mean. Data for Day 245. Data here.
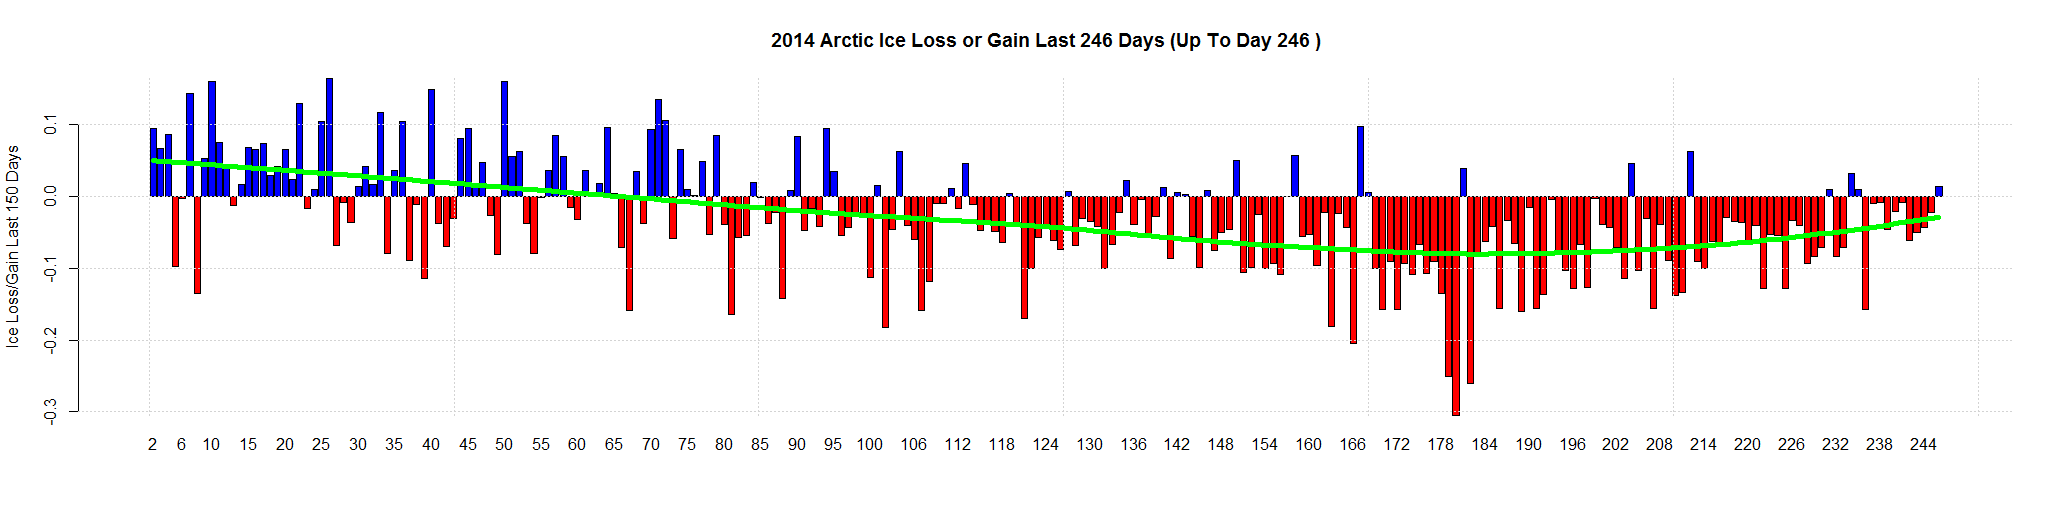
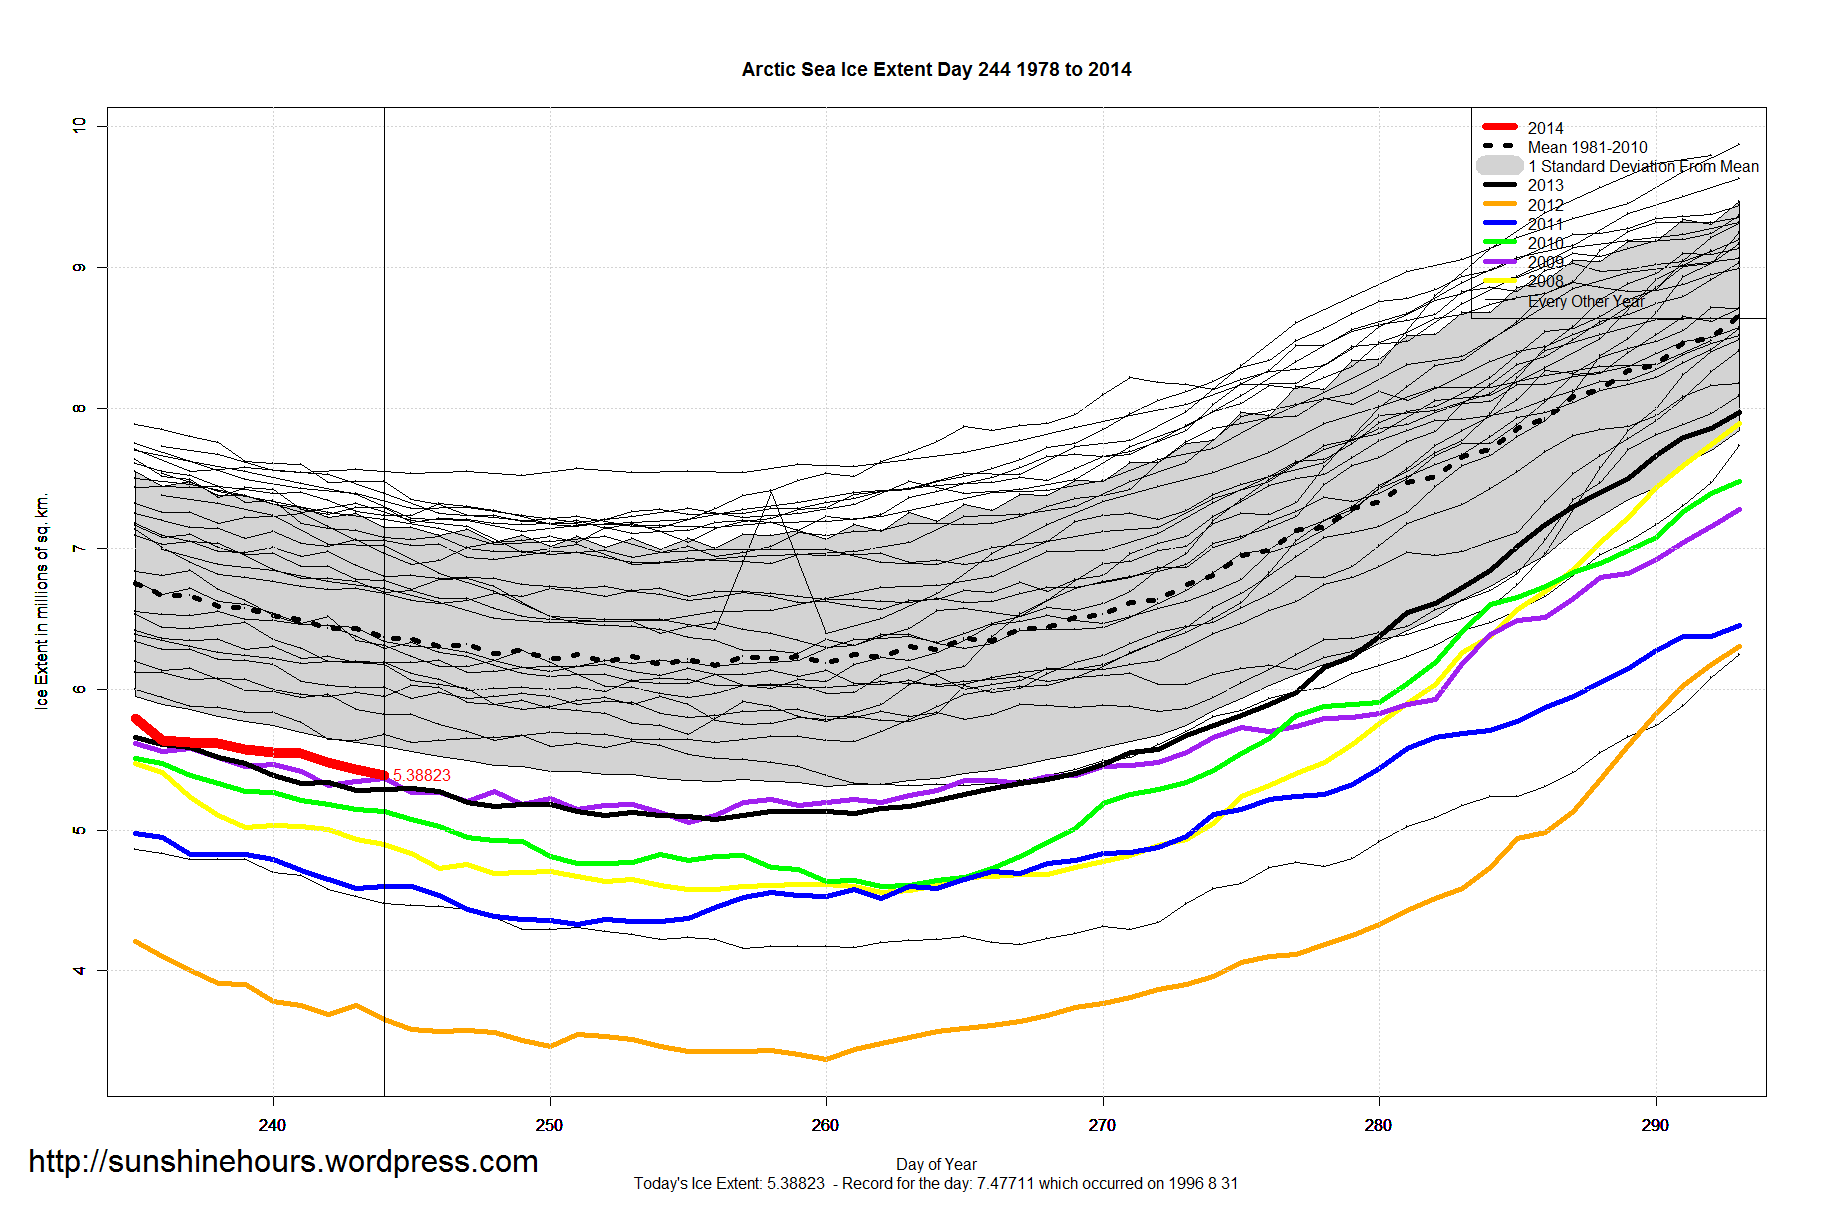
Click on the graph for full size to make the minimums easier to read. 2014 is on there, but I suspect it will change.

Arctic Sea Ice Extent Sep 02 2014 – -985,000 sq km below the 1981-2010 mean. Data for Day 244. Data here.

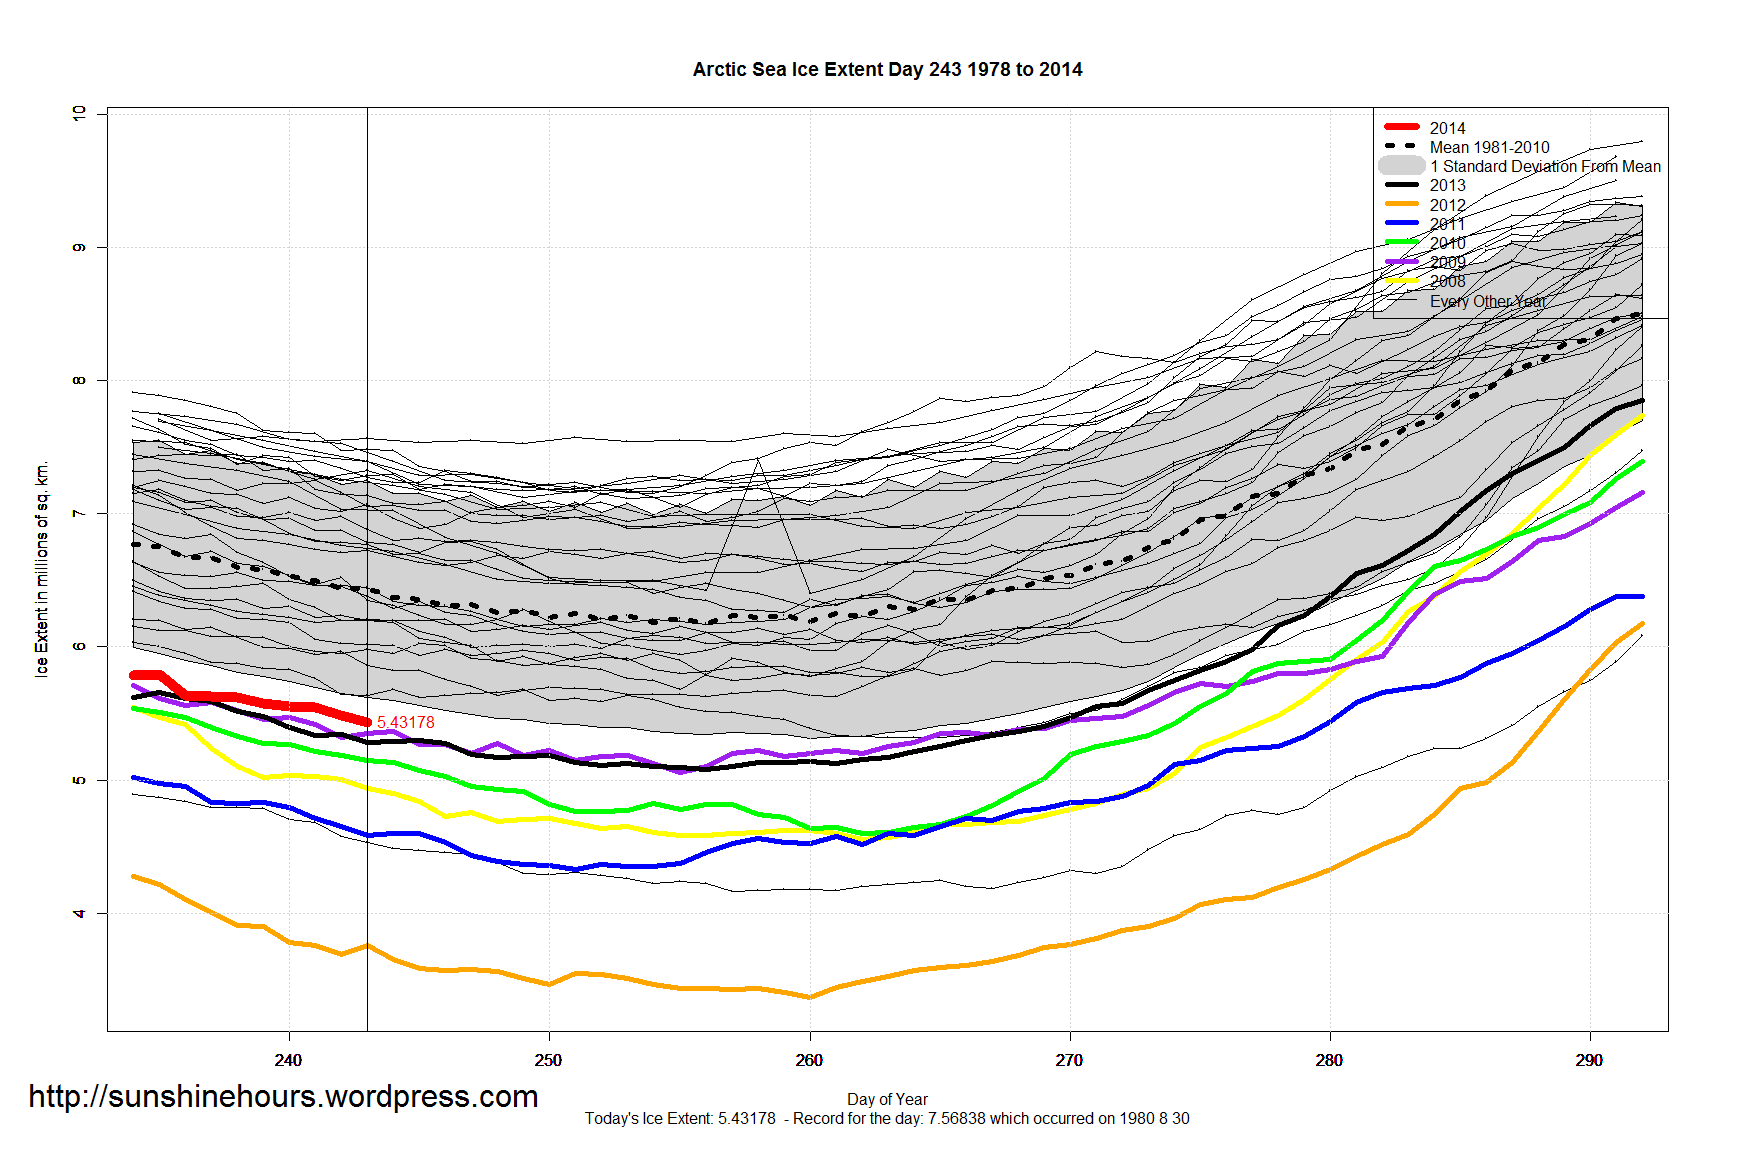
Arctic Sea Ice Extent Sep 01 2014 – -1,005,000 sq km below the 1981-2010 mean. Data for Day 243. Data here.
1.7 million sq km higher than 2012 for the same day. 1 million higher than 2011. 1 million higher than 2007 … etc etc