WILL CLIMATE HYSTERIA UNRAVEL CANADA?

From GWPF

Every so often the Pentagon comes up with a thumbsucker about how climate change is going to alter the geopolitical landscape. The intriguing Norwegian TV show “Okkupert” (“Occupied”) might be a better guide to understanding how such instability could already be brewing on our own northern border.

Americans might be forgiven for not knowing that Norway, with a population of five million, is the world’s 11th largest oil exporter and the third largest exporter of natural gas. They might also need a second or two to realize that this sounds a lot like the Canadian province of Alberta, with four million people and fossil energy reserves second only to Saudi Arabia’s and Venezuela’s.

In the show, which is available on Netflix , Norway’s Greens come to power and announce plans to end fossil energy production. Norway’s European Union neighbors, while keen to seem green, are not keen to do without Norway’s energy. They quietly support a Russian campaign of intimidation that amounts to a creeping takeover, while Norway’s politicians, eager to avoid outright fighting, straddle and prevaricate. Anyone who remembers the name Vidkun Quisling will appreciate why this theme might resonate with a Norwegian audience.

Now back to Alberta: In the provincial capital of Edmonton, house prices have been falling for three years. Car sales are drying up. One-third of Calgary’s office buildings are empty. Though production is booming, Alberta’s oil was recently selling for barely $10 a barrel—an 80% discount to the world price. Why? Because opposition from neighboring provinces has blocked construction of needed pipelines.

In a drastic effort to prop up prices, Alberta Premier Rachel Notley in December imposed mandatory production cuts on her province’s largest oil producers. She also announced plans, using taxpayer money, to buy 7,000 railcars to get oil to market, never mind that shipping by rail is expensive and risky.

In the middle is Prime Minister Justin Trudeau, dithering between his green supporters and his desire to placate Alberta and keep its money flowing.

He impulsively committed to spend $4.5 billion to rescue a U.S.-backed pipeline whose expansion has been blocked by a Canadian court. At the same time, he has mused that Alberta’s oil-sands production should be phased out in a “generation.” His party is pushing a bill to empower greens to block future pipelines. It supports a U.N. treaty that would increase the veto power of native tribes. It backs a continuing ban on supertankers in Canadian ports.

Unlike the U.S., where secession was shown to be illegal in the 1860s, a 2000 Canadian law spells out the steps for provinces to declare independence. Ms. Notley has tried to play down secession talk, but the politics are complicated. Fellow Canadians may not be ready to give up their energy-rich lifestyles, or the foreign oil imports that make them possible. But they disapprove of Alberta’s participation in an acrid industry and their voters are willing to pay a price for it.

To the east, Quebec’s premier says Alberta’s “dirty energy” has no “social acceptability.” To the west, British Columbia’s premier was elected on a platform of killing a new pipeline project favored by Alberta.

Meanwhile, protest rallies have become a near-daily occurrence in the oil-rich province. Two truck convoys to Ottawa are planned for February, including one explicitly modeled on the French “yellow vests” movement. Ms. Notley herself faces an uphill re-election fight in May. She was already wrong-footed once into backing a carbon tax scheme that was supposed to ease the way for more pipelines. Now her opponent is challenging Canada’s highly symbolic “equalization” scheme, which has shifted hundreds of billions from Alberta to Quebec over two decades.

Only a quarter of Albertans say they favor independence, but that may be beside the point. The province’s future promises to be one of barely contained civil war with its fellow Canadians. If $13 billion a year in payola can’t appease Quebec, the cause is probably beyond salvaging. A Donald Trump re-election could invite talk of becoming the 51st U.S. state. If Obama-like pipeline opponents are returned to power in Washington in 2020, the squeeze will be even worse.

Then what? A weak state with enormous fossil energy resources caught in the West’s culture wars over climate and energy? The cash cow of Canada up for grabs? We could spin lots of scenarios.

Alberta Tmin/Tmax Monthly Summaries For Stations with 25 years of data.

Environment Canada Monthly Summary Grid For Months (1,2,3,4,5,6,7,8,9,10,11,12) by Decade

Red is Highest , Blue is Lowest

I posted the other about how Alberta isn’t suffering from a heat wave even if the average has gone up.

The average has gone up because the Tmin is higher, not Tmax (Generally)

So these are the stations with 25 years of data ending in 2015/2106/2017.

Notice that most stations Tmin are hottest in the 2010s and coldest in the 1970s (if there is 70s data)

Tmin


Station Station No Records Min Year Max Year pct of data 2010s 2000s 1990s 1980s 1970s 1960s 1950s 1940s 1930s 1920s 1910s 1900s 1890s 1880s
KANANASKIS 3053600 928 1939 2017 97.9 -13.64 -14.43 -14.18 -14.45 -14.53 -15.01 -15.47 -14.06 -10.56
CAMROSE 3011240 836 1946 2017 96.8 -13.1 -13.9 -13.84 -12.53 -14.47 -14.09 -14.87 -15.3
COLD LAKE A 3081680 781 1952 2017 98.6 -12.6 -13.38 -14.42 -14.2 -15.02 -15.1 -14.9
FORT SASKATCHEWAN 3012710 686 1958 2017 95.3 -13.28 -14.05 -13.39 -13.93 -14.12 -13.42 -10.66
EDMONTON STONY PLAIN 301222F 623 1966 2017 99.8 -10.33 -10.74 -11.02 -11.12 -12.14 -11.41
QUEENSTOWN 3035340 612 1966 2017 98.1 -11.99 -10.91 -11.86 -11.19 -12.11 -11.92
CRAIGMYLE 3021940 604 1960 2017 86.8 -13.65 -13.63 -13.6 -10.71 -14.55 -13.52
FORESTBURG PLANT SITE 3012652 586 1967 2017 95.8 -10.82 -10.74 -11.33 -10.95 -13.22 -9.64
HIGH LEVEL A 3073146 567 1970 2017 98.4 -17.04 -17.59 -18.19 -18.73 -19.38
SIMONETTE 3075937 520 1973 2017 96.3 -12.02 -14.68 -12.97 -13.26 -14.65
KANANASKIS POCATERRA 3053604 448 1976 2017 88.9 -14.27 -16.83 -16.33 -17.15 -18.45
VEGREVILLE 3016GF0 446 1980 2017 97.8 -14.25 -14.9 -15.12 -14.58
FABYAN 3012515 431 1981 2017 97.1 -13.91 -13.86 -14.86 -14.38
LLOYDMINSTER A 3013961 429 1982 2017 99.3 -12.22 -13.09 -13.93 -13.18
ELK ISLAND NAT PARK 3012275 383 1981 2017 86.3 -12.52 -13.62 -12.76 -13.62
BRULE BLACK CAT 3060903 367 1987 2017 98.7 -13.34 -14.65 -15.36 -14.27
UNIVERSITY OF ALBERTA METABOLIC CENTRE 301FFNJ 365 1986 2017 95.1 -10.57 -12.85 -12.32 -11.63
ENTWISTLE 3062451 362 1987 2017 97.3 -12.23 -13.14 -12.83 -13.94
OKOTOKS 303M9JM 332 1990 2017 98.8 -11.41 -11.86 -11.81
PICTURE BUTTE WEST 303N1G3 331 1987 2017 89 -7.45 -8.7 -10.88 -11.29
BROOKS 3030QLP 311 1988 2017 86.4 -12.41 -12.18 -11.98 -14.86
LETHBRIDGE CDA 3033890 1234 1908 2016 94.3 -11.15 -10.56 -10.63 -11.42 -12.69 -12.24 -12.92 -12.19 -12.78 -13.66 -13.95 -13.82
CALMAR 3011120 1108 1915 2016 90.5 -4.94 -13.32 -14.55 -13.32 -14.94 -14.79 -15.02 -15.89 -16.57 -17.32 -19.21
DAKOTA WEST 3011953 491 1974 2016 95.2 -13.99 -13.37 -14.02 -13.71 -15.09
CAMROSE 2 3011241 327 1985 2016 85.2 -13.65 -13.97 -14.51 -12.59
SEDGEWICK TOWN 3015808 324 1987 2016 90 -10.41 -13.94 -13.49 -16.03
OLDS 3024920 1171 1914 2015 95.7 -11.53 -11.22 -12 -12.22 -13.41 -13.16 -13.56 -12.94 -13.59 -14.68 -15.29
EDMONTON WOODBEND 3012230 501 1973 2015 97.1 -13.76 -13.82 -14.28 -14.02 -15.52


Notice Tmax red is scattered all over. If anything, the 2010s have a lot of lowest Tmax in blue.

Tmax

Station Station No Records Min Year Max Year pct of data 2010s 2000s 1990s 1980s 1970s 1960s 1950s 1940s 1930s 1920s 1910s 1900s 1890s 1880s
KANANASKIS 3053600 934 1939 2017 98.5 19.98 20.06 19.72 19.71 18.94 19.13 18.65 19.79 22
CAMROSE 3011240 836 1946 2017 96.8 19.18 19.63 19.02 19.37 17.89 18.82 18.88 19.99
COLD LAKE A 3081680 781 1952 2017 98.6 18.22 18.31 18.27 18.35 17.37 17.98 17.09
FORT SASKATCHEWAN 3012710 688 1958 2017 95.6 20.1 19.65 19.24 18.4 18.39 19.17 20.41
EDMONTON STONY PLAIN 301222F 623 1966 2017 99.8 19.7 19.65 19.3 19.22 18.32 18.41
QUEENSTOWN 3035340 612 1966 2017 98.1 21.96 22.53 22.25 22.65 21.69 21.16
CRAIGMYLE 3021940 607 1960 2017 87.2 20.65 20.77 20.33 22.84 20.48 21.64
FORESTBURG PLANT SITE 3012652 586 1967 2017 95.8 20.22 21.14 20.43 20.93 19.48 21.75
HIGH LEVEL A 3073146 567 1970 2017 98.4 17.13 16.55 16.46 16.81 16.24
SIMONETTE 3075937 519 1973 2017 96.1 18.43 18.69 19.73 19.79 19
VEGREVILLE 3016GF0 446 1980 2017 97.8 19.45 19 18.69 18.92
KANANASKIS POCATERRA 3053604 442 1976 2017 87.7 15.97 17.52 17.46 17.4 16.76
FABYAN 3012515 431 1981 2017 97.1 18.83 18.75 18.95 19.31
LLOYDMINSTER A 3013961 429 1982 2017 99.3 18.15 18.38 18.24 18.88
ELK ISLAND NAT PARK 3012275 383 1981 2017 86.3 20.13 20.16 20.11 18.64
BRULE BLACK CAT 3060903 367 1987 2017 98.7 19.53 20.39 19.92 21.39
UNIVERSITY OF ALBERTA METABOLIC CENTRE 301FFNJ 365 1986 2017 95.1 19.77 19.86 19.6 19.49
ENTWISTLE 3062451 362 1987 2017 97.3 19.7 19.97 19.86 20.22
OKOTOKS 303M9JM 332 1990 2017 98.8 22.17 22.25 21.81
PICTURE BUTTE WEST 303N1G3 331 1987 2017 89 25.06 24.79 22.75 23.74
BROOKS 3030QLP 311 1988 2017 86.4 22.54 22.86 22.69 20.92
LETHBRIDGE CDA 3033890 1234 1908 2016 94.3 22.91 23.8 22.93 23.58 22.17 22.88 21.98 22.79 23.18 22.25 22.77 23.92
CALMAR 3011120 1104 1915 2016 90.2 13.22 19.41 19.15 19.62 18.69 19.47 18.94 20.3 20.93 20.14 18.86
DAKOTA WEST 3011953 491 1974 2016 95.2 18.85 19.52 19.6 19.89 19.75
CAMROSE 2 3011241 326 1985 2016 84.9 18.07 19.53 19.29 20
SEDGEWICK TOWN 3015808 324 1987 2016 90 20.28 19.3 20.36 19.12
OLDS 3024920 1170 1914 2015 95.6 19.02 20.27 20 20.62 19.32 20.24 20.1 20.9 21.29 19.64 20.49
EDMONTON WOODBEND 3012230 501 1973 2015 97.1 19.8 20.26 20.02 20.64 19.01

Alberta Average July Tmax By Decade

I posted some data about temperatures in Edmonton and Alberta. I wanted to visualize it. So I’ve made a grid.

The source of the data is Environment Canadas monthly summaries.

I’m using Tmax, not Tmean. (The logic being that max temps are the problem)

And I’m starting with the July only average for the decade. (I’ll expand in later posts).

There are 1087 stations with July data in Alberta.

I’m narrowing it down to stations with 25 years of data and data all the way up to 2017 and 80% complate.

Things to note:

Only 29 stations make the cut. Only 1 station has the 2010s as the decade with the hottest July average Tmax.

Only 2 stations have data from the 1940s (none before that).

So … AGW ain’t going to kill Albertans in July. They already survived July in the 2000s.

And there isn’t any stations with old and new data. (By that I mean the 30s).


Station
Station No
Records Min Year Max Year pct of data 2010s 2000s 1990s 1980s 1970s 1960s 1950s 1940s 1930s 1920s 1910s 1900s 1890s 1880s
KANANASKIS 3053600 77 1940 2017 98.7 30.4 31.1 28.3 30.1 29.3 28.8 29.3 29.9
CAMROSE 3011240 70 1946 2017 97.2 29.9 31.6 28.7 30 29.1 31.1 31.2 30.9
COLD LAKE A 3081680 65 1953 2017 100 30.2 31.2 29.8 30 29.3 31.4 30.9
FORT SASKATCHEWAN 3012710 58 1958 2017 96.7 31.4 32 29 30.3 29.9 31.6 33.9
CRAIGMYLE 3021940 52 1960 2017 89.7 31.8 33.5 30.3 32.8 32.6 32.7
EDMONTON STONY PLAIN 301222F 52 1966 2017 100 29.8 30.8 27.8 29.2 28.4 28.6
QUEENSTOWN 3035340 51 1967 2017 100 31.9 33.3 31.4 33.8 34.2 32.2
FORESTBURG PLANT SITE 3012652 50 1968 2017 100 31.7 34 30.9 32.6 31.8 31.7
HIGH LEVEL A 3073146 47 1971 2017 100 30.9 29.9 29.7 29.8 29.2
SIMONETTE 3075937 44 1974 2017 100 28.9 30 29.1 29.3 28.6
VEGREVILLE 3016GF0 37 1981 2017 100 30.7 31.3 29.7 30.3
FABYAN 3012515 36 1981 2017 97.3 29.9 32.2 29.7 31.9
LLOYDMINSTER A 3013961 36 1982 2017 100 29.4 31.6 29.6 31.7
ELK ISLAND NAT PARK 3012275 33 1982 2017 91.7 30.8 31.3 29.9 29.4
BRULE BLACK CAT 3060903 31 1987 2017 100 30.7 31 28.8 29.8
PICTURE BUTTE WEST 303N1G3 31 1987 2017 100 33.6 34.6 31.3 33.2
ENTWISTLE 3062451 30 1988 2017 100 29.9 31.3 29.1 29.8
UNIVERSITY OF ALBERTA METABOLIC CENTRE 301FFNJ 30 1987 2017 96.8 31.8 32.2 29.5 30.8
OKOTOKS 303M9JM 28 1990 2017 100 32.8 33.3 29.9
BROOKS 3030QLP 26 1989 2017 89.7 33.3 35 33.2 34
BOW ISLAND 3030768 25 1993 2017 100 33.7 34.3 31.6
BOW VALLEY 3050778 25 1993 2017 100 32.1 32.2 29.1
COP UPPER 3031875 25 1993 2017 100 31.1 31.3 28.5
CROWSNEST 3051R4R 25 1993 2017 100 31 32 29.1
ESTHER 1 301B460 25 1993 2017 100 32.9 34.8 32.3
LACOMBE CDA 2 3023722 25 1993 2017 100 30.1 31.3 28.4
SUNDRE A 3026KNQ 25 1993 2017 100 30.6 31.1 28.5
THREE HILLS 3026479 25 1993 2017 100 30.7 32.5 29.9
VAUXHALL CDA CS 3036682 25 1993 2017 100 33.6 34.8 32.8

Edmonton (two stations) and then Medicine Hat A

I was looking over Alberta weather data (Environment Canada monthly summaries) because some article said Edmonton was warming by some godawful amount.

When I looked at Edmonton weather data I found 23 stations. Some old, some recent, some only running for a few years.

I looked at EDMONTON CITY CENTRE A  – 1937 to 2005 – average of 11.9 records per year. Pretty complete.

I know, no data from 2010s. But the 1980s were hottest.

1980s 4.3
1990s 3.9
2000s 3.8
1970s 3.4
1960s 3.0
1940s 2.7
1950s 2.6
1930s 2.2

EDMONTON STONY PLAIN 1966 to 2018  – 12

2010s 4.3
2000s 4.1
1980s 3.8
1990s 3.8
1960s 2.7
1970s 2.6

2010s aren’t over.

Then I went looking for some old/new data in Alberta with long runs just to get a feel for the province.

MEDICINE HAT A – 1883 to 2008 11.9 record per year. Again, no 2010s.  Tragic that EC let old long stations die off.

1910s 6.4
1920s 6.2
1980s 6.2
2000s 6.2
1900s 6.0
1990s 5.9
1930s 5.8
1880s 5.3
1940s 5.3
1960s 5.3
1970s 5.0
1950s 4.9
1890s 4.7

I’ll do some more like this.


Alberta Wind – April 2015

As some of you my have noticed I like to mock the idea that wind can take over for fossil fuels.

Here is the Actual Wind Production versus the day ahead prediction.

Purple is the the 1450MW of power wind could generate (and never does).

Green is actual.  Notice it goes to zero several times and under 200MW a bunch of times.

And several of those low stretches last a whole day!

Alberta_Wind_April_2016


Alberta Wind – March 2015

As some of you my have noticed I like to mock the idea that wind can take over for fossil fuels.

Here is the Actual Wind Production versus the day ahead prediction.

Purple is the the 1450MW of power wind could generate (and never does).

Green is actual.  Notice it goes to zero 4 times and under 200MW a bunch of times.

And several of those low stretches last a whole day!


AESO_Capture


Alberta NDP Coal Phaseout Could Triple Power Bills

If you live in Alberta Canada, get ready for a possible tripling of electricity costs.

“Whether you’re in oil and gas, forestry, agriculture, tourism, we need good, affordable, dependable power to be successful,” Coal Association of Canada president Robin Campbell said. “It’s one of the things we have in this province that allows us to compete globally and we’re about to lose that.”

The NDP says phasing out coal is necessary not only to reduce green house gases but also to improve air quality.

Campbell says all those concerns could be addressed through investing in clean coal technologies without jeopardizing base-load power.

New coal power plants generate more CO2 than natural gas but they generate way less CO2 than wood pellets.

Another study:

It found that the boost in renewables and the end of coal would mean a 45 per cent reduction in emissions, or 18.5 million fewer tonnes of carbon released into the atmosphere a year.

However, under the province’s privatized utility system, prices would have to be between $60 to $85 per megawatt hour to justify wind power construction.

And if solar power were to make up 50 per cent of the renewables mix “it would cost between $200 and $300 per megawatt hour,” the study found.

Alberta Energy Companies are bailing on contracts and leaving Alberta taxpayers to pay and pay and pay  for the NDP’s stupidity.

The NDP now have a “coal phaseout negotiator” for getting rid of coal. It will cost billions. And will make Alberta a have not province.


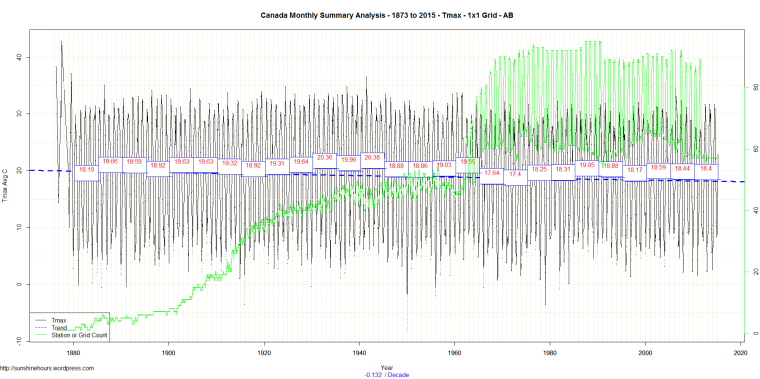
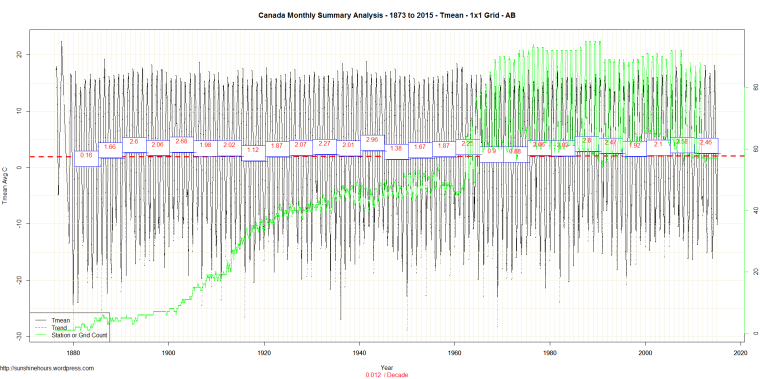
Alberta Canada Tmax , Tmin and Tmean from 1873 (On 1×1 Grid) – It Was 2C Warmer in the 1940s

This is the Alberta followup the BC post. You can read the explnations.

In the terms of Tmax the coldest period in Alberta (using 5 year means) was 1972-1976.

The warmest period was 1940 – 1944. In fact it was 2C warmer in 1940-1944 than 2011 – 2015. (The 1930s were just slightly cooler than the early 40s)

You may ask why the green line of grid counts goes up and down so much. It appears there are many more stations reporting in May/Jun/Jul/Aug/Sep than in the winter.

Tmax

Canada Monthly Summary Analysis - 1873 to 2015 - Tmax - 1x1 Grid - AB

Tmin

Canada Monthly Summary Analysis - 1873 to 2015 - Tmin - 1x1 Grid - AB

Tmean

Canada Monthly Summary Analysis - 1873 to 2015 - Tmean - 1x1 Grid - AB

Click for larger:


Environmentalists Win Battle Over Keystone XL – Environment Loses War

Environmentalists have kept the Keystone XL pipeline from being finished. Pipelines are the safest way to move oil to oil terminals on various costs of the USA and Canada. They are not perfect. There is some risk. But there is risk in every project.

Now oil companies are bypassing the Keystone.  They are going to move the oil (in fact they are already moving the oil) via rail. Moving oil by rail is not as safe. But it is easier to add rail cars and more rail terminals than it is to get a pipeline approved.

Way to go environmental morons. (Warning. Link is to NY Times)

“Since July, plans have been announced for three large loading terminals in western Canada with the combined capacity of 350,000 barrels a day — equivalent to roughly 40 percent of the capacity of the proposed Keystone XL pipeline that is designed to bring oil from western Alberta to refineries along the Gulf Coast.  Over all, Canada is poised to quadruple its rail-loading capacity over the next few years to as much as 900,000 barrels a day, up from 180,000 today.”

“The Canadians remain a few years behind producers in North Dakota, where the paucity of pipelines encouraged early oil explorers like EOG Resources to form a partnership with Burlington Northern Santa Fe to build terminals for the shipment of oil by rail to refineries across the country.  Today more than three-quarters of North Dakota’s production, which also was to move on the Keystone XL pipeline, is transported by rail. The Canadian oil producers took notice.”

Flooding in Alberta Has Never Happened Before! (Ooops … Maybe Not)

Some AGW cult members have blamed flooding in Calgary on “Climate Change”.

Calgary Herald (via Small Dead Animals)  points out that flooding has happened before in Alberta.

* CALGARY (June 1897) Bow River rises about five metres turning downtown into a lake, washing out bridges, short-circuiting electricity and cutting Canadian Pacific’s line to Vancouver.

* CALGARY (June 1915) The Bow washes away Centre Street Bridge, nearly drowning two city officials. Sheep Creek floods Okotoks and cuts gas mains, leaving Calgarians without cooking fuel.

* CALGARY (June 1923) The Elbow River breaks the 1915 record by 20 centimetres when it rises to 2.9 metres. The Bow River, though it rises 1.5 metres above normal, is still about .6 metres under the 1915 record height.

* CALGARY (June 1929) Bow, Elbow and Highwood rivers overflow to submerge High River as well as southwest and northwest city districts under a metre of muddy water. It takes a heavy toll on zoo animals.

* CALGARY (June 1932) On June 1, 1932, Calgary receives 79.2 mm over a 24-hour period, just .6 mm less than the average rainfall for the whole month. The empty reservoir of the recently completed Glenmore Dam prevents major damage.

* CANMORE (February 1937) Ice jams cause the Bow River to flood, dousing heating plants and forcing families to scramble for their lives in -20C temperatures.

* CALGARY (January 1942) Backed up by an ice jam, the Bow River overflows into Sunnyside.

* HIGH RIVER (May 1942) The town lies under two metres of water after rains swell the Highwood River, forcing evacuation of homes.

* CALGARY (November 1945) Frigid water inundates the Hillhurst area due to ice jams, prompting an investigation of flood control improvements.

* CALGARY (November 1946) Zookeepers evacuate animals from St. George’s Island to escape a flood caused by ice jams.

* CALGARY (March 1947) Rapid thaw of heavy spring snow swells rivers, soaks Hillhurst and Sunnyside.

* CALGARY (January 1948) Ice jams send frigid water from the Bow spilling over into Chinatown and Sunnyside.

* CARDSTON (April-June 1948) Two men drown in Cardston and 2,000 residents of nearby Pincher Creek flee homes.

* CALGARY (December 1950) Nearly 3,000 residents are forced to abandon their houses, apartments and hotel rooms in -30C degree temperatures when ice jams the Bow.

* MEDICINE HAT (March 1951) Six bombs dropped by military aircraft fail to clear an ice jam on the South Saskatchewan River, which floods homes.

* LETHBRIDGE (June 1953) The Oldman River, swollen to levels six metres above normal, washes away houses, forces neighbourhoods to be evacuated, cuts rail lines and short-circuits electricity supplies.

* FORT MACLEOD (June 1975) A 20-year-old man from Standoff, on the nearby Blood Indian Reserve, is swept away and drowned in the Oldman River, which is sent over its banks by rain and melting mountain snow.

* CALGARY (August 1990) Freak, “one-in-50-years” rainstorms hit twice in two nights in the northwest districts of Dalhousie, Charleswood and Brentwood, flooding basements and marooning cars.

* SOUTHERN ALBERTA (June 1995) An estimated 500 people from Calgary to the U.S. border are evacuated. Waterton Lakes National Park closes and all tourists are evacuated. In Calgary, two pedestrian bridges are washed away as is the warning boom above the weir. The Leth-bridge sewage treatment plant is flooded, dumping raw sewage into the Oldman River, which is flowing as much as 100 times its normal amount.

* HALKIRK (east of Red Deer) (June 3, 1996) 175 mm of rain falls in one hour, wiping out crops and roads, and popping the lids off manholes.

* SOUTHERN ALBERTA (June 2005) Three floods swamp basements, mangle bridges and tear apart roads, pathways and parks. In their wake, four lives are lost. Rain-swollen rivers burst their banks, flooding numerous southern Alberta towns and forcing thousands of residents to evacuate. In Calgary, one in 10 homes reported damage and 14 municipalities were forced to declare states of emergency. Rainfall for the month in Calgary measured 247.6 mm, more than three times the normal of 79.8 mm.