Not climate related, but I liked it.
Category: Curiousity
Temperature Trend By Julian Day
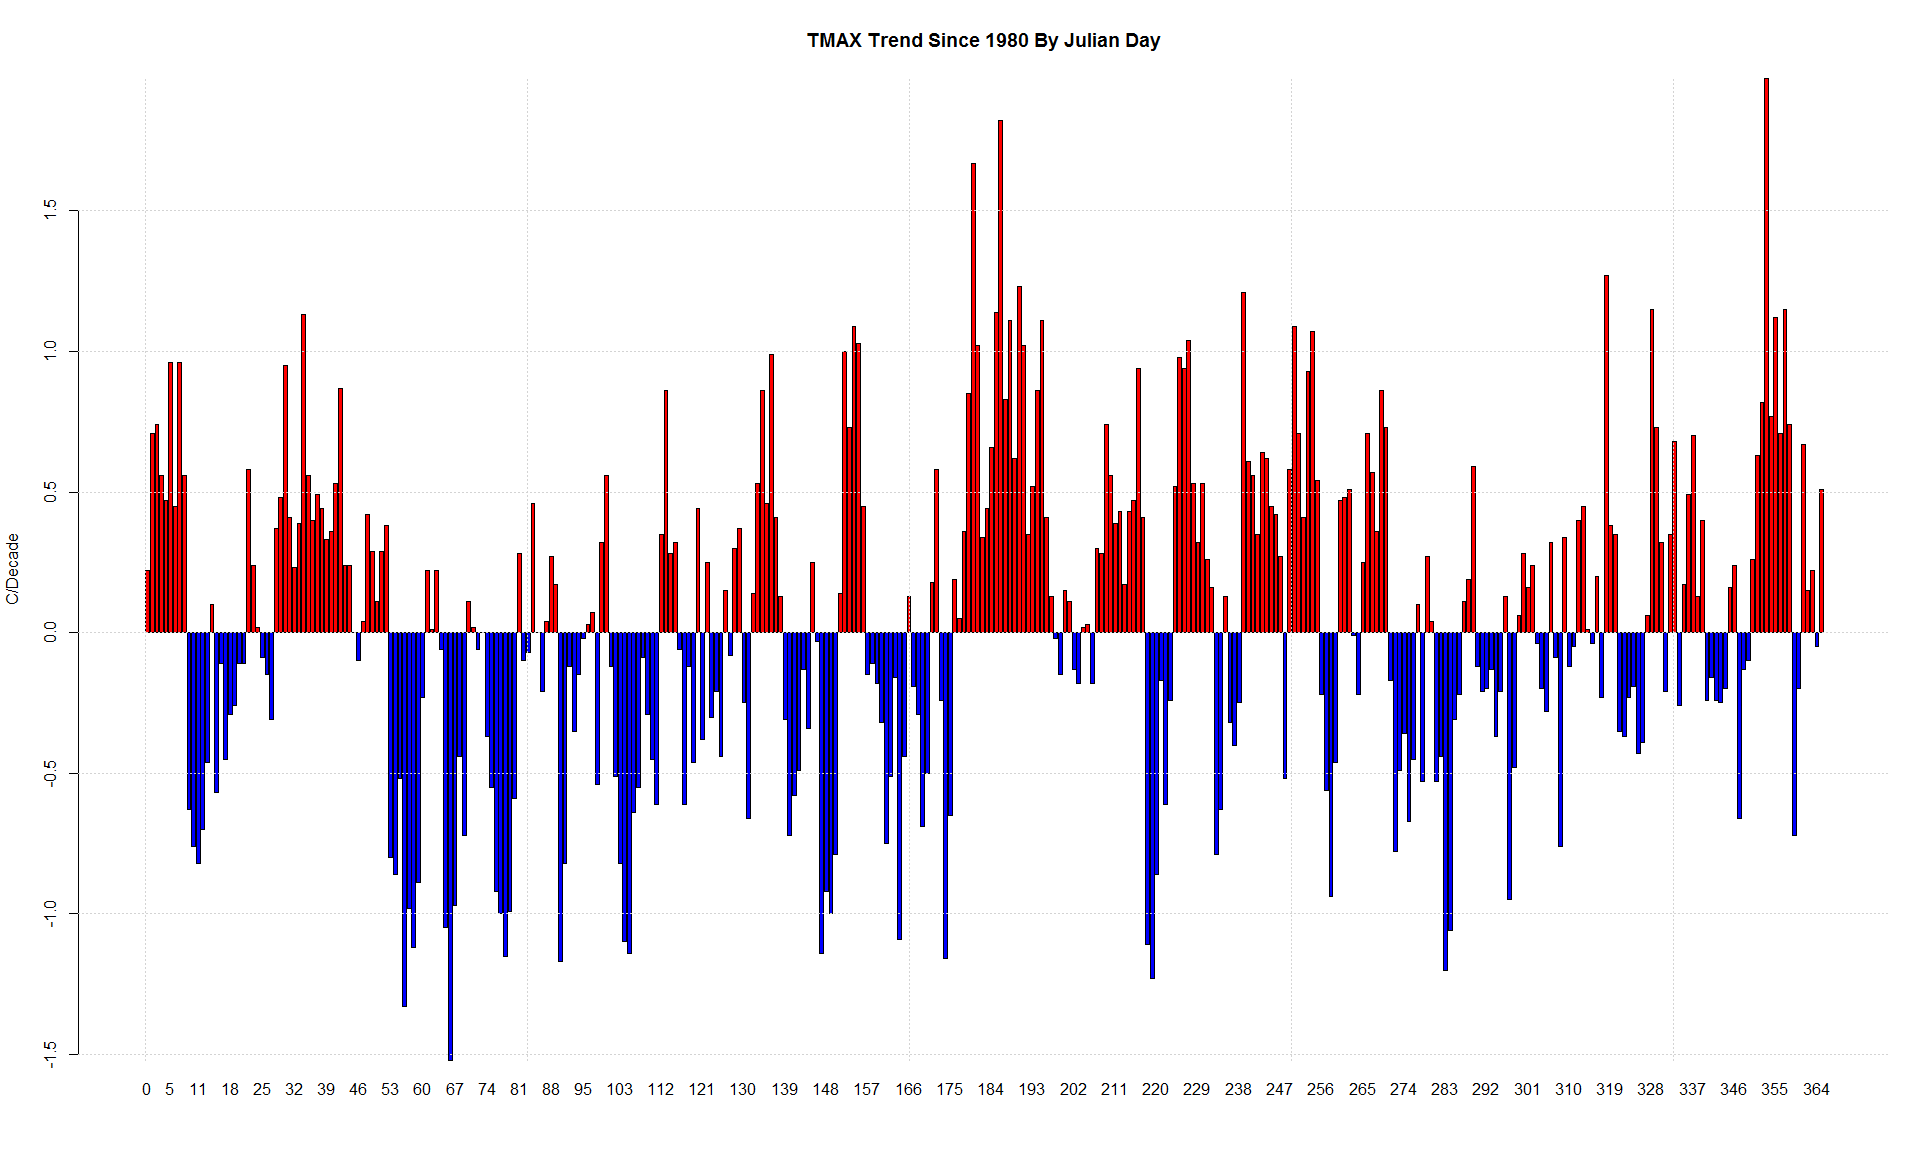
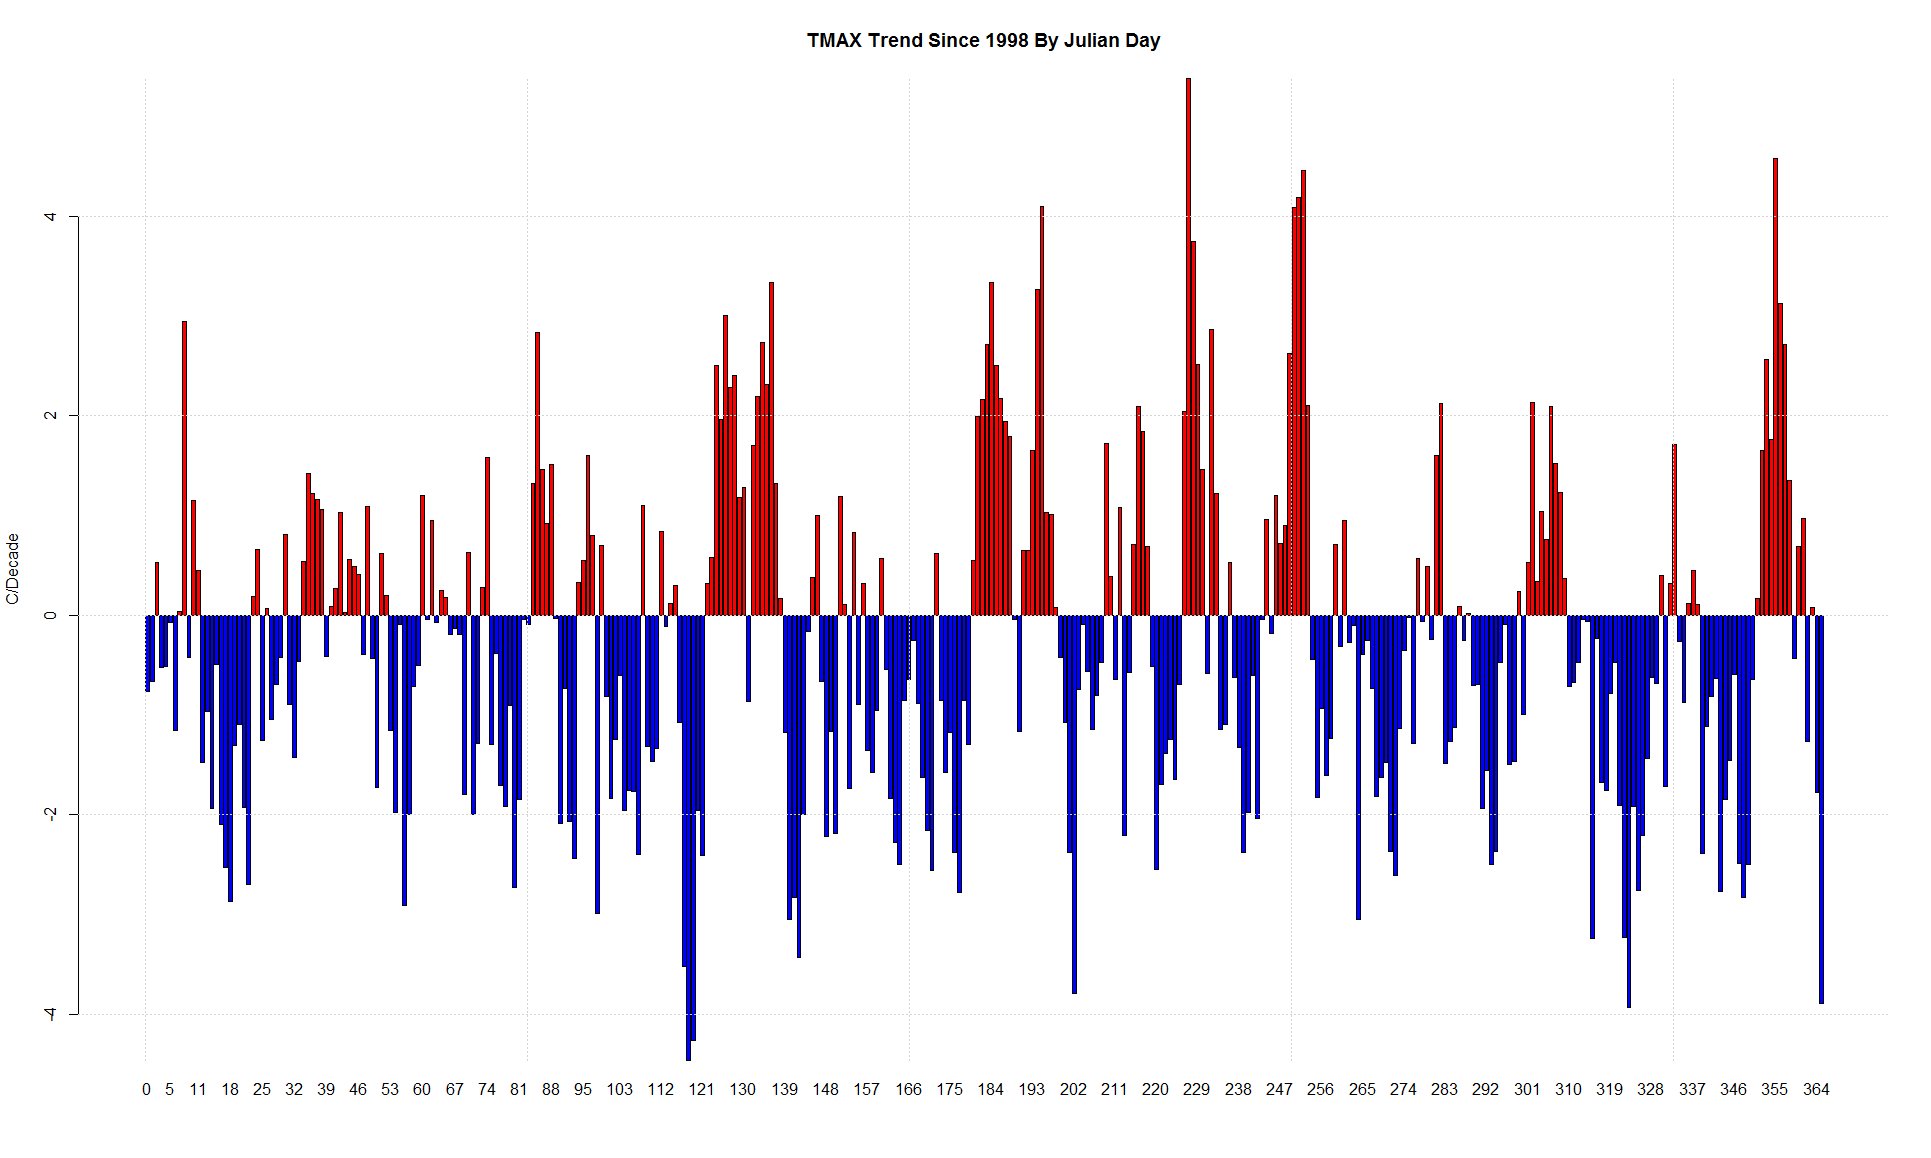
I live on the west coast. Out of idle curiosity I wondered what would happen if I took the Tmax daily data for my hometown since 1998 and graphed the Trend (in C/decade) by Julian day.
The trends go from -4.4C/decade all the way up to 5.4C/decade. The mean of all the julian day trends is -0.28C/Decade
If I graph the data since 1980. The mean of all the julian day trends is +.05C/Decade