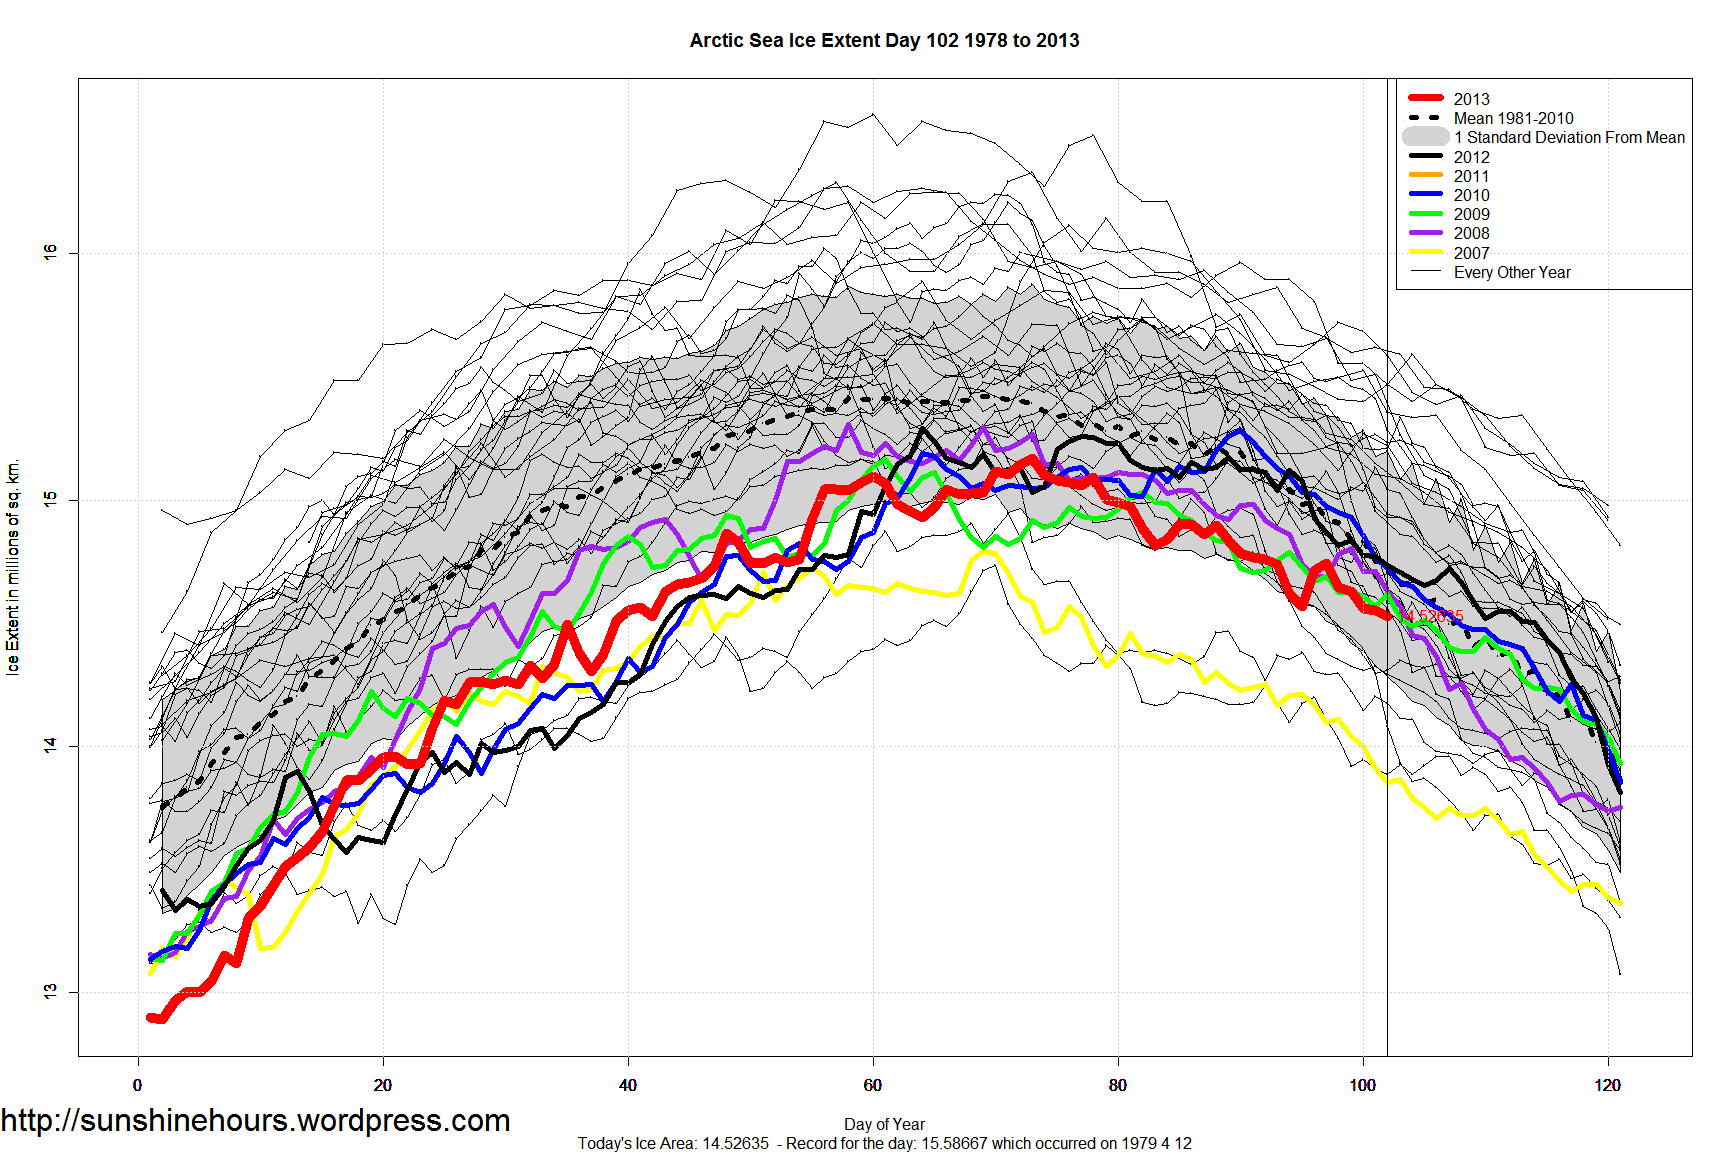
Arctic Sea Ice Extent 2013 is only 4th lowest so far using the mean up to this day in each year.
And the anomaly is half the 2006 anomaly.
We are saved!
| Year | Anomaly (sq km) |
| 2006 | -916,781 |
| 2005 | -744,955 |
| 2007 | -743,831 |
| 2013 | -484,217 |
| 2010 | -446,517 |
| 2012 | -445,151 |
| 2009 | -401,894 |
| 2004 | -347,932 |
| 2008 | -307,371 |
| 1996 | -212,097 |
| 2000 | -121,103 |
| 2002 | -54,227 |
| 2001 | -16,150 |
| 2003 | 14,480 |
| 1995 | 17,785 |
| 1991 | 52,640 |
| 1999 | 66,556 |
| 1997 | 96,180 |
| 1984 | 139,216 |
| 1992 | 184,595 |
| 1989 | 256,508 |
| 1994 | 271,011 |
| 1998 | 344,667 |
| 1981 | 375,843 |
| 1985 | 380,320 |
| 1990 | 399,046 |
| 1993 | 467,706 |
| 1988 | 479,840 |
| 1986 | 513,926 |
| 1987 | 598,476 |
| 1980 | 644,064 |
| 1983 | 693,561 |
| 1982 | 744,653 |
| 1979 | 950,301 |
(daily data from here)