UPDATE: Graphs with identical axis here.
Earlier today I noted that JAXA version 2 is out and I certainly didn’t like the new revision.
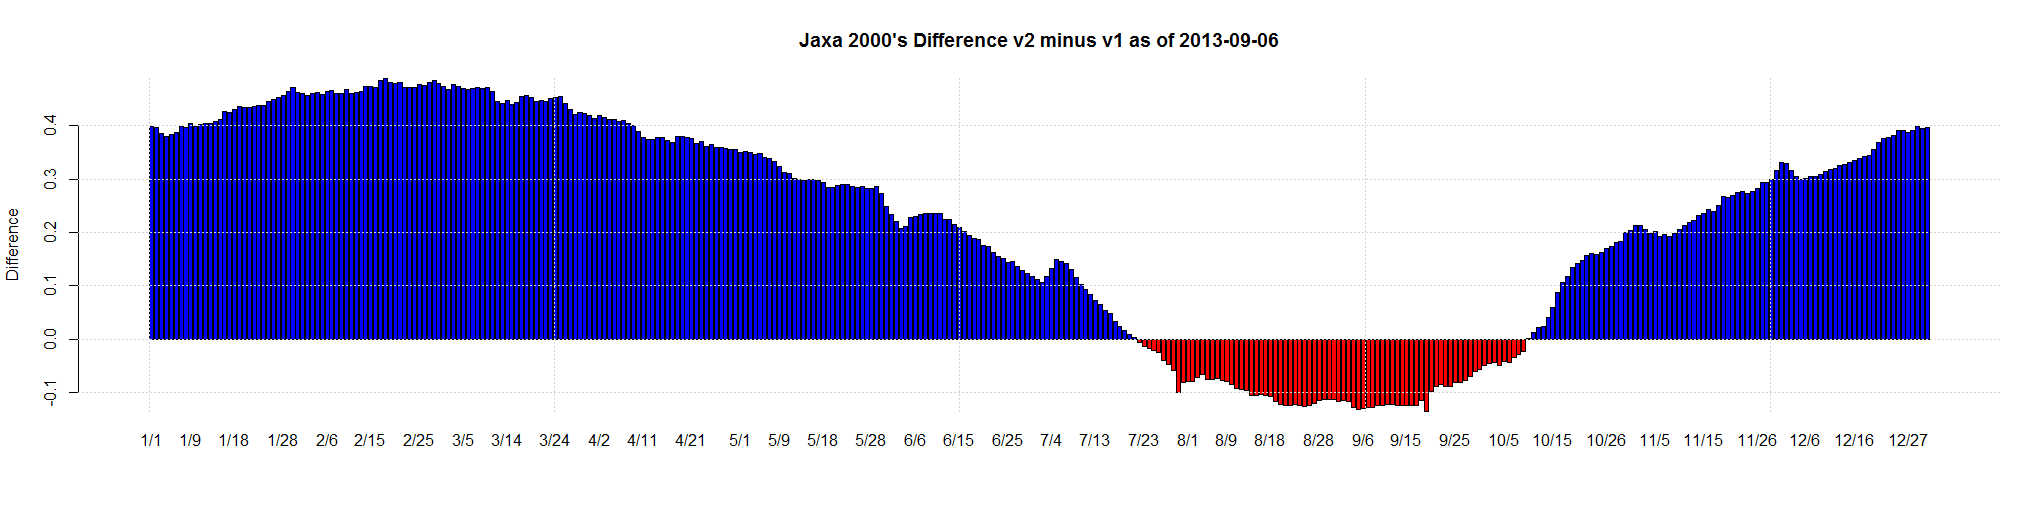
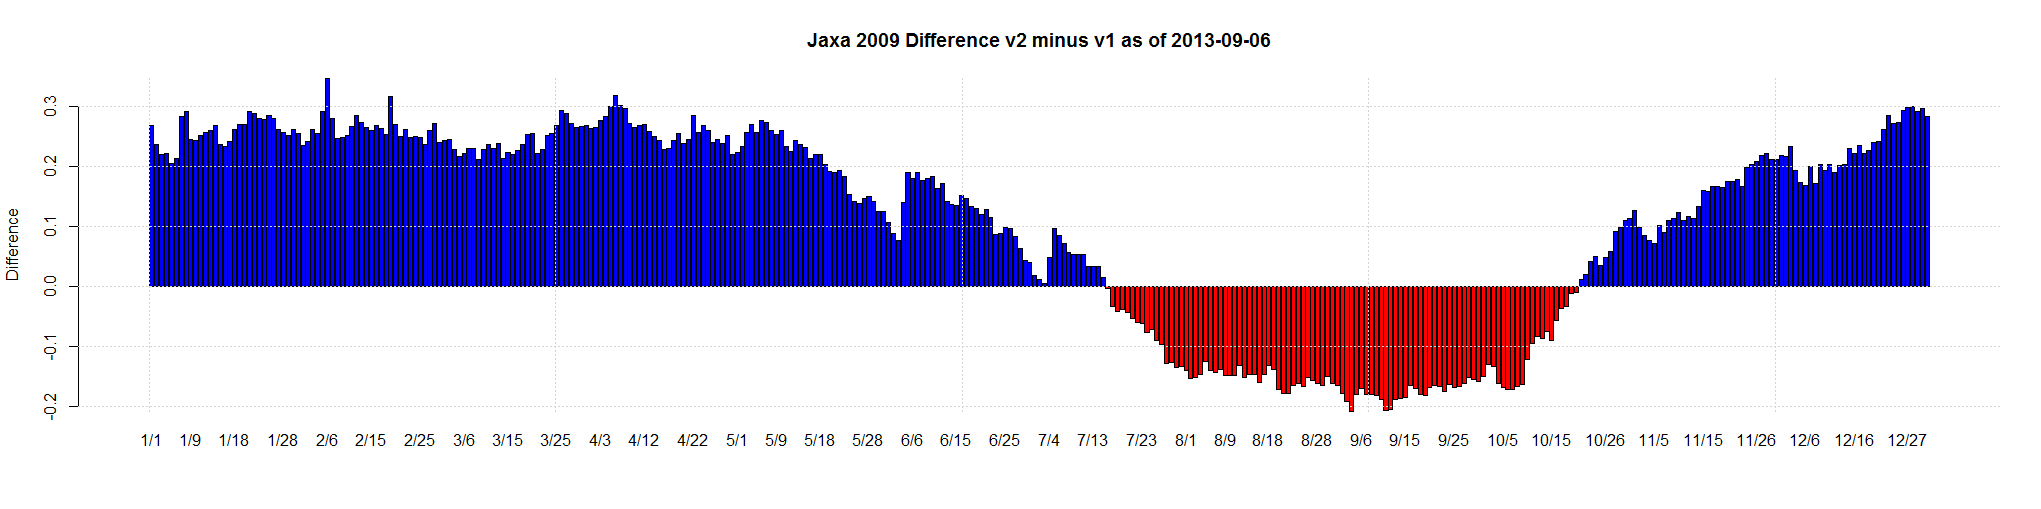
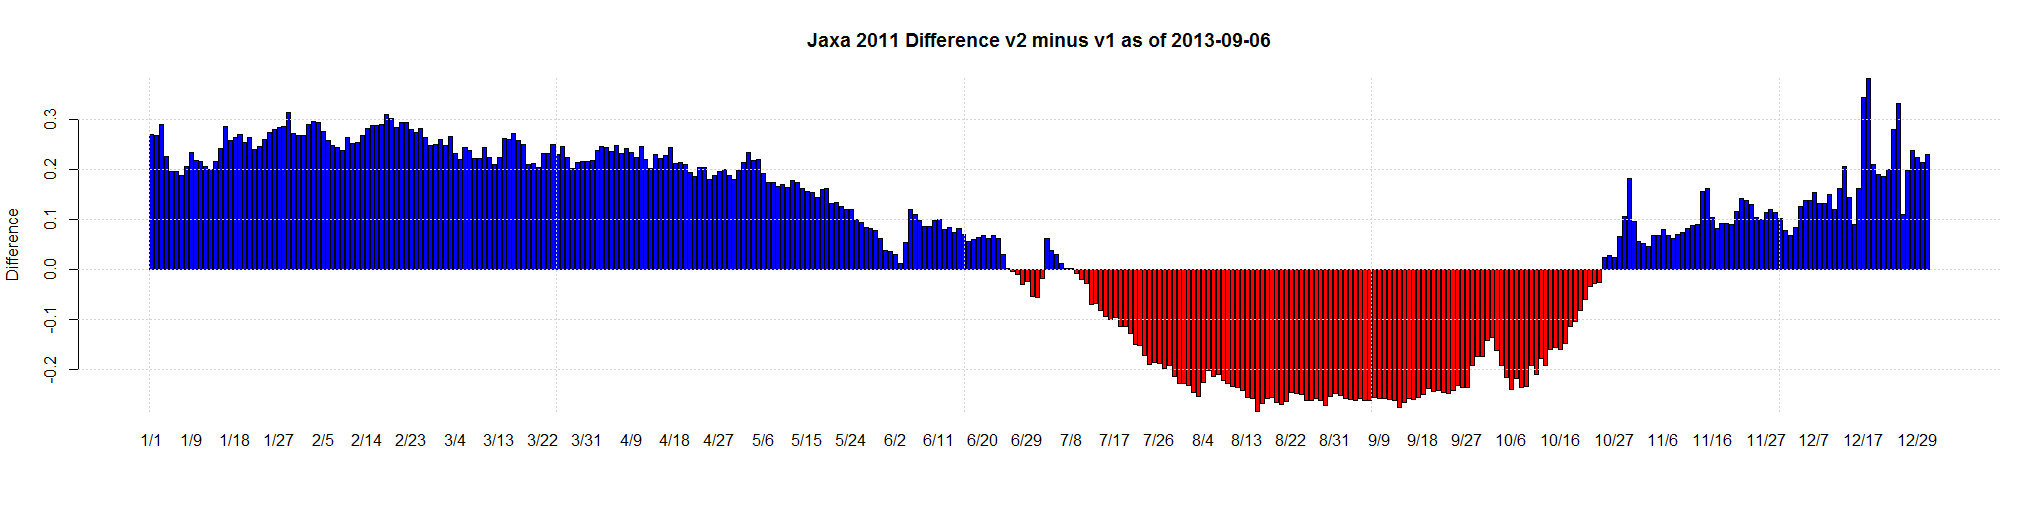
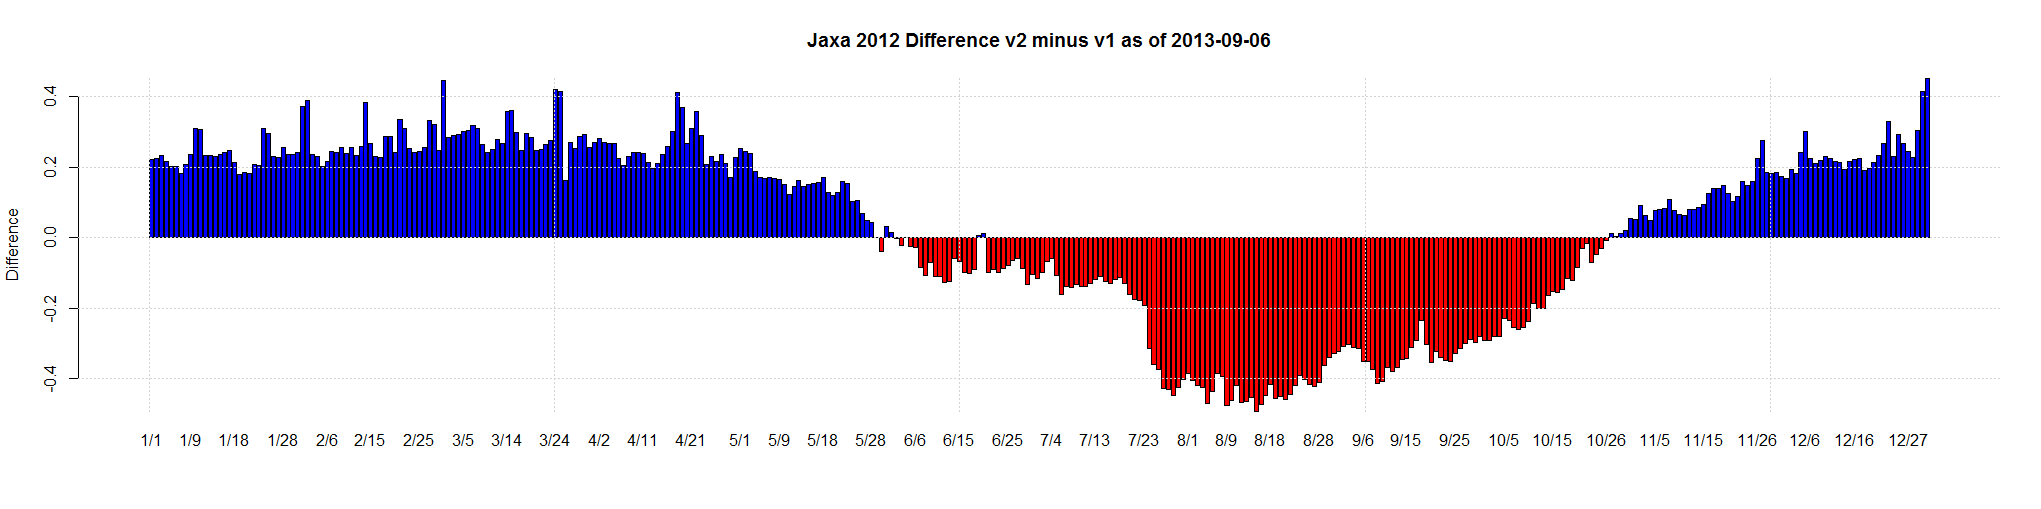
Here are all the years/decades compared. Remember the 1980’s, 1990’s and 2000’s are averages for the whole decade. And 2002 is incomplete and starts in June. And 2013 is incomplete because the year isn’t over.
I don’t understand how the 1980s / 1990s / 2000s “red” adjustment is so small compared to 2013 etc.


One thought on “Jaxa Version 2 – All The Other Graphs Compared”