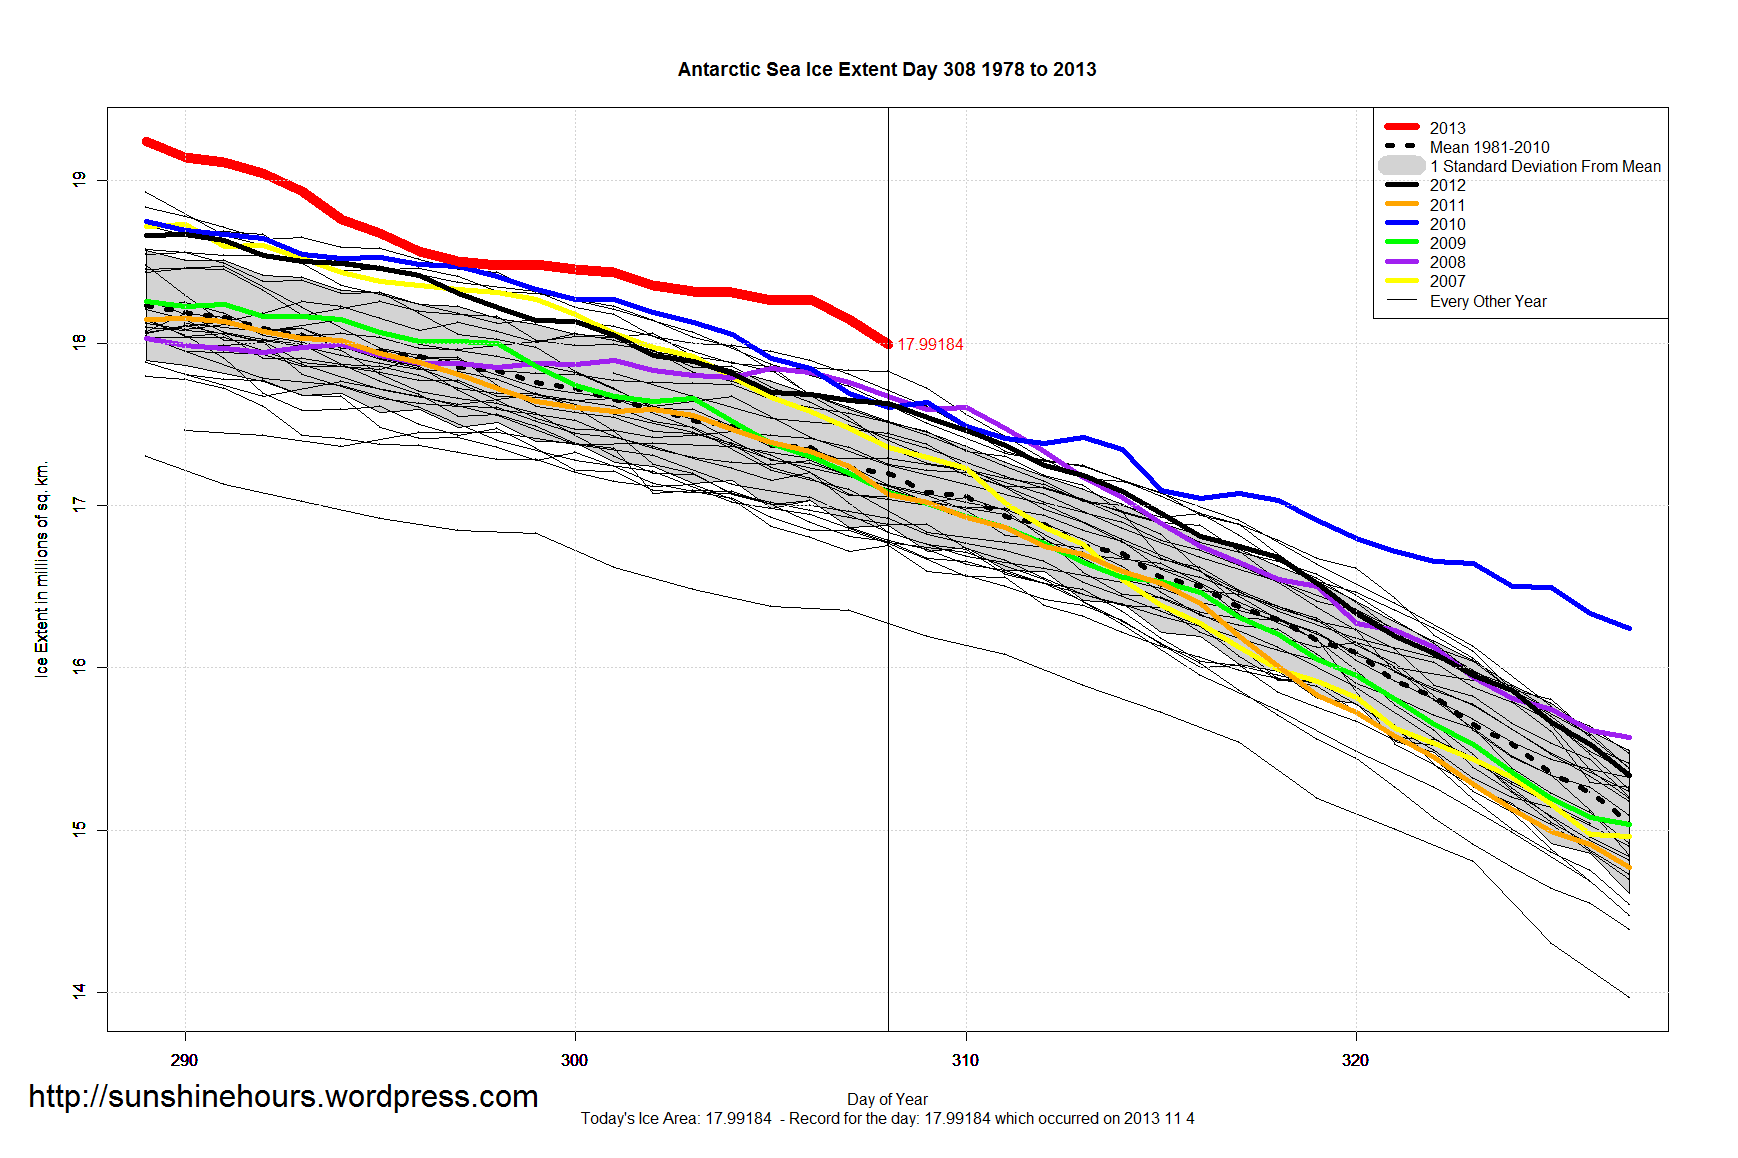
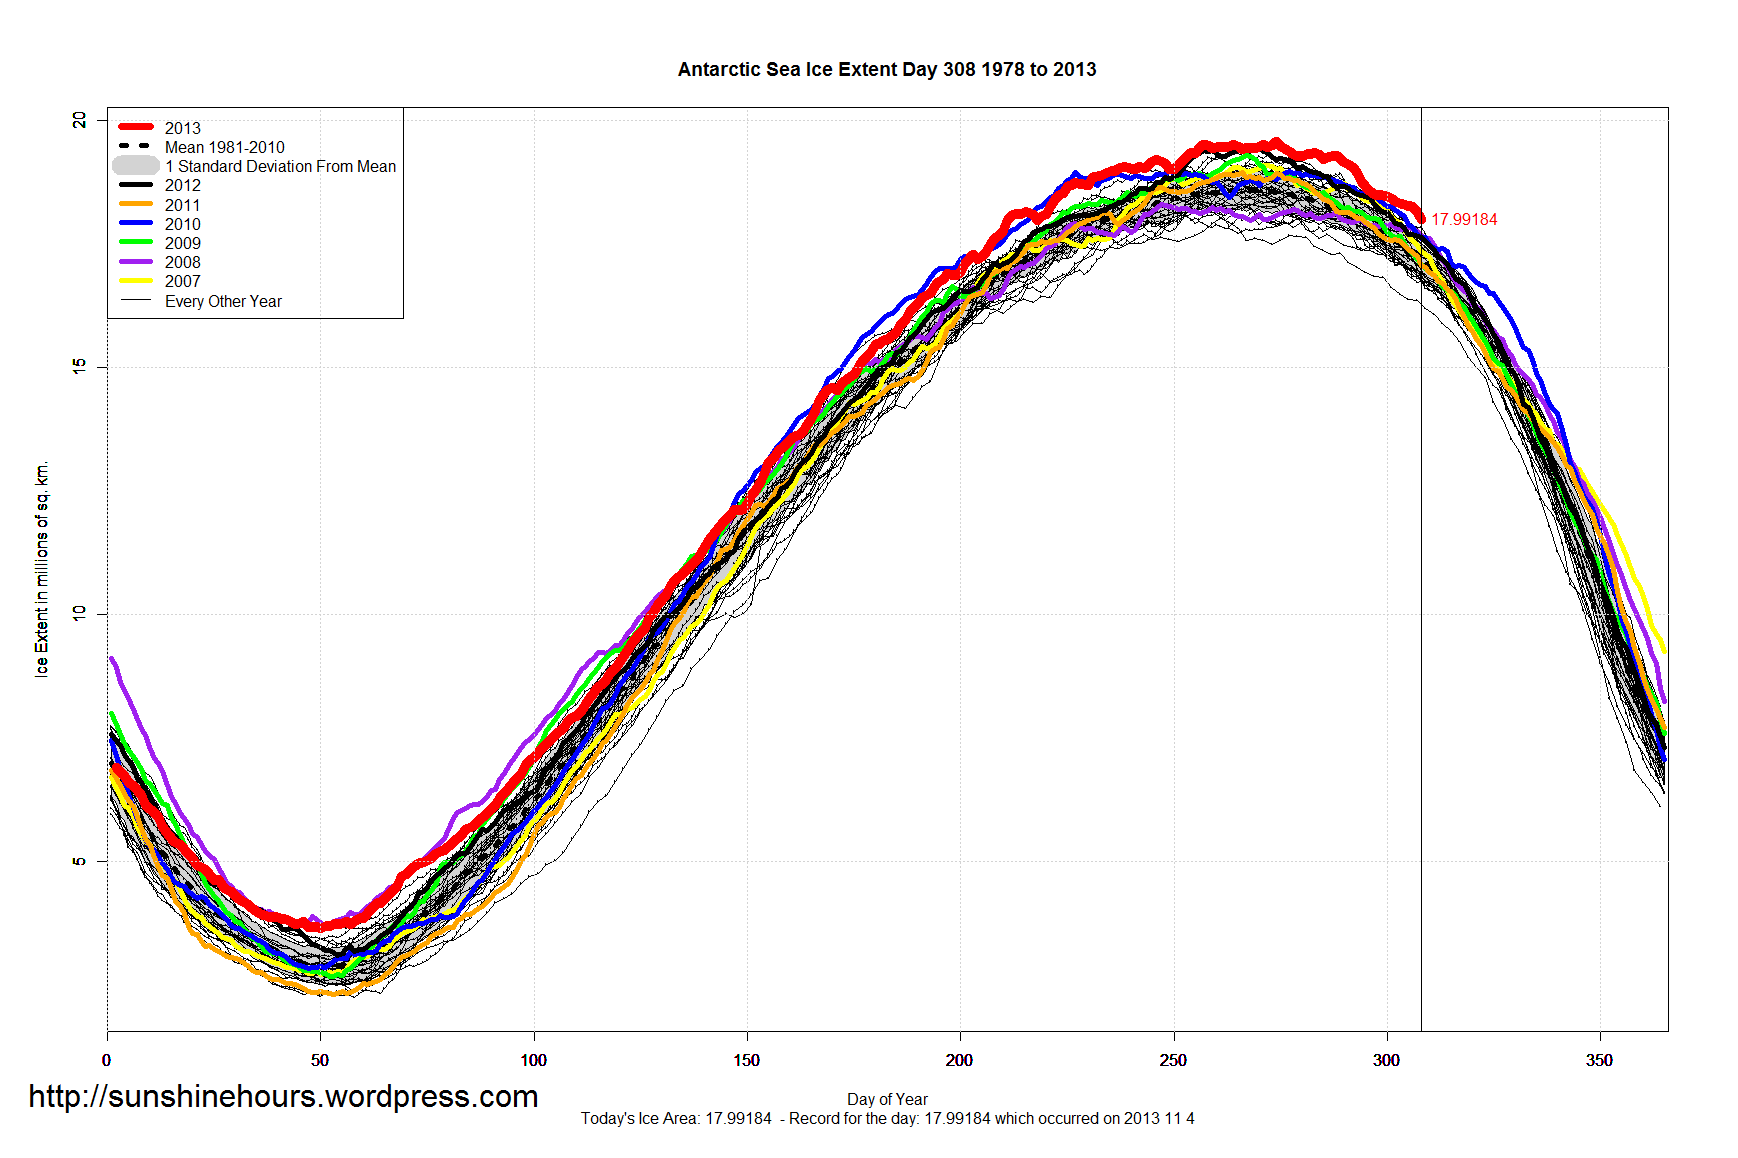
The 92nd daily record for Antarctic Sea Ice occurred on November 4th (day 308).
As predicted, 1998’s two records no longer exist. And there are now only 2 daily records from before 2000.
There are 57 days left in the year, I think 2013 can catch 2010 for number of daily records in a year. Catching 2008 will be harder, but not impossible.
| Year | No of Records |
| 2008 | 125 |
| 2010 | 101 |
| 2013 | 92 |
| 2007 | 21 |
| 2009 | 8 |
| 2012 | 8 |
| 2000 | 4 |
| 2004 | 3 |
| 1979 | 2 |
| 2005 | 1 |
| 2006 | 1 |

Would not be surprised that by this time next year Arctic ice will be doing the same thing as Antarctic ice extent
Going to take some time fro Arctic to fully recover.
AMO needs cold phase for full recovery. AMO chart shows how warm phase started uptrend in late 70’s when the arctic sea ice started to decline.
Look at the chart of AMO.
http://www.woodfortrees.org/plot/esrl-amo
BTW the news reports that global warming has caused winds to increase in Antarctic and is responsible for record sea ice is bus.
Low solar cycles have decreased and since cycle 23 and start of cycle 24 in 2008 was longest period without sunspots in long time has been very quiet except for two active periods. Last January and recently starting around first week in October.
Quiet sun activity results in stratospheric warming( total opposite then what you would think happens) and during winter expands the air in stratosphere pushing down on troposphere increasing winds at the surface pushing cold air out further away from the poles During summer it can keep cold air away from the poles but not as far during winter months .
Will be close if can break 2010 record since sun has heated up a bunch foe almost a month. Stratospheric cooling shrinking air around s pole late few weeks. Dip in sea ice last week looks like result.
Look at this tsi data also. Record ice and low tsi (solar flux.)
TSI around 2010 was Lowest recorded in long time.
Enjoy
http://www.woodfortrees.org/plot/pmod