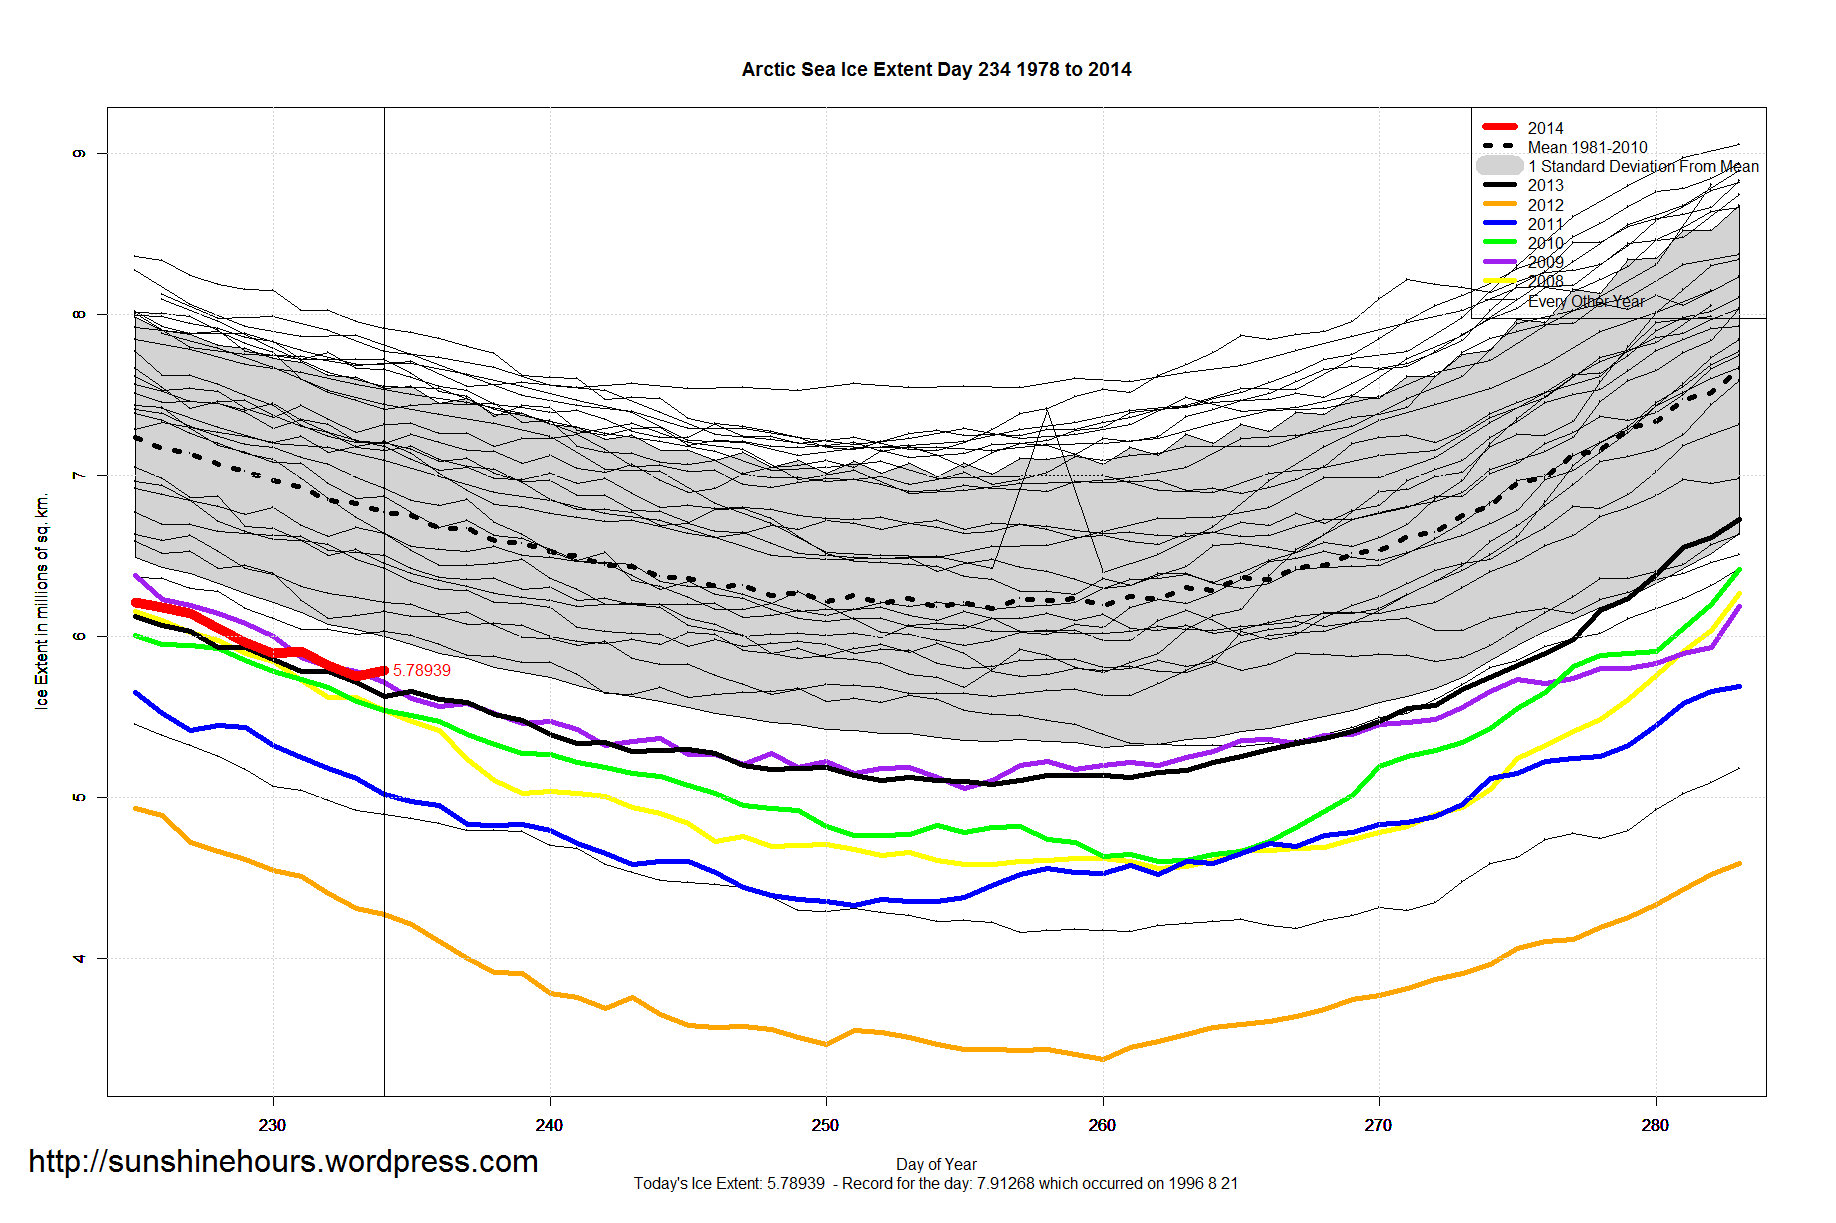
Arctic Sea Ice Extent Aug 23 2014 – -1,071,000 sq km below the 1981-2010 mean. Data for Day 234. Data here.
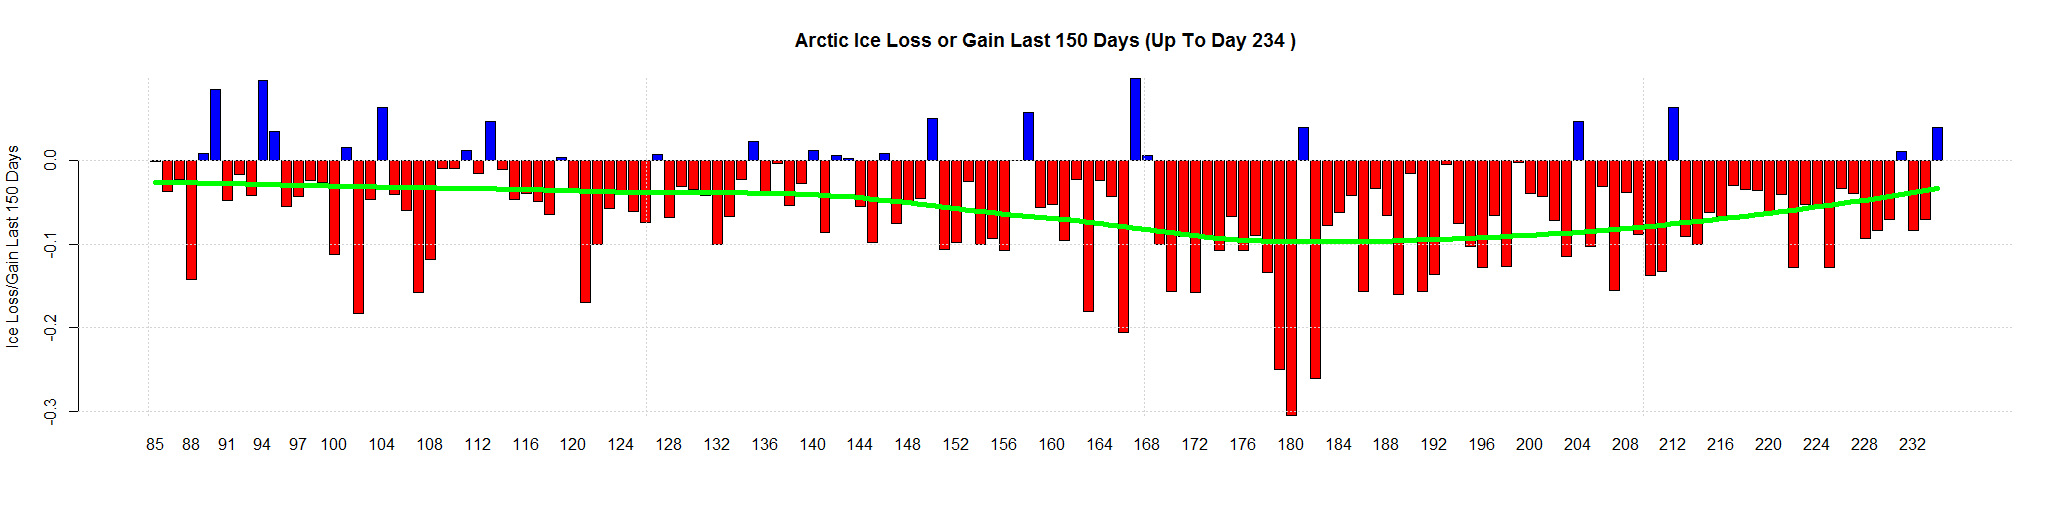
A 39,000 sq km gain. The second gain in 4 days,

Arctic Sea Ice Extent Aug 23 2014 – -1,071,000 sq km below the 1981-2010 mean. Data for Day 234. Data here.
A 39,000 sq km gain. The second gain in 4 days,

Uh Oh! The lines are going up and it’s not even September yet!
Well, somehow I don’t think that it has bottomed out yet.
I think 2009 (purple) is the pattern we are looking at … zig zag up and down even after it bottoms out.
OTOH DMI shows a little warming … so who knows.
http://ocean.dmi.dk/arctic/meant80n.uk.php
But the green line on the top chart appears to have been sloping up for over 40 days?
While it is an upward trend it is still below 0.
Ok so while it shows an upward trend your saying that it is insignificant even though it’s going up before the traditional time when Arctic ice extent reaches it’s minimum? And please educate me here. Exactly what measurement of ice does the chart we’re discussing refer to? Mass or Extent? I don’t mean to be a bother. Just a dumb truck driver trying to figure out what I’m looking at.
Extent.
And the melting slows so the trend keeps going up.