Day 280: MASIE extent grows by 309,000 in the last 2 days to 6.18 M Km2 or 40% of March max.
Ice recovery is especially impressive in Canadian Archipelago, where UAH is showing the coldest temperature anomaly on earth.
That region has gone from a minimum of 0.33 M on day 260, to an extent of 0.68 M 20 days later (from 39% of max to 80% of max)’
Other regions recovering strongly:
Central Arctic has grown back to 97% of the max last March
Beaufort Sea is up to 68%,
Canadian Archipelago is now at 80%
East Siberian Sea is up to 47%
I need some help with something. I read a lot of blogs and the increase in Antarctic Sea Ice is explained away by CAGW believers because Antarctic is losing Land Ice at a staggering rate. Could then one conclude that with all that Land Ice entering the ocean would increase at a “staggering” rate the sea level? They keep bringing up PIOMASS and Satellite measurements but it doesn’t make sense that the coldest place on the planet would be losing Land Ice at such a staggering rate.
Staggering? I think last estimate was 125Gt per year. Considering there is 30,000,000Gt of ice on Antarctica, the term should be microscopic. 240,000 years worth. (The next ice will stop that pretty quick)
And most of that is from the Antarctic Peninsula. East Antarctica is gaining ice.
Don’t believe their excuses. They didn’t predict it. No they are making stuff up to explain it.
More importantly … how much melting in the 1930s? More than now or less? They won’t say and they don’t know.


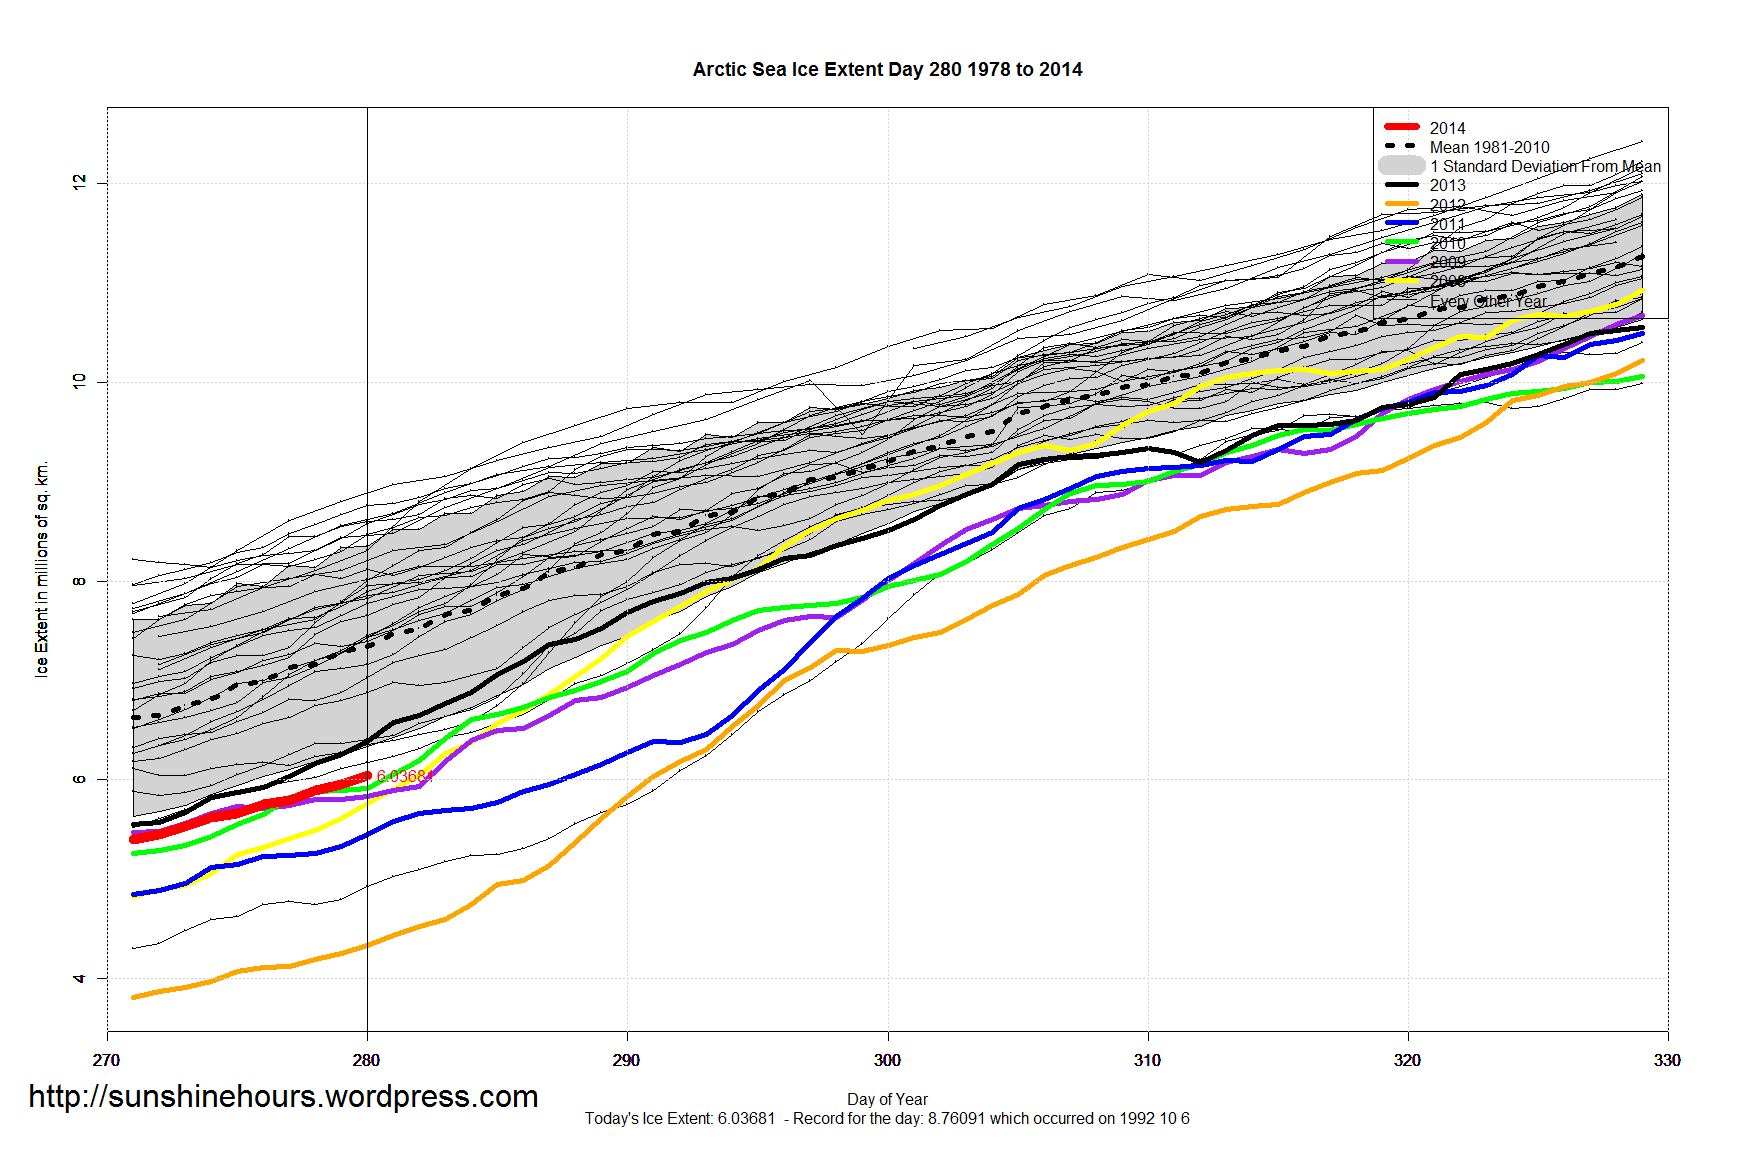

Day 280: MASIE extent grows by 309,000 in the last 2 days to 6.18 M Km2 or 40% of March max.
Ice recovery is especially impressive in Canadian Archipelago, where UAH is showing the coldest temperature anomaly on earth.
That region has gone from a minimum of 0.33 M on day 260, to an extent of 0.68 M 20 days later (from 39% of max to 80% of max)’
Other regions recovering strongly:
Central Arctic has grown back to 97% of the max last March
Beaufort Sea is up to 68%,
Canadian Archipelago is now at 80%
East Siberian Sea is up to 47%
Y axis scale on top graph looks wrong. I love the formats of the graphs and data you present. Thanks.
Disregard #2 complaint. I see that the Y axis is correct. My mistake.
I need some help with something. I read a lot of blogs and the increase in Antarctic Sea Ice is explained away by CAGW believers because Antarctic is losing Land Ice at a staggering rate. Could then one conclude that with all that Land Ice entering the ocean would increase at a “staggering” rate the sea level? They keep bringing up PIOMASS and Satellite measurements but it doesn’t make sense that the coldest place on the planet would be losing Land Ice at such a staggering rate.
Staggering? I think last estimate was 125Gt per year. Considering there is 30,000,000Gt of ice on Antarctica, the term should be microscopic. 240,000 years worth. (The next ice will stop that pretty quick)
And most of that is from the Antarctic Peninsula. East Antarctica is gaining ice.
Don’t believe their excuses. They didn’t predict it. No they are making stuff up to explain it.
More importantly … how much melting in the 1930s? More than now or less? They won’t say and they don’t know.
Thanks.