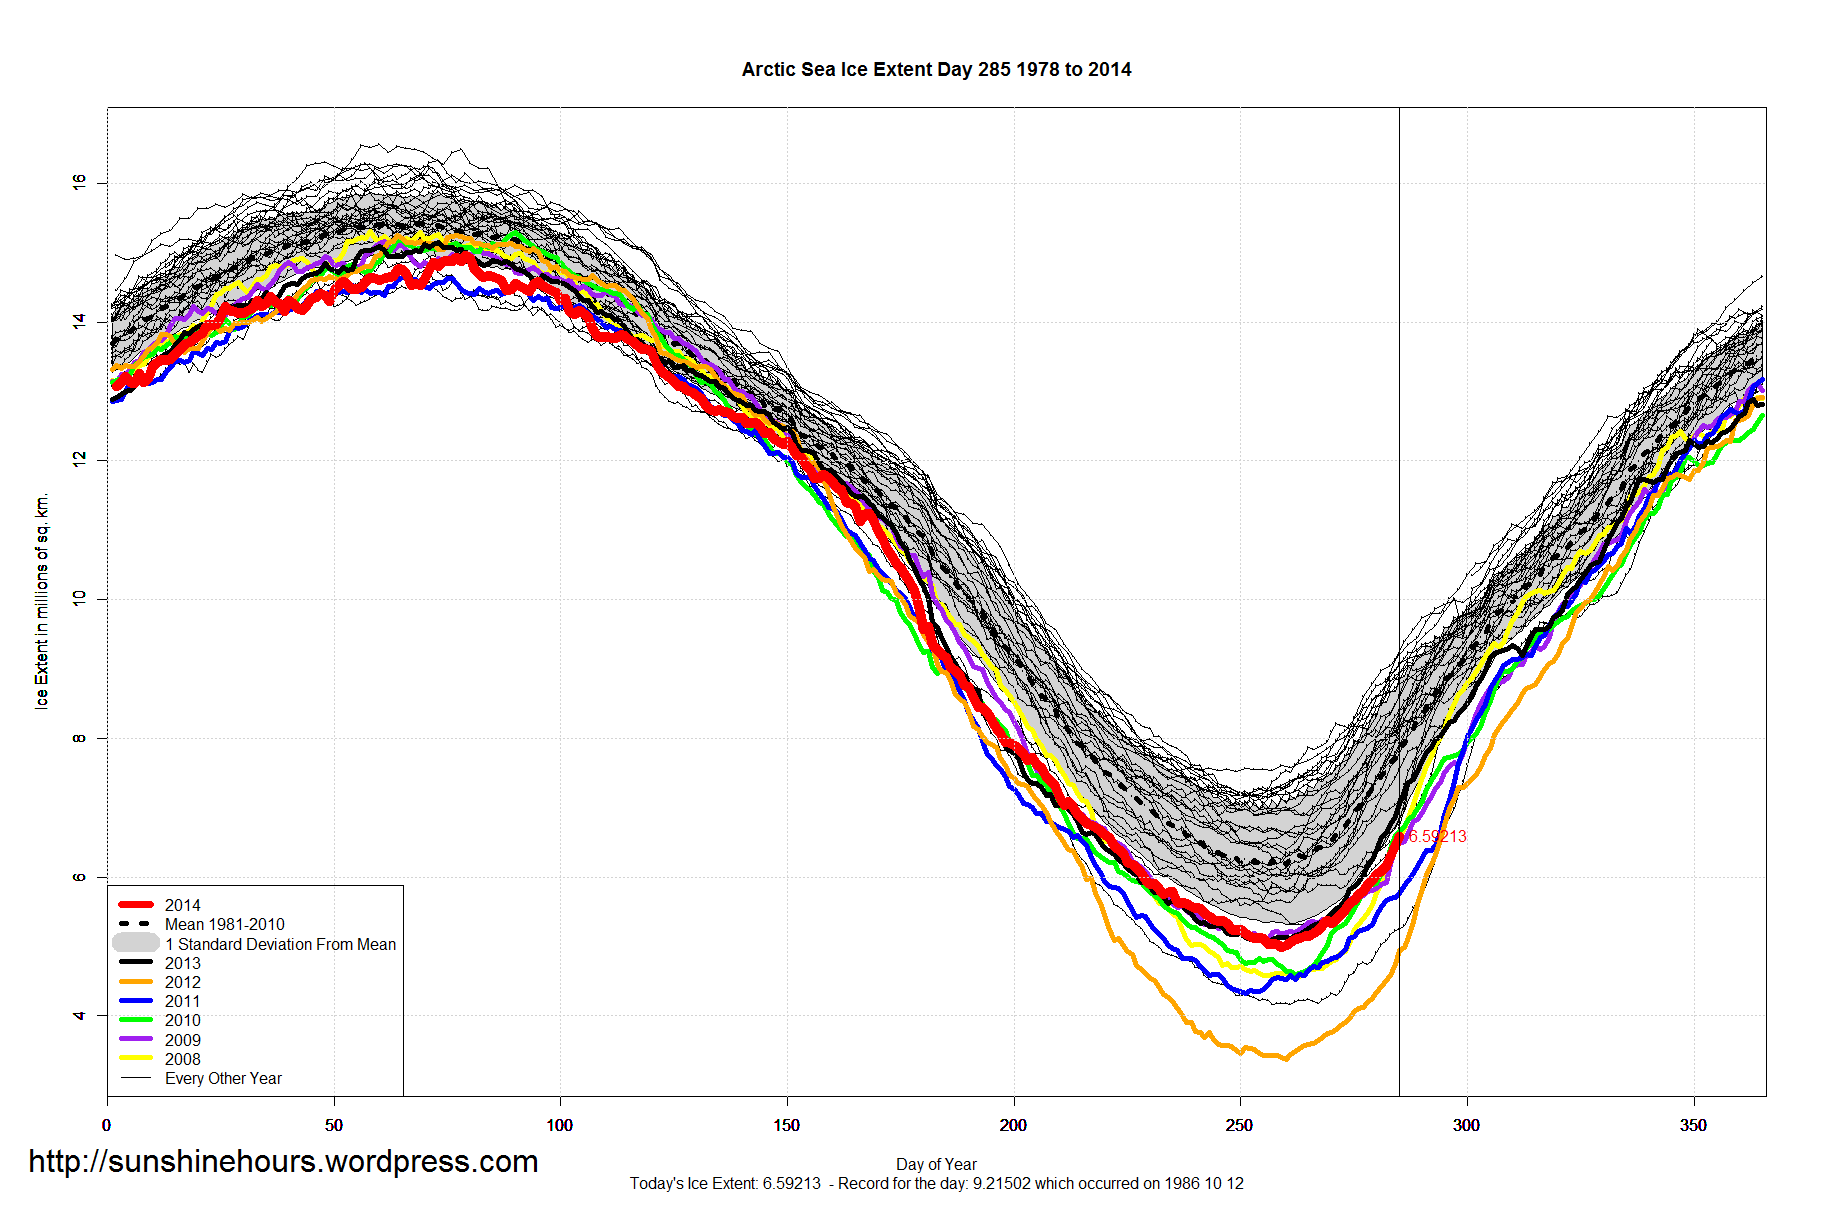
Day 286: MASIE extent grows by 220,000 in the last 2 days to 6.86 M Km2 or 44% of March max. Most regions with ice remaining are recovering strongly:
Central Arctic has grown back to 99% of the max last March
Canadian Archipelago is now at 81%
Beaufort Sea is up to 75%
Greenland Sea is up to 53%
East Siberian Sea is at 50%
Chukchi has grown to 39%,
Laptev, Kara and Barents have also recovered: 25 to 31%
Look at what is happening to the Northern Pacific. Believe it or not – the warmest area is in the Arctic!!!
Some of the areas have an anomaly of -8C to -9C or -14F to -16F, I have never seen temperatures like this!!
With Solar energy waning, what will happen to the Southern Pacific. It hasn’t had much heat [look at the record ice levels]; what are we heading toward????
jlurtz, those images are interesting. But I have trouble sorting out the color coding: each hue seems to appear four times at different level in the reference bar. So how do you know what (for example) is the temperature around Australia: Is it +15.5, +3.5, or -8.5?
You start at the “0.5” color which is the light blue. You then move the anomaly in C up or down depending on the area. For instance, by Japan find the light blue between the “red and the green”, that is the starting point at about 0C anomaly. Next, move toward the “red” going down in temperature to about -5.5C. On the other side go toward the “green/yellow” which is 2.0C. You can assume that the light blue is 0C anomaly, since there are no -12C or +12C areas on the map.
Note: scattered on the map are H and L where they have displayed the temperature anomaly for us.
By Siberia above Japan the anomaly is about -9C. It is the reddish/yellow area.
Jerry