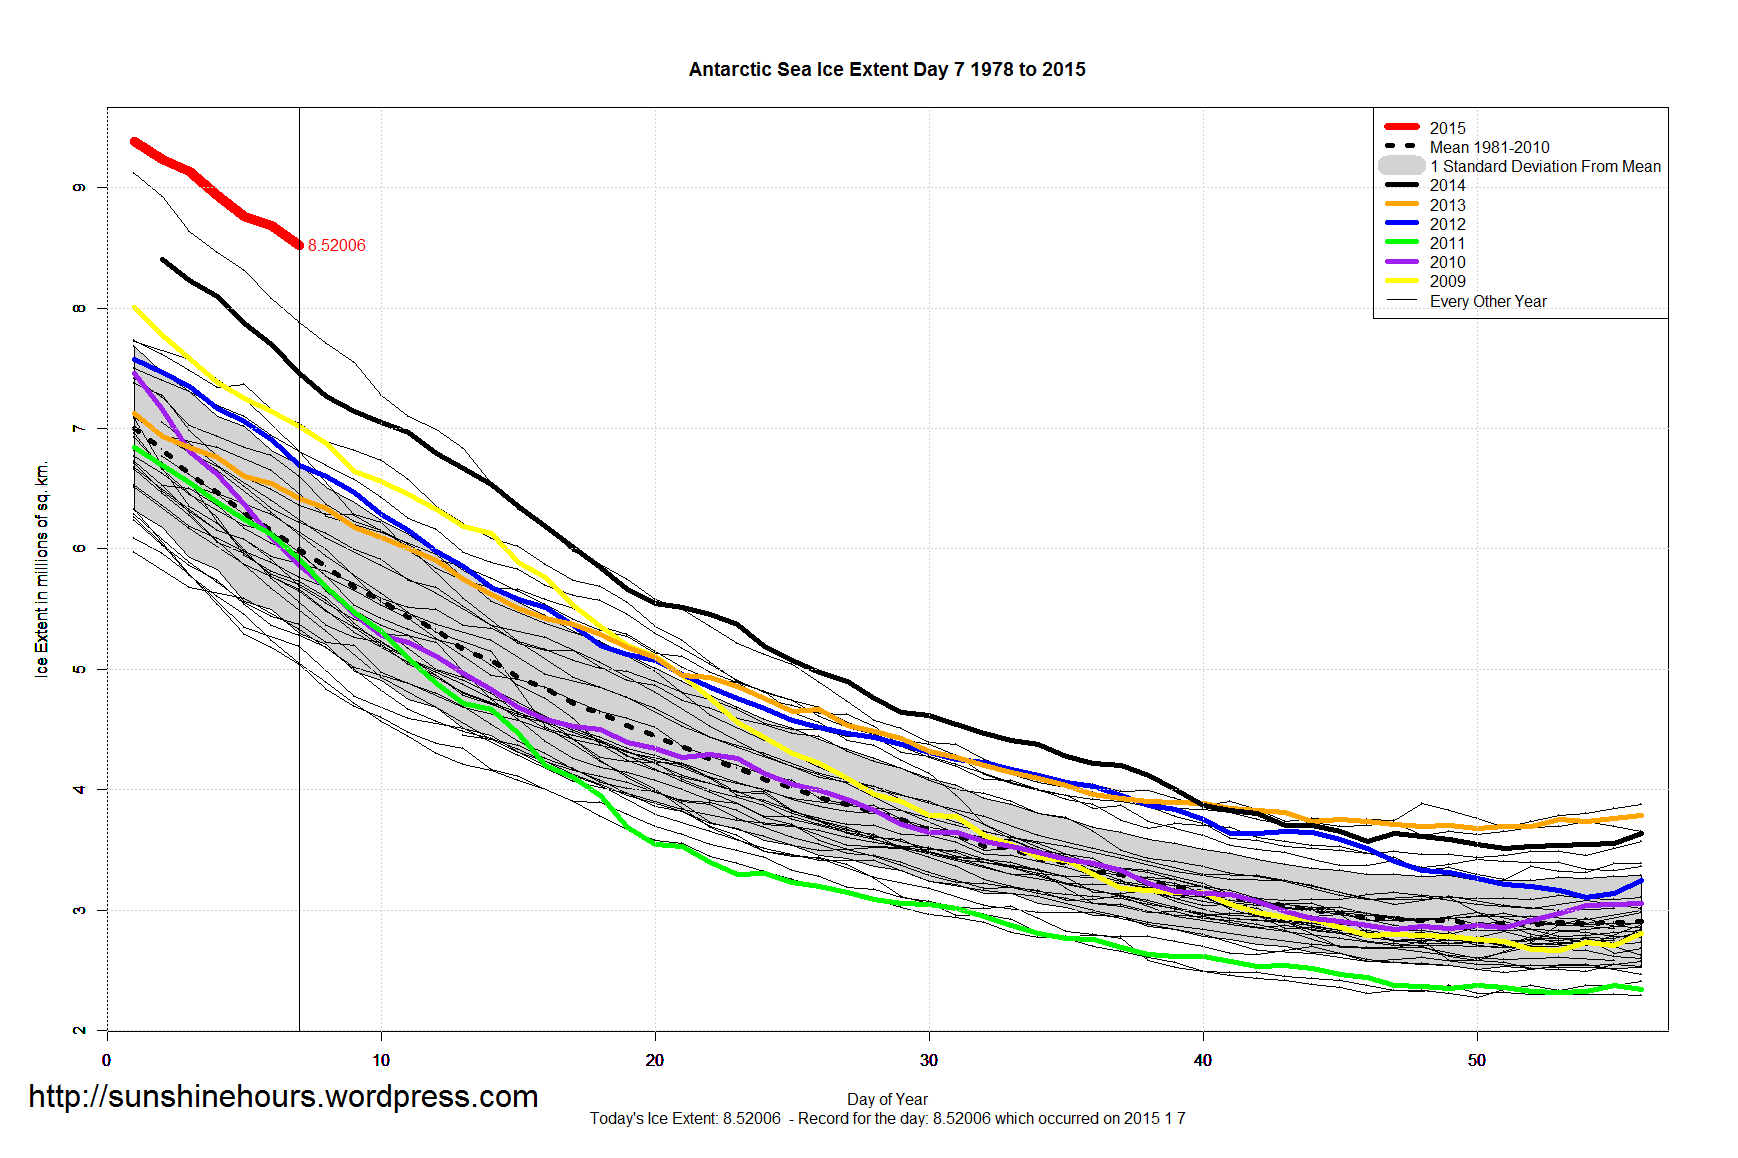
It is also over 1m sq km higher than the same day last year!
Many thanks for your efforts, found the tables you produced earlier to be especially interesting. Not only are we seeing more Antarctic sea ice extent, it would also appear that on a decadal average the day of minimum is coming earlier in the year?
Interesting to watch, but in the context of the planet 1979 to date is a very short data set. Once again thanks for your efforts.
Yes, it is a short context. What is your point? We live in the short context.
This is what is happening now, i.e., cold now, heat now, ice now.
If you want to go back 10,000 years for your analysis, be my guest!!!


Nice hockey stick graph.
how many above ‘standard’ deviations is that?
Three.
Did you notice Arctic SIE is the lowest in the records for January 7th? (NOAA data)
How come you don’t mention that? I’m sure it’s not because you’re biased or anything like that….
I do post that data. But the difference is trivial. Antarctica is SMASHING the records by 700,000 sq km.
Why don’t the “scientists” mention Antarctica. They get paid to notice. I don’t get paid.
It is also over 1m sq km higher than the same day last year!
Many thanks for your efforts, found the tables you produced earlier to be especially interesting. Not only are we seeing more Antarctic sea ice extent, it would also appear that on a decadal average the day of minimum is coming earlier in the year?
Interesting to watch, but in the context of the planet 1979 to date is a very short data set. Once again thanks for your efforts.
Yes, it is a short context. What is your point? We live in the short context.
This is what is happening now, i.e., cold now, heat now, ice now.
If you want to go back 10,000 years for your analysis, be my guest!!!