Antarctic Sea Ice Extent Breaks Daily Record By 600,000 sq km

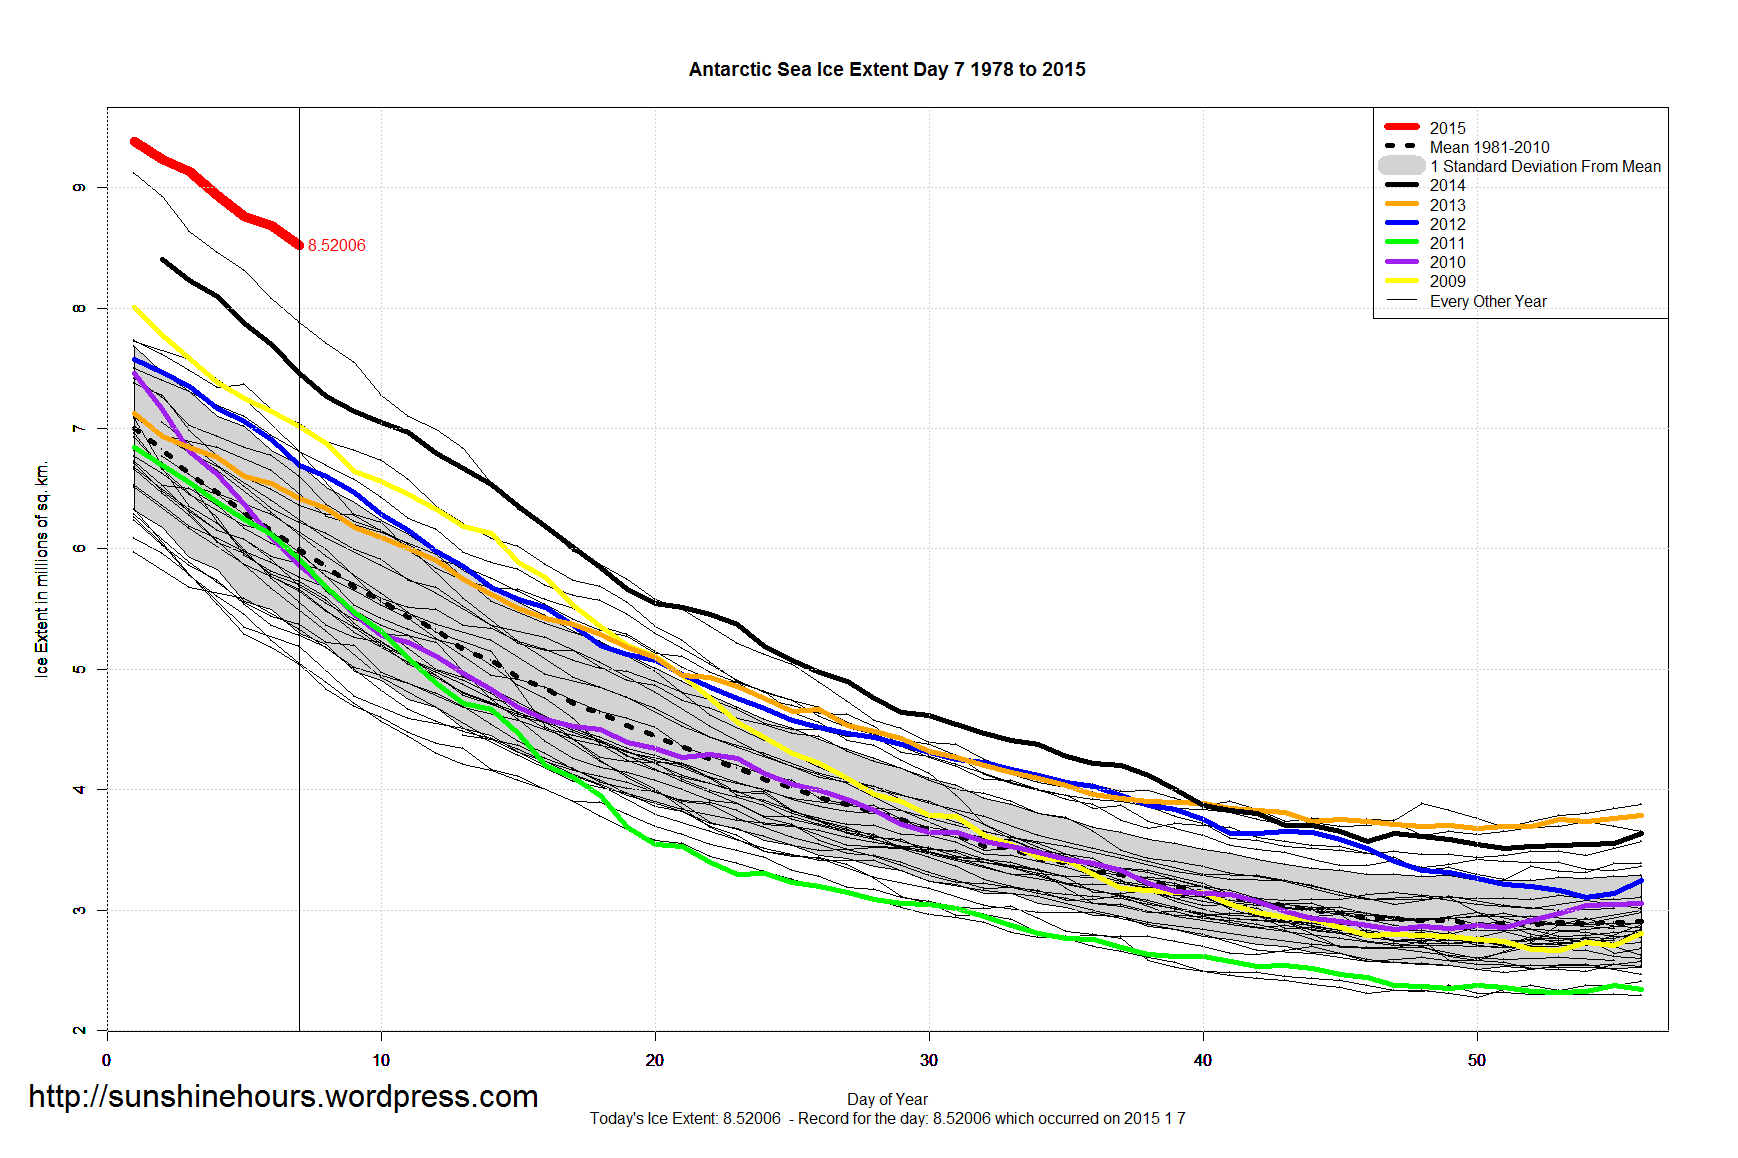
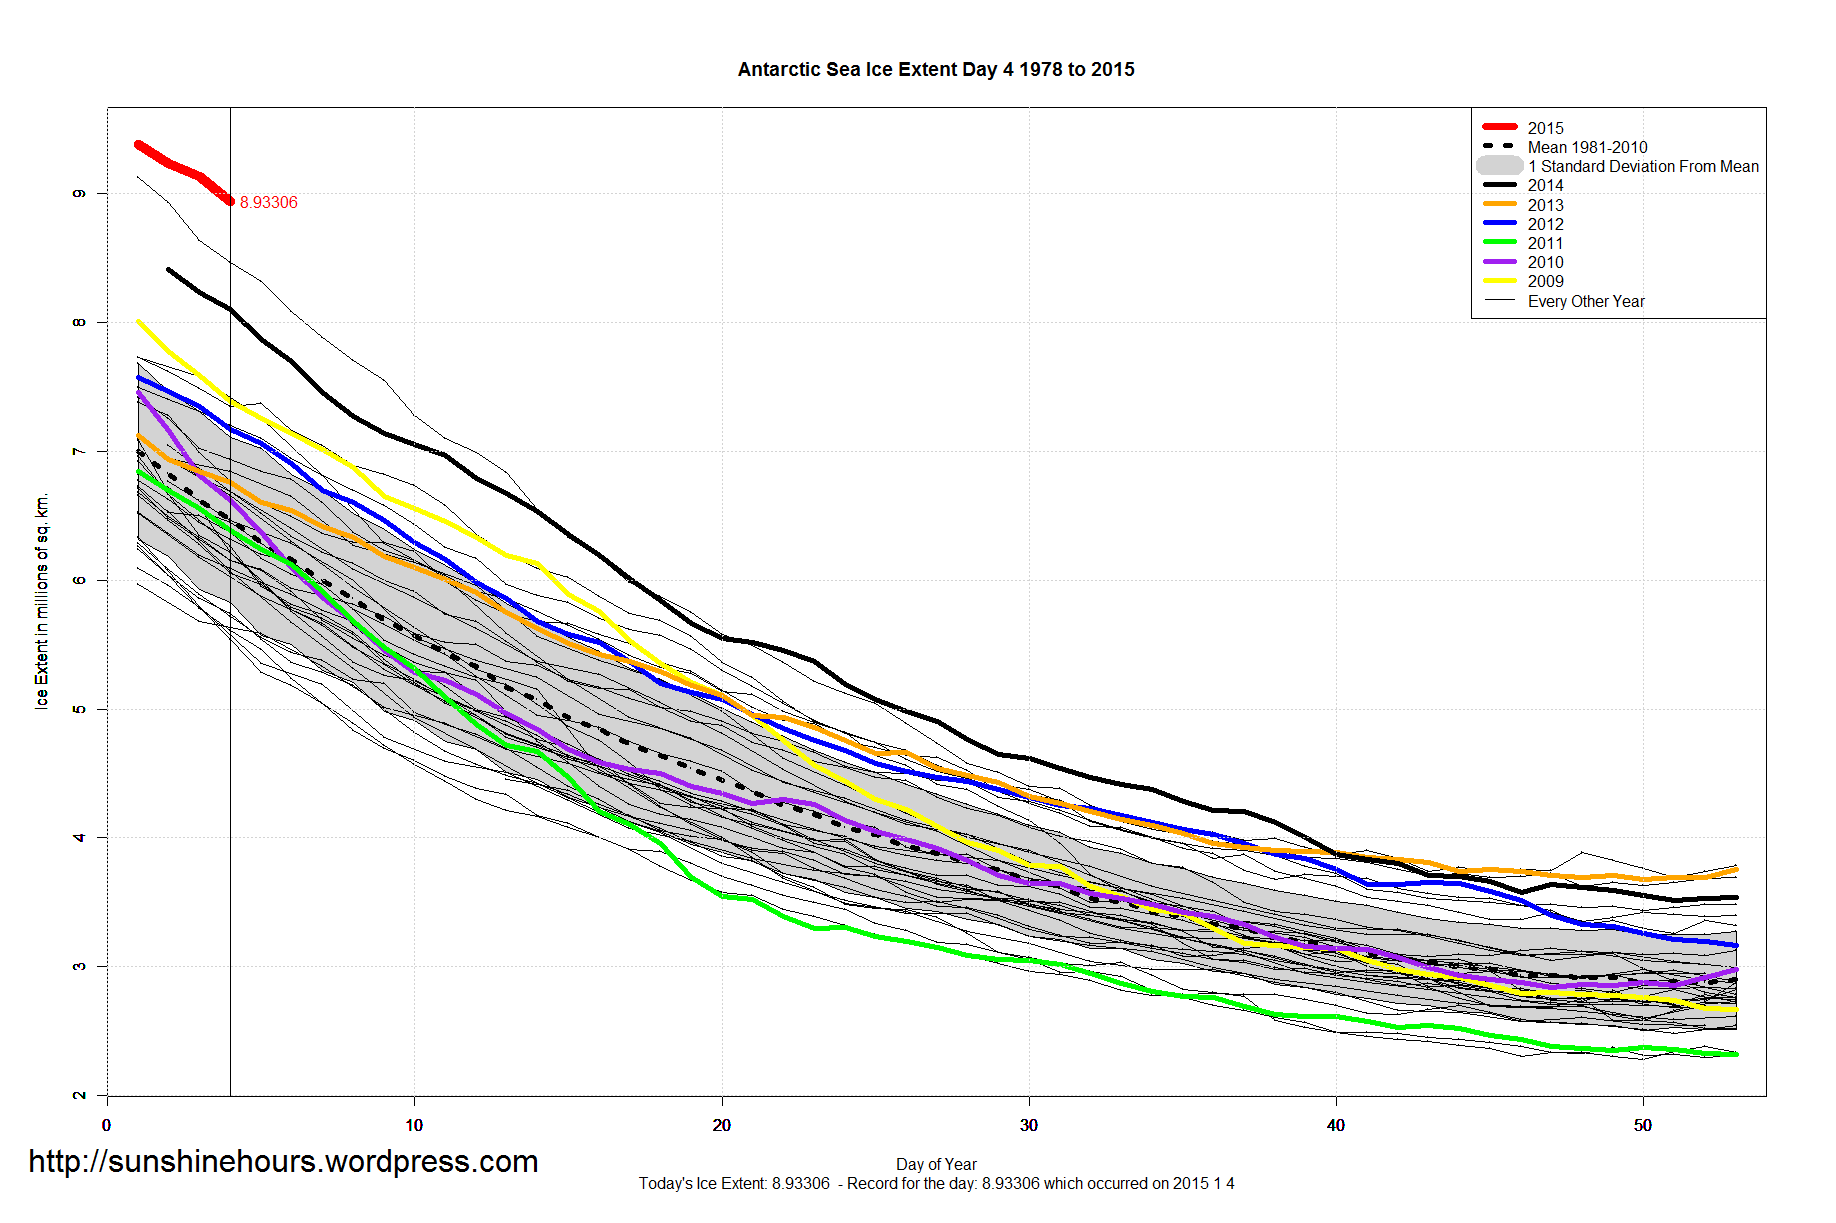
In Antarctica Sea Ice Extent has been setting record after record. It is mid summer and as of today there is 9.2 million sq km of sea ice.
That is 3.4 million sq km more than in 1980.
The albedo implications (which are only discussed by “scientists” in relation to the arctic) are important.
The following info is from a post I did in 2012 and is worth reposting (just remember it was from September 2012):
What is the impact of more Antarctic Sea Ice? Many warmists claim that less Arctic Sea Ice will have a more dramatic effect on earth’s albedo than increasing Antarctic Sea Ice.
Poster RACookPE1978 at WUWT disagrees and I hope he does not mind me reblogging his comment here.
“The Antarctic Sea Ice at its 16.5 million km^2 maximum near the equinox in mid-September is a near crown-shape: A circular ring whose edge is between 62 south and 60 south latitude. During its mid-winter GROWTH range – that period BEFORE its maximum extent when its will reflect the most solar energy – it will have about 50% of its area between 66.5 south (the Antarctic Circle) and 60 south latitude.
Now, at that latitude, EVEN AT MID NH SUMMER (darkest time of the year for the Antarctic continent in mid-winter) the Antarctic sea ice WILL be reflecting light energy … for the simple reason that the Antarctic sea ice is exposed to southern hemisphere sunlight every day – even at the shortest day if the winter at June 22.
BUT … Antarctic Sea Ice is NOT at its maximum at mid-winter (the darkest days), but rather, Antarctic Sea Ice is at its maximum at the equinox when there IS sunlight for 12 hours per every latitude on the planet. Further, Antarctic Sea Ice at its maximum IS exposed to strongly absorbed sunlight at solar incidence angle between 15 and 30 degrees for 10 of those 12 hours. Worse, from a cooling world standpoint, a DECREASE in Arctic Sea ice from its present “circular cap” up between 81 north latitude and the pole DOES NOT result in increased solar absorption into the exposed sea surface, but rather an increased LOSS of heat energy from the exposed water due to evaporation and radiation.
The difference? The angle of the incidence sunlight. In the Antarctic, the light is inbound on the newly freezing sea ice at 30 degrees angle: At 30-25 degrees incidence angle, open water absorbs 90-95% of the inbound energy, sea ice reflects about 98 percent of the incident energy.
in the Arctic, at 4-8 degrees incidence angle, open (rough) water reflects 95% of the solar energy. Ice reflects about 98% of the incoming solar energy. Open water loses another 117 watts/m^2 compared to ice-covered water.
Thus, “simple” physics and geography shows that an increase in Antarctic Sea by 1.5 million km^2 ABOVE its previous “average” of 15.0 million km^2 SIGNIFICANTLY increases heat loss from the planet. An (potential) loss even of the entire remaining sea ice of 3.4 million km^2 increases heat loss from the planet.
And NO IPCC report nor ANY climate model predicts ANY increase in Antarctic sea ice at the same time as a Arctic Sea Ice decline. They only predict sea ice declines due to “a warming world” and “prove” a warming world by that same sea ice decline.”
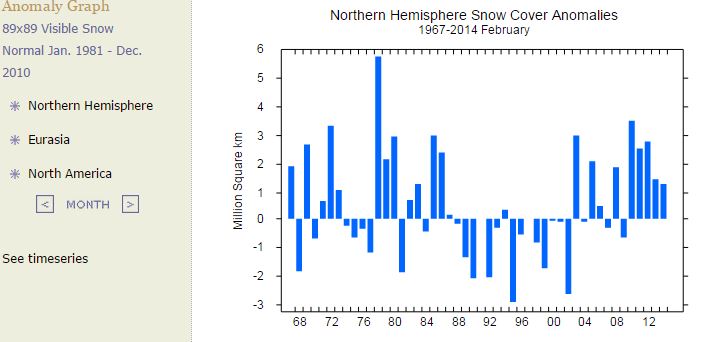
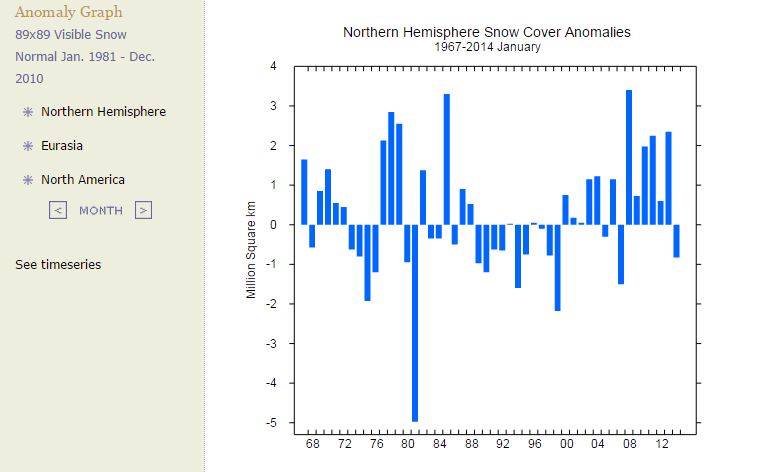
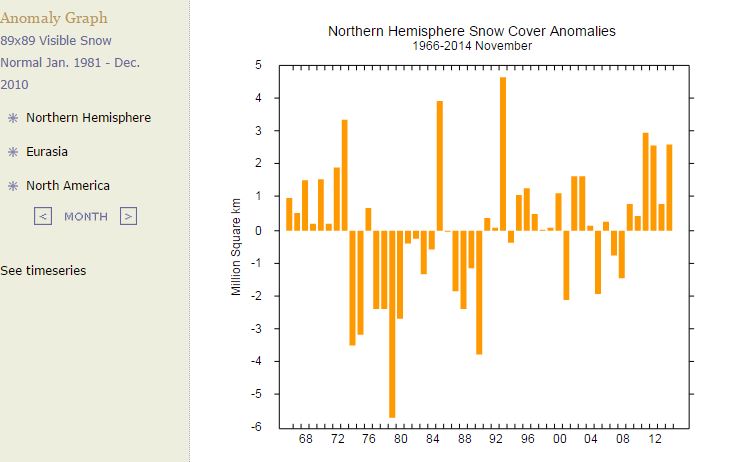
Appell: Are you going to acknowledge that the decline in northern hemisphere snow cover is also real
No. It goes up and down. It is up now.

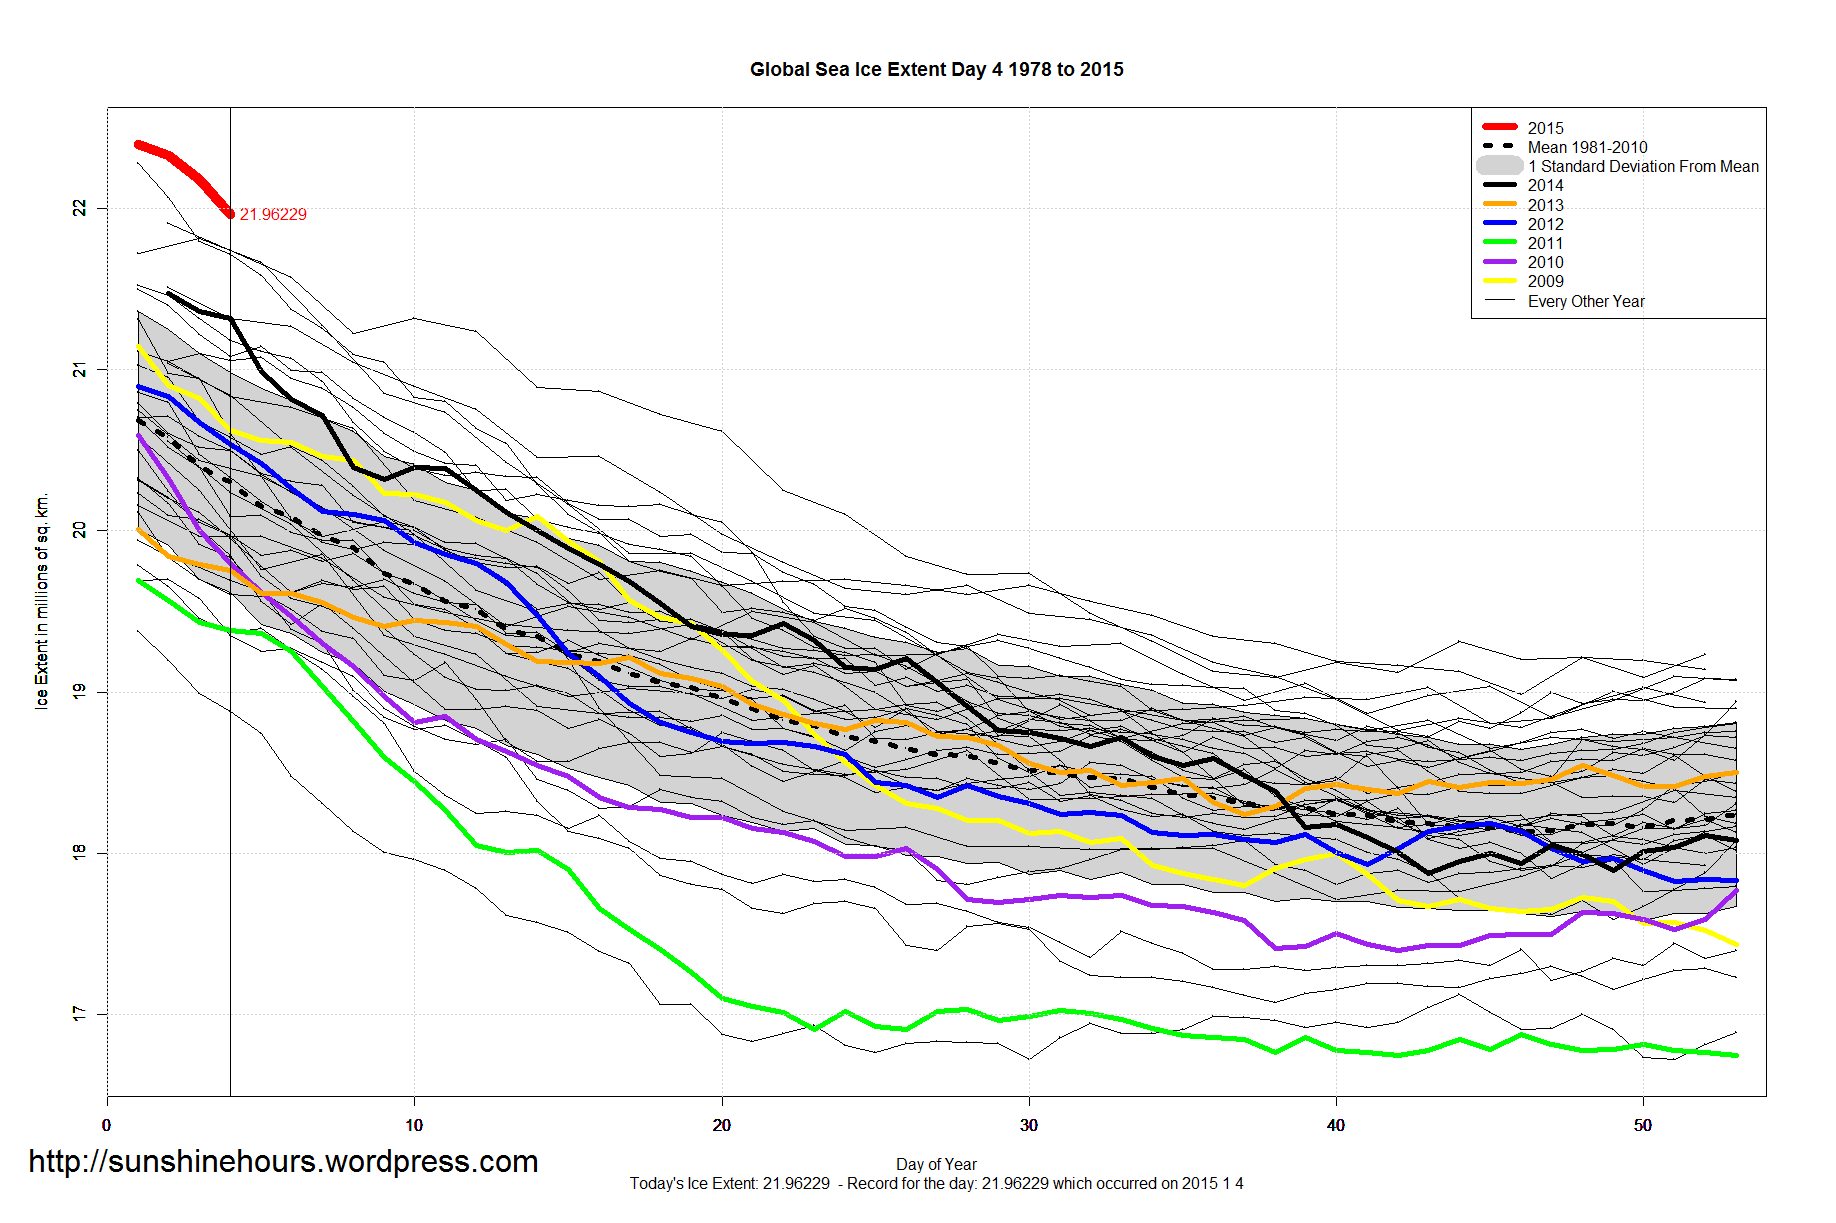
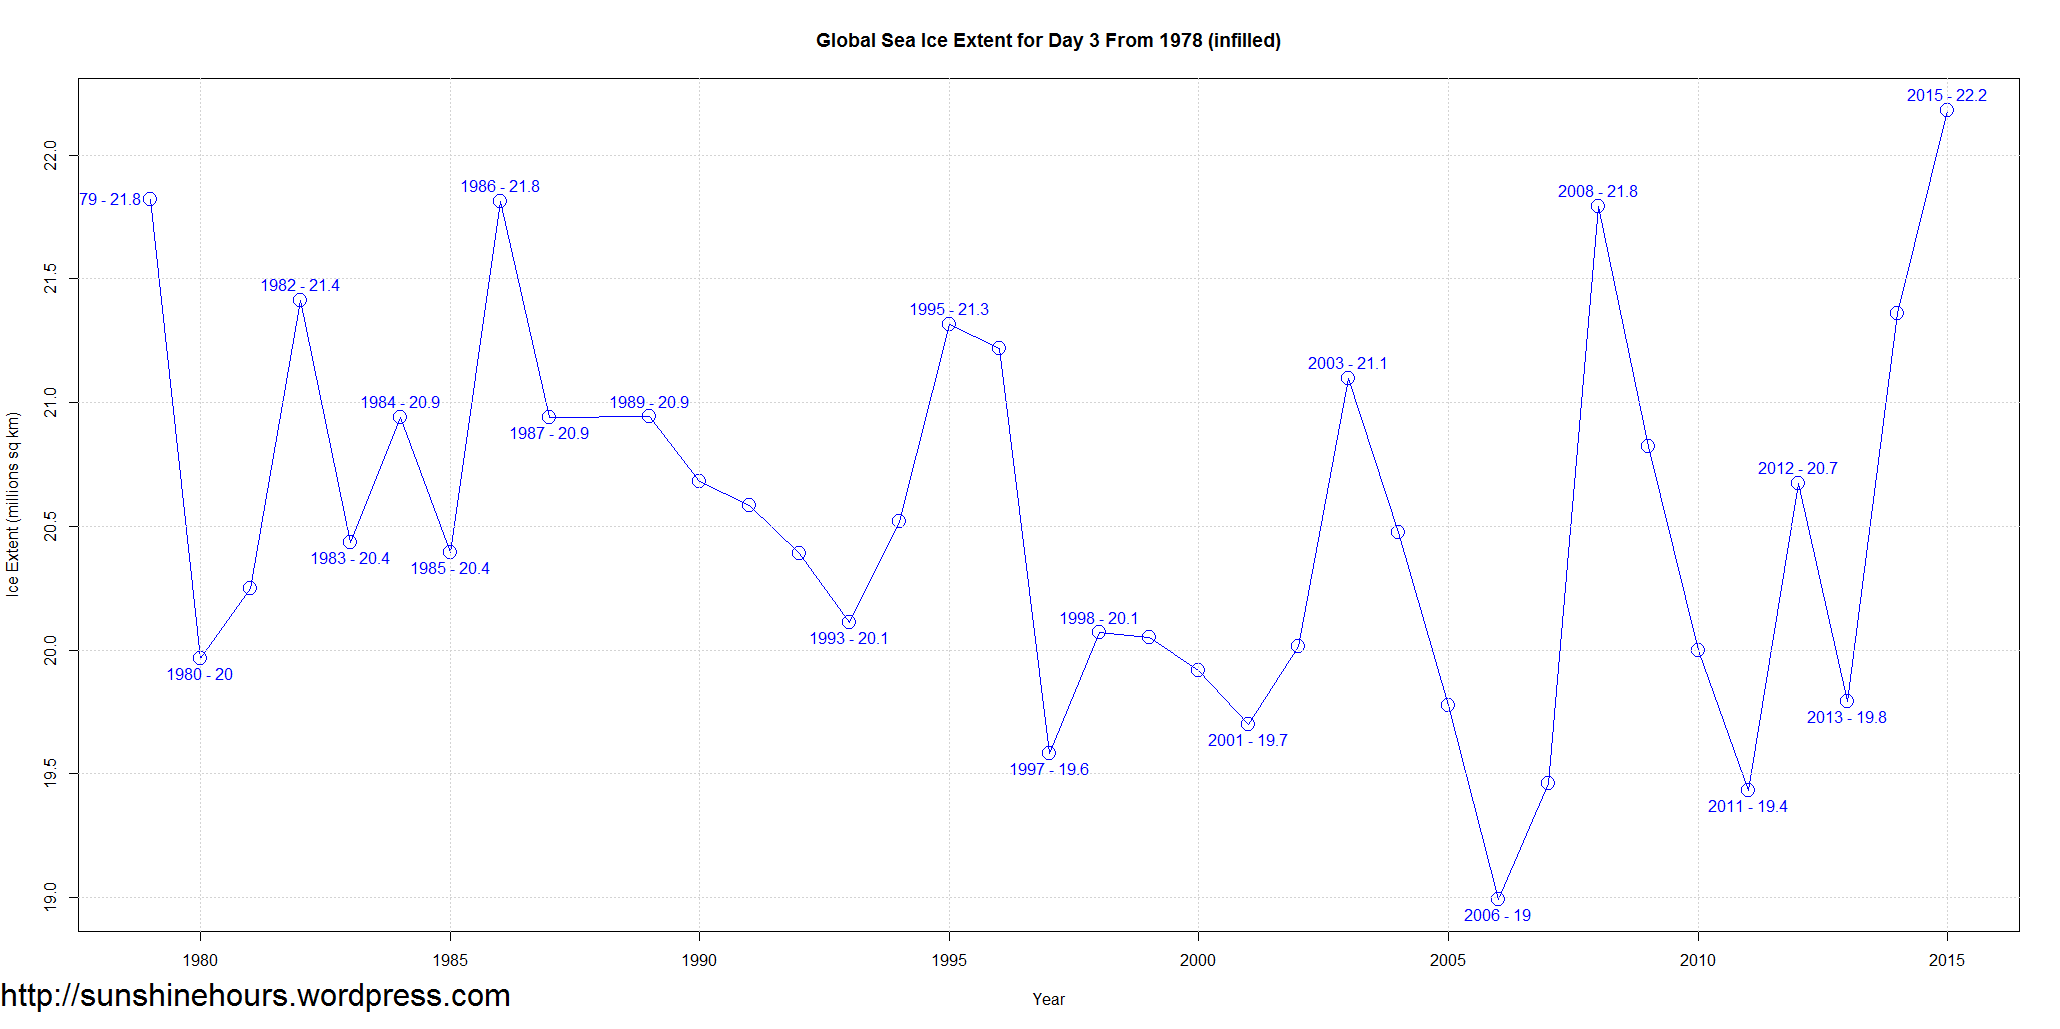
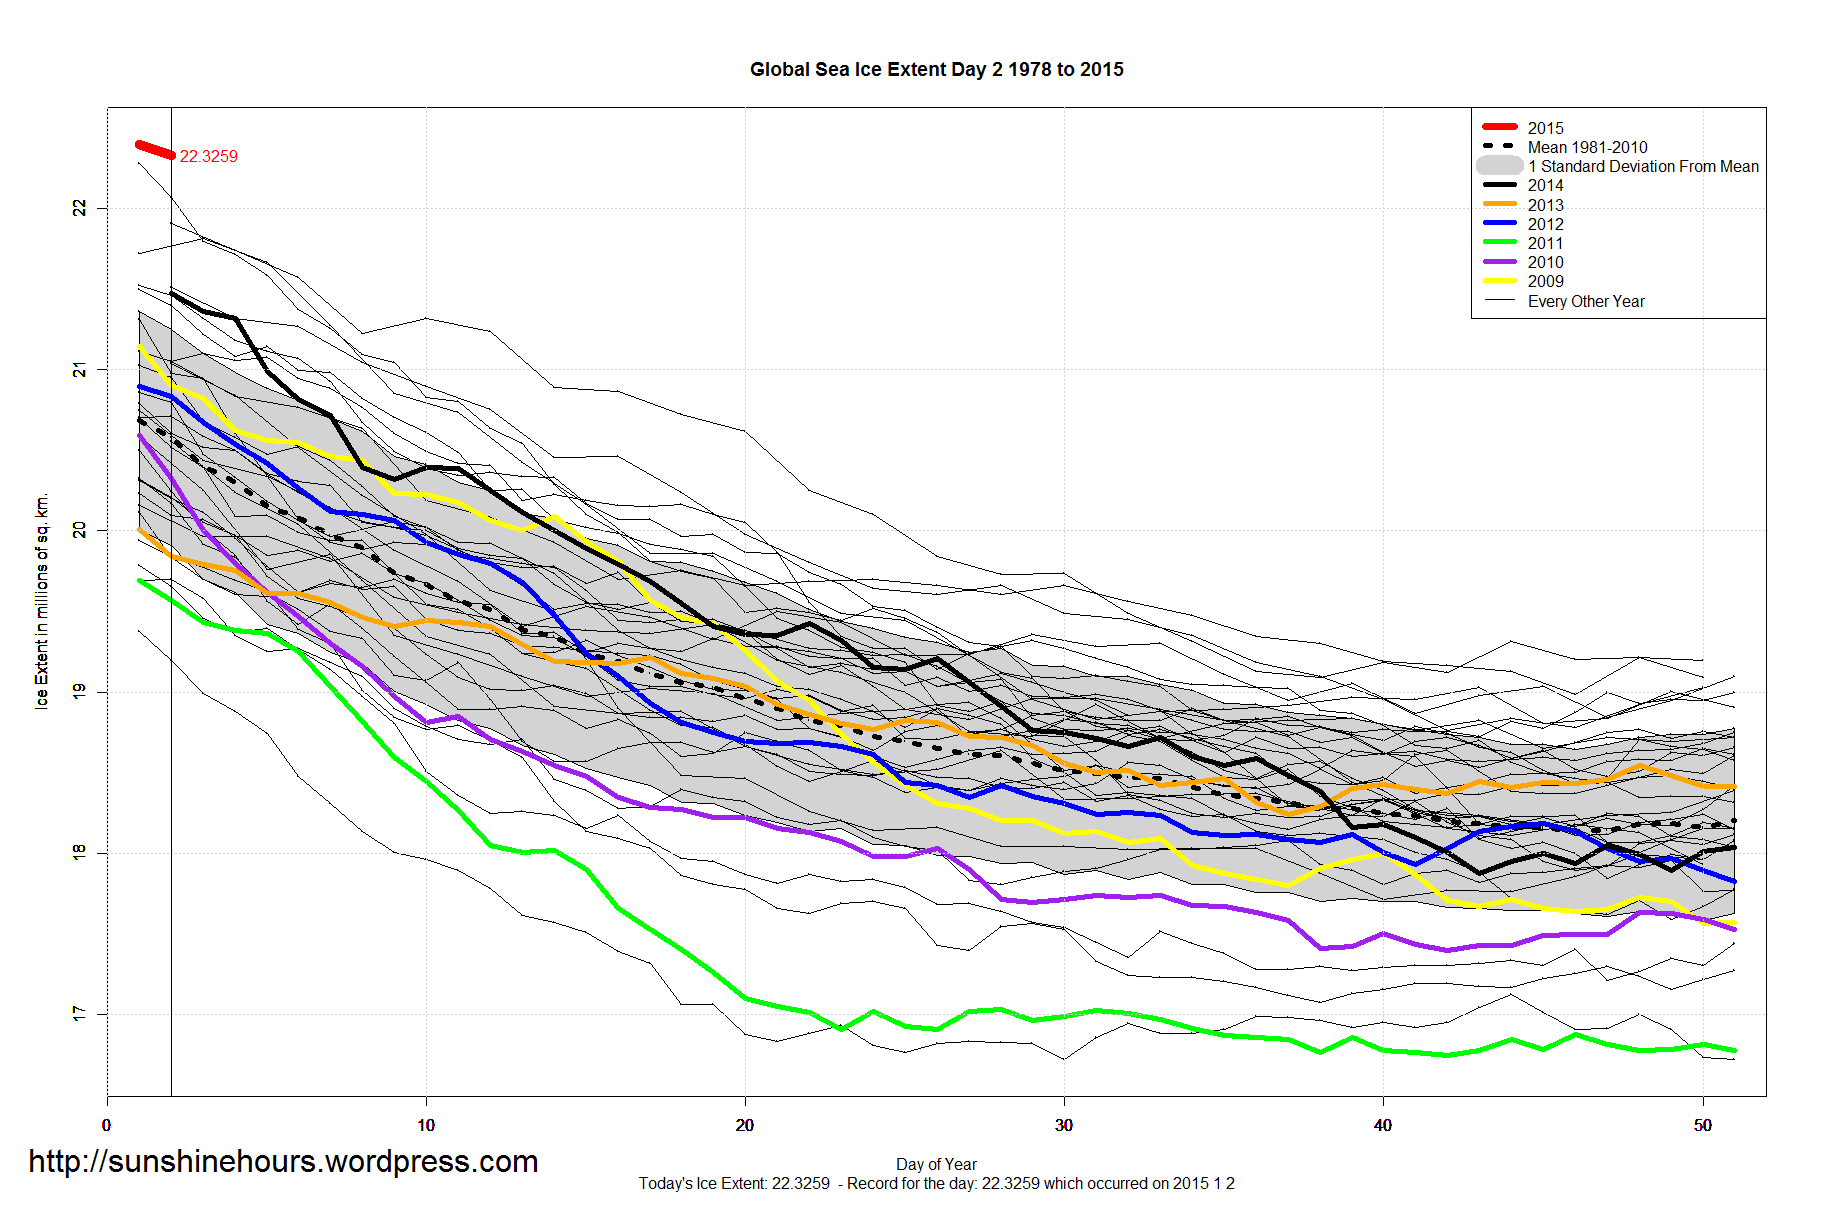
Why is global sea ice so high even when Arctic is not? Simple. Antarctic Sea Ice is AMAZINGLY high.
Global Sea Ice Extent Jan 03 2015 – 1,747,000 sq km above Normal
Antarctic Sea Ice Extent Jan 03 2015 – 2,409,000 sq km above Normal
Arctic Sea Ice Extent Jan 03 2015 – -663,000 sq km below Normal


Antarctic Sea Ice Extent in 2014 was amazing.
210 daily records. 349 out of 365 days were in the top 5.
And now there are no longer any daily records from before 2007.
| Year | First | Second | Third | Fourth | Fifth | Top 5 |
| 2014 | 210 | 63 | 29 | 41 | 6 | 349 |
| 2008 | 57 | 73 | 26 | 30 | 20 | 206 |
| 2013 | 49 | 134 | 87 | 47 | 12 | 329 |
| 2010 | 31 | 67 | 35 | 23 | 14 | 170 |
| 2007 | 17 | 4 | 0 | 2 | 3 | 26 |
| 2015 | 2 | 0 | 0 | 0 | 0 | 2 |
| 1979 | 0 | 2 | 10 | 14 | 8 | 34 |
| 1980 | 0 | 0 | 3 | 6 | 5 | 14 |
| 1981 | 0 | 0 | 1 | 1 | 4 | 6 |
| 1982 | 0 | 0 | 2 | 10 | 9 | 21 |
| 1984 | 0 | 0 | 0 | 3 | 3 | 6 |
| 1985 | 0 | 0 | 3 | 2 | 7 | 12 |
| 1986 | 0 | 0 | 0 | 1 | 3 | 4 |
| 1988 | 0 | 1 | 0 | 0 | 13 | 14 |
| 1994 | 0 | 0 | 0 | 12 | 15 | 27 |
| 1995 | 0 | 0 | 3 | 7 | 29 | 39 |
| 1996 | 0 | 0 | 19 | 7 | 17 | 43 |
| 1998 | 0 | 0 | 8 | 13 | 11 | 32 |
| 1999 | 0 | 0 | 0 | 0 | 2 | 2 |
| 2000 | 0 | 4 | 2 | 17 | 21 | 44 |
| 2001 | 0 | 0 | 14 | 11 | 13 | 38 |
| 2003 | 0 | 1 | 24 | 27 | 47 | 99 |
| 2004 | 0 | 0 | 7 | 3 | 19 | 29 |
| 2005 | 0 | 3 | 6 | 17 | 9 | 35 |
| 2006 | 0 | 1 | 30 | 28 | 21 | 80 |
| 2009 | 0 | 6 | 33 | 33 | 33 | 105 |
| 2011 | 0 | 0 | 0 | 0 | 3 | 3 |
| 2012 | 0 | 7 | 24 | 11 | 19 | 61 |
The average anomaly for the year was -0.82 million sq km below the 1981-2010 mean.
Lowest Minimum 3.36973 2012
Highest Minimum 7.52476 1980
Lowest day of Minimum 245 1987
Highest day of Minimum 265 1989
Lowest Maximum 14.67084 2011
Highest Maximum 16.56457 1979
Lowest day of Maximum 52 1987
Highest day of Maximum 90 2010
| Year | Min | Max | day of Max | day of Min | Average Anomaly (million sq km) |
| 1979 | 6.89236 | 16.56457 | 60 | 264 | 0.69 |
| 1980 | 7.52476 | 16.25042 | 65 | 249 | 0.69 |
| 1981 | 6.88784 | 15.71365 | 73 | 253 | 0.49 |
| 1982 | 7.15423 | 16.27475 | 58 | 256 | 0.81 |
| 1983 | 7.19145 | 16.33207 | 73 | 251 | 0.69 |
| 1984 | 6.39916 | 15.76157 | 78 | 260 | 0.27 |
| 1985 | 6.4799 | 16.11716 | 76 | 250 | 0.35 |
| 1986 | 7.12351 | 16.11934 | 69 | 249 | 0.56 |
| 1987 | 6.89159 | 16.21724 | 52 | 245 | 0.62 |
| 1988 | 7.04905 | 16.24163 | 70 | 255 | 0.54 |
| 1989 | 6.88931 | 15.72295 | 65 | 265 | 0.33 |
| 1990 | 6.0191 | 16.21077 | 71 | 264 | 0.06 |
| 1991 | 6.26027 | 15.58803 | 56 | 259 | 0.12 |
| 1992 | 7.16324 | 15.53258 | 72 | 251 | 0.47 |
| 1993 | 6.15699 | 16.00491 | 72 | 249 | 0.29 |
| 1994 | 6.92645 | 15.72226 | 61 | 248 | 0.37 |
| 1995 | 5.98945 | 15.32238 | 59 | 252 | -0.22 |
| 1996 | 7.15283 | 15.42074 | 52 | 254 | 0.2 |
| 1997 | 6.61353 | 15.63647 | 79 | 246 | 0.03 |
| 1998 | 6.29922 | 16.02091 | 56 | 260 | 0.12 |
| 1999 | 5.68009 | 15.55755 | 89 | 255 | 0.06 |
| 2000 | 5.9442 | 15.44482 | 63 | 255 | -0.13 |
| 2001 | 6.56774 | 15.66664 | 63 | 262 | -0.04 |
| 2002 | 5.62456 | 15.57345 | 68 | 256 | -0.27 |
| 2003 | 5.97198 | 15.58678 | 80 | 260 | -0.24 |
| 2004 | 5.77608 | 15.25548 | 70 | 263 | -0.39 |
| 2005 | 5.31832 | 14.94615 | 71 | 265 | -0.73 |
| 2006 | 5.74877 | 14.73298 | 70 | 257 | -0.86 |
| 2007 | 4.1607 | 14.78963 | 69 | 257 | -1.15 |
| 2008 | 4.55469 | 15.30522 | 58 | 262 | -0.66 |
| 2009 | 5.05488 | 15.16275 | 61 | 255 | -0.7 |
| 2010 | 4.59918 | 15.28449 | 90 | 262 | -0.92 |
| 2011 | 4.33028 | 14.67084 | 66 | 251 | -1.15 |
| 2012 | 3.36973 | 15.25102 | 64 | 260 | -1.24 |
| 2013 | 5.07709 | 15.14275 | 73 | 256 | -0.74 |
| 2014 | 4.98339 | 14.96031 | 79 | 259 | -0.82 |