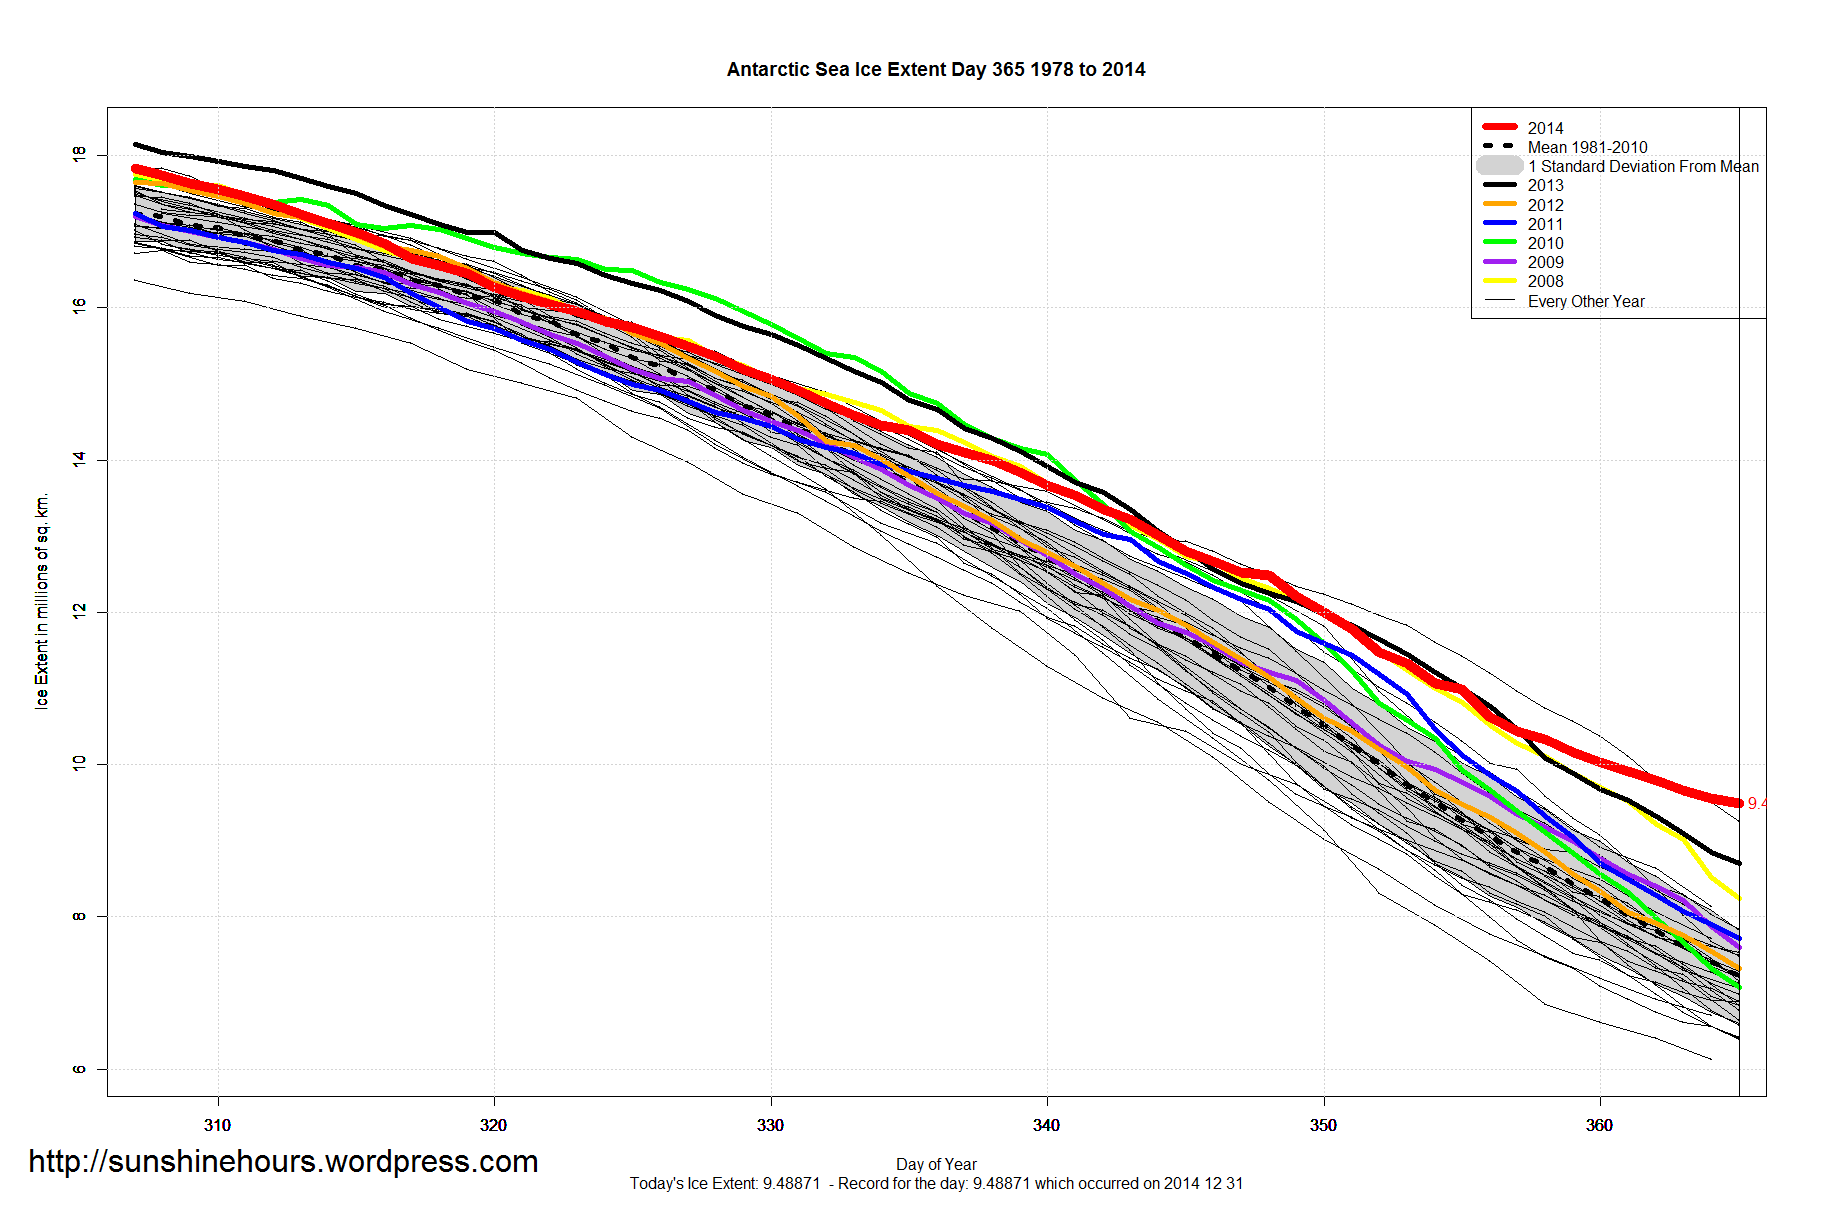
Amazing increase (for day 1) from 1997 – 6.1 million sq km to 9.4 million sq km.
54%


Global Sea Ice Extent averaged 0.34 million sq km above the 1981-2010 average.
Highest Average since 1998.
In terms of Max, 2014 was the 18th highest out of 36.
In terms of Min, 2014 was the 13th highest out of 36.
| Year | Min | Max | day of Max | day of Min | Avg Anomaly (million sq km) |
| 1979 | 19.09222 | 27.48859 | 176 | 38 | 0.79 |
| 1980 | 18.5996 | 28.11968 | 289 | 57 | 0.37 |
| 1981 | 18.18091 | 27.48105 | 291 | 45 | 0.35 |
| 1982 | 18.76482 | 27.83626 | 306 | 42 | 0.85 |
| 1983 | 18.84029 | 27.89772 | 307 | 47 | 0.5 |
| 1984 | 17.71544 | 27.18759 | 316 | 40 | 0.13 |
| 1985 | 17.92867 | 27.61347 | 306 | 50 | 0.37 |
| 1986 | 18.80319 | 27.00445 | 317 | 45 | 0.08 |
| 1987 | 18.98408 | 27.15319 | 317 | 46 | 0.46 |
| 1988 | 18.15105 | 27.88244 | 319 | 45 | 0.46 |
| 1989 | 18.00758 | 27.50341 | 299 | 48 | 0.17 |
| 1990 | 18.3706 | 27.36396 | 294 | 45 | -0.12 |
| 1991 | 17.96976 | 27.05178 | 309 | 63 | 0.07 |
| 1992 | 17.95822 | 27.58992 | 322 | 60 | 0.29 |
| 1993 | 17.84281 | 27.99757 | 310 | 57 | 0.12 |
| 1994 | 18.57179 | 27.97479 | 309 | 43 | 0.56 |
| 1995 | 18.49688 | 27.11473 | 306 | 45 | -0.01 |
| 1996 | 17.79264 | 27.46173 | 293 | 57 | 0.39 |
| 1997 | 17.65372 | 27.04273 | 310 | 57 | -0.17 |
| 1998 | 18.47935 | 27.58827 | 297 | 47 | 0.27 |
| 1999 | 17.94246 | 27.58386 | 306 | 62 | 0.23 |
| 2000 | 17.5882 | 26.93691 | 302 | 49 | 0.04 |
| 2001 | 18.52515 | 26.75864 | 319 | 38 | 0.05 |
| 2002 | 18.08847 | 26.81604 | 297 | 55 | -0.64 |
| 2003 | 18.72494 | 27.09882 | 306 | 43 | 0.14 |
| 2004 | 18.31746 | 27.09686 | 316 | 51 | -0.01 |
| 2005 | 17.07721 | 27.37923 | 308 | 38 | -0.62 |
| 2006 | 16.7209 | 27.09882 | 298 | 30 | -0.99 |
| 2007 | 17.21196 | 26.24784 | 308 | 47 | -1.05 |
| 2008 | 18.43071 | 27.30686 | 310 | 46 | 0 |
| 2009 | 17.43751 | 26.17157 | 303 | 53 | -0.24 |
| 2010 | 17.39862 | 26.71555 | 313 | 42 | -0.4 |
| 2011 | 16.74368 | 26.17913 | 307 | 42 | -1.24 |
| 2012 | 17.82476 | 25.90133 | 313 | 51 | -0.81 |
| 2013 | 18.23868 | 27.49155 | 306 | 37 | 0.2 |
| 2014 | 17.87416 | 27.35877 | 307 | 43 | 0.34 |
In Antarctica Sea Ice Extent set an all time record of 20.14215 million sq km.
The average anomaly for the year was 1.09 million sq km above the 1981-2010 mean – the highest ever.
| Year | Min | Max | day of Max | day of Min | Avg Anomaly |
| 1979 | 2.91521 | 18.36699 | 256 | 48 | 0.04 |
| 1980 | 2.52686 | 19.09137 | 267 | 57 | -0.39 |
| 1981 | 2.69524 | 18.85906 | 261 | 51 | -0.21 |
| 1982 | 2.8927 | 18.55004 | 246 | 52 | -0.02 |
| 1983 | 2.84656 | 18.81042 | 263 | 55 | -0.25 |
| 1984 | 2.38292 | 18.37747 | 266 | 58 | -0.2 |
| 1985 | 2.60211 | 18.93215 | 254 | 50 | -0.04 |
| 1986 | 2.95395 | 18.02672 | 261 | 65 | -0.55 |
| 1987 | 3.01642 | 18.52332 | 258 | 52 | -0.24 |
| 1988 | 2.63862 | 18.78456 | 277 | 55 | -0.14 |
| 1989 | 2.7229 | 18.27368 | 266 | 51 | -0.23 |
| 1990 | 2.78435 | 18.3788 | 273 | 53 | -0.24 |
| 1991 | 2.55355 | 18.66993 | 273 | 58 | -0.11 |
| 1992 | 2.49238 | 18.4663 | 255 | 54 | -0.24 |
| 1993 | 2.28078 | 18.709 | 263 | 50 | -0.23 |
| 1994 | 3.08286 | 18.8266 | 243 | 43 | 0.12 |
| 1995 | 3.32988 | 18.7353 | 269 | 55 | 0.15 |
| 1996 | 2.59733 | 18.83039 | 267 | 56 | 0.13 |
| 1997 | 2.26415 | 18.79094 | 265 | 58 | -0.26 |
| 1998 | 2.7715 | 19.2433 | 258 | 56 | 0.08 |
| 1999 | 2.70723 | 18.98068 | 273 | 51 | 0.11 |
| 2000 | 2.58248 | 19.15817 | 272 | 49 | 0.11 |
| 2001 | 3.44094 | 18.49324 | 271 | 50 | 0.02 |
| 2002 | 2.69691 | 18.11556 | 252 | 51 | -0.43 |
| 2003 | 3.6257 | 18.67907 | 268 | 48 | 0.32 |
| 2004 | 3.25927 | 19.12341 | 252 | 51 | 0.32 |
| 2005 | 2.80387 | 19.29451 | 272 | 49 | 0.04 |
| 2006 | 2.4866 | 19.35934 | 264 | 51 | -0.19 |
| 2007 | 2.7227 | 19.08545 | 272 | 50 | 0.03 |
| 2008 | 3.69176 | 18.29726 | 247 | 51 | 0.6 |
| 2009 | 2.67096 | 19.29864 | 267 | 53 | 0.39 |
| 2010 | 2.8422 | 18.9968 | 249 | 47 | 0.45 |
| 2011 | 2.31884 | 18.95328 | 266 | 53 | -0.15 |
| 2012 | 3.11109 | 19.47713 | 266 | 54 | 0.36 |
| 2013 | 3.67897 | 19.60692 | 274 | 50 | 0.87 |
| 2014 | 3.51506 | 20.14215 | 263 | 51 | 1.09 |
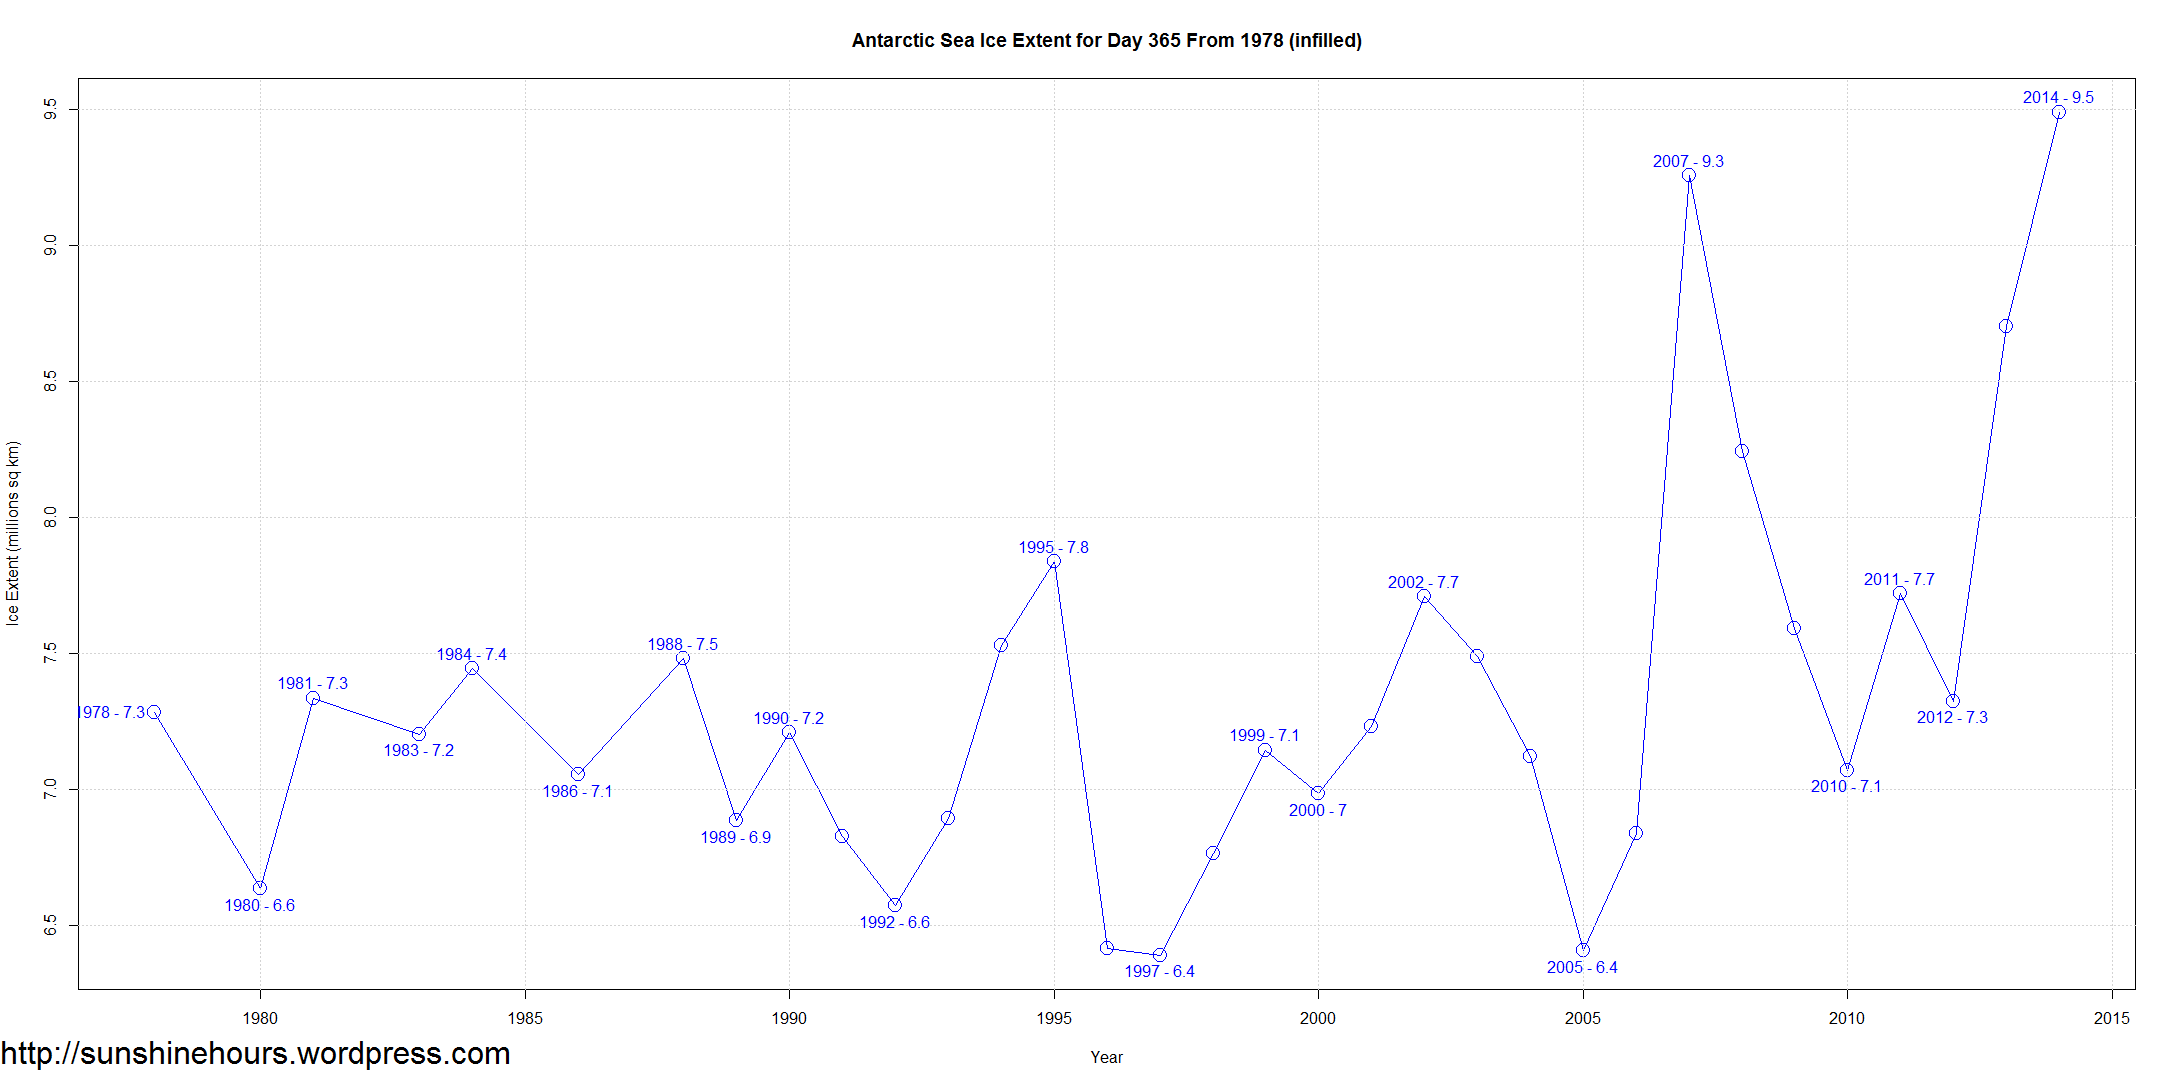
The increase in Antarctic Sea Ice Extent For Day 365 is pretty extraordinary. 3,000,000 sq km higher than 2005.
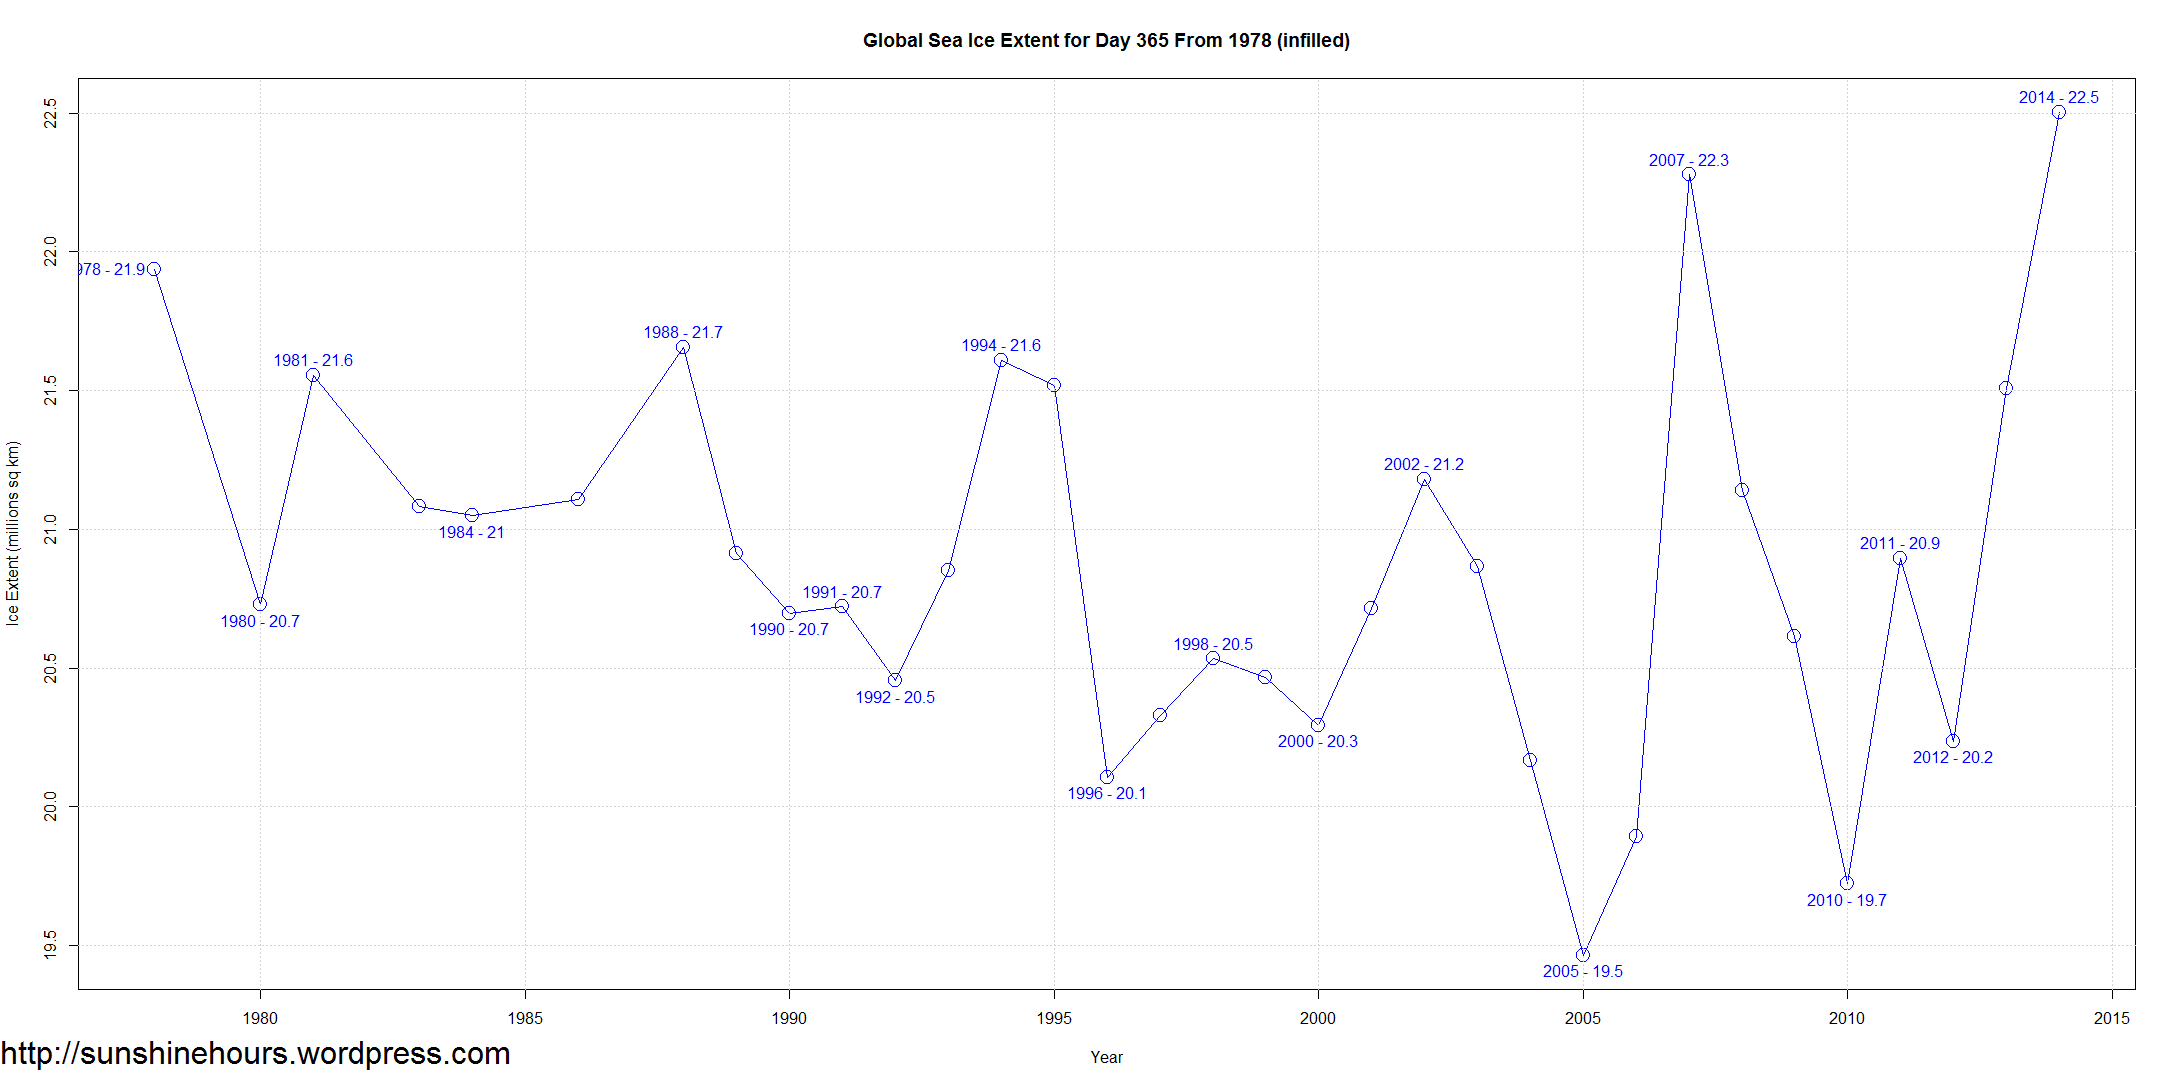
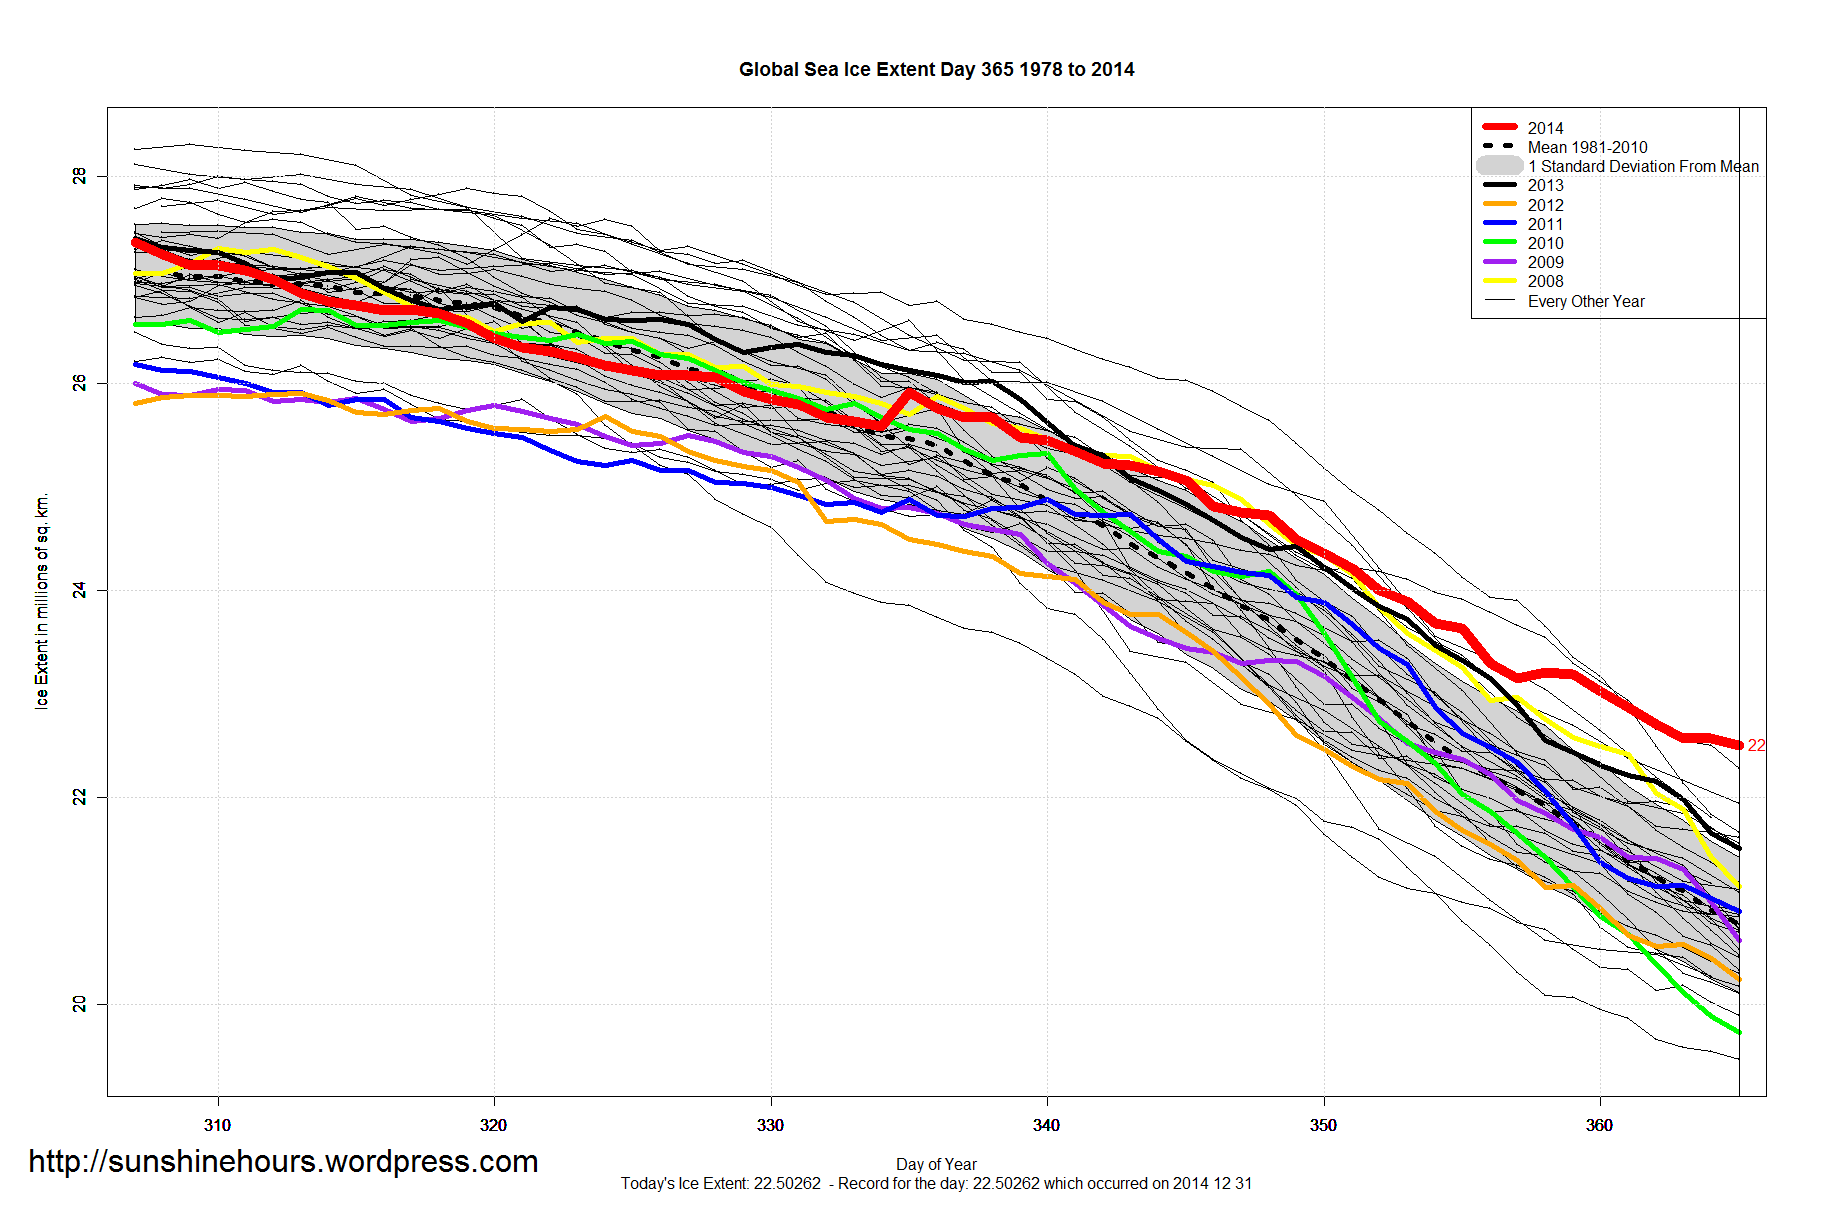
Which results in a record for Global Sea Ice Extent for day 365