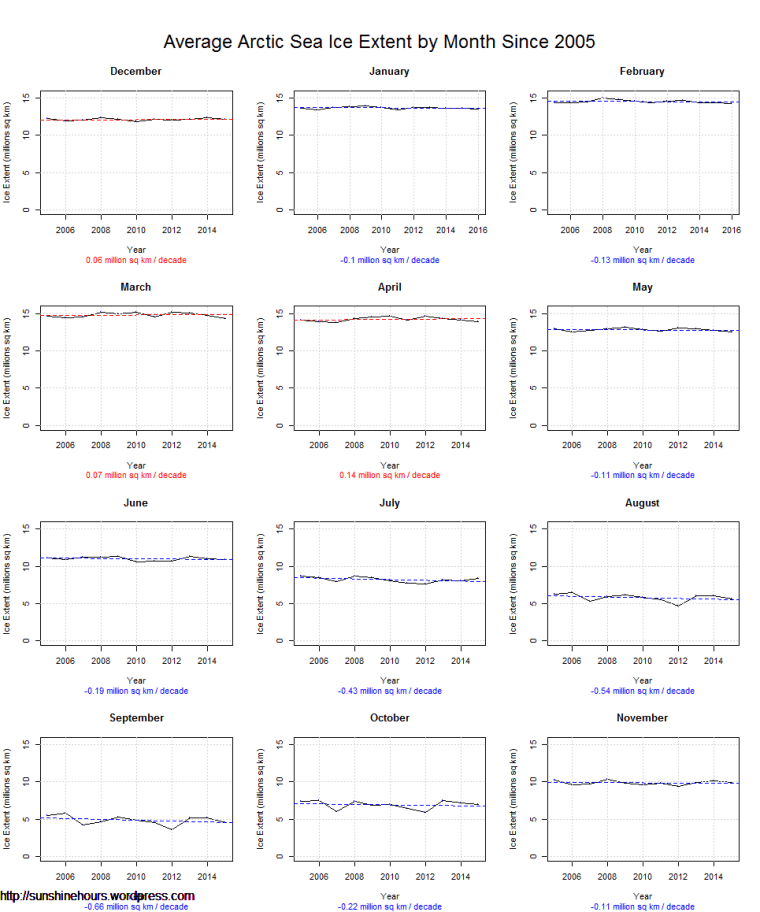
Arctic Sea Ice Extent Since 2005 With 0 Shown on Y Axis Published on March 29, 2016March 29, 2016 by sunshinehours1 Arctic Sea Ice Extent By Month from 2005 with 0 shown on the Y axis. Red line shows an increasing ice trend. Does this look like doom for the Arctic to you? The latest South / North Share this: Share on X (Opens in new window) X Share on Facebook (Opens in new window) Facebook Like Loading... Related
You chose 2005 on purpose. Short-term cherry-picking doesn’t count. Blog Owner: 10 years isn’t cherry picking. There are cycles. They change. Around 2005 arctic sea ice change leveled out. Reply

You chose 2005 on purpose. Short-term cherry-picking doesn’t count.
Blog Owner: 10 years isn’t cherry picking. There are cycles. They change. Around 2005 arctic sea ice change leveled out.