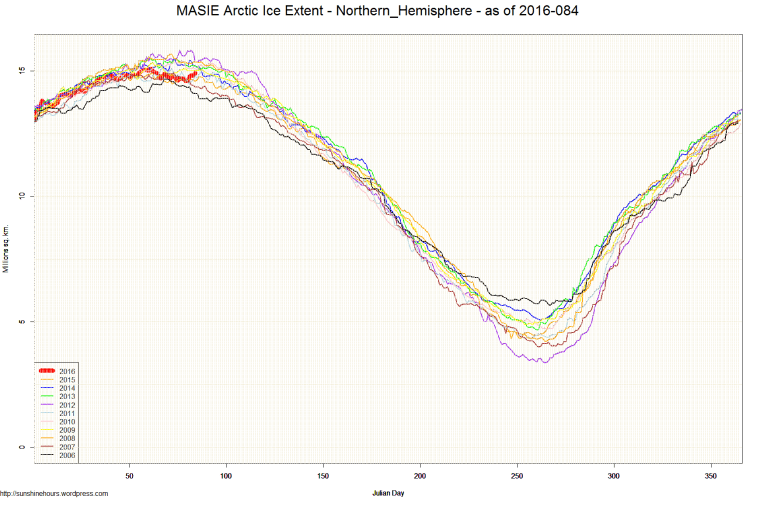
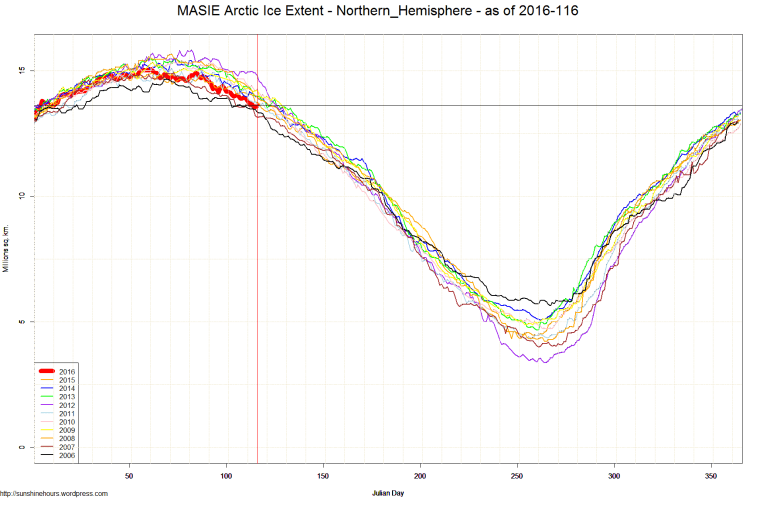
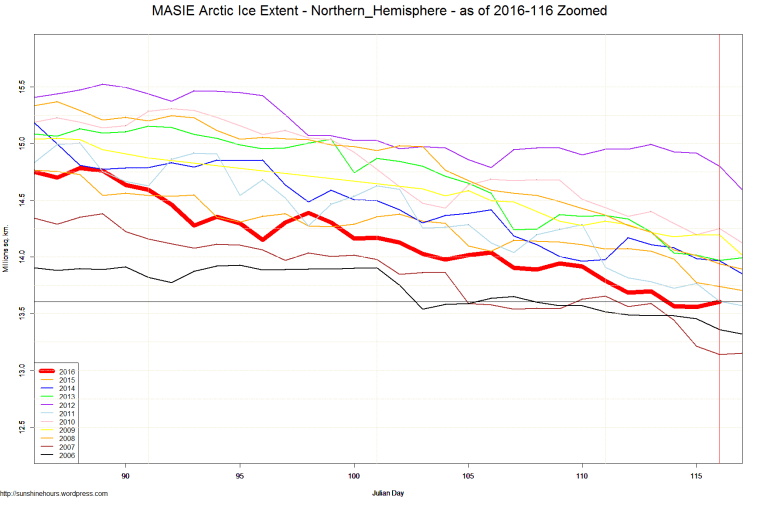
The usual NSIDC data is broken. So I’ll be posting MASIE Arctic data (as well as JAXA). MASIE only goes back to 2006.
MASIE and NSIDC are two different sea ice indexes. The difference between the two methodologies is here.
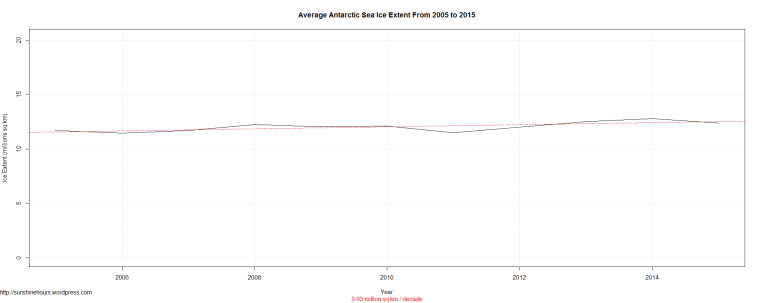
Antarctic is increasing at +0.93 million sq km per decade
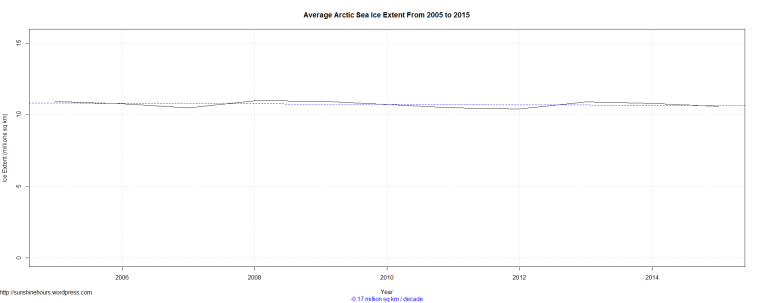
Arctic is decreasing at -0.17 million sq km per decade
MASIE and NSIDC are two different sea ice indexes. The difference between the two methodologies is here.
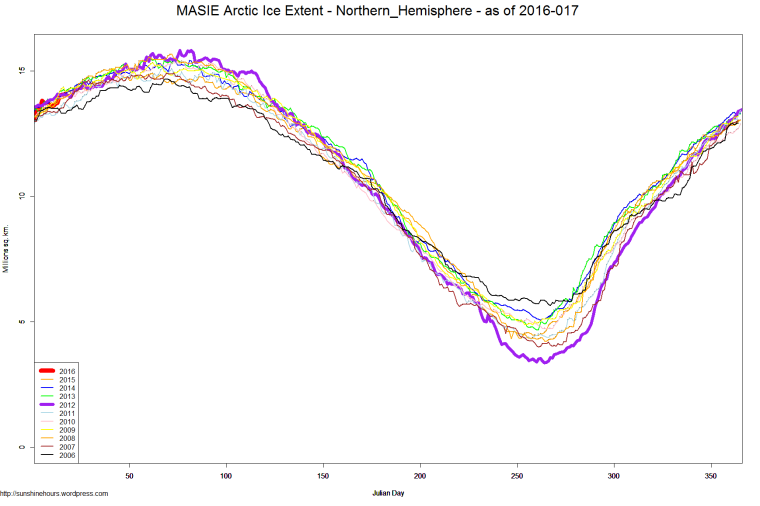
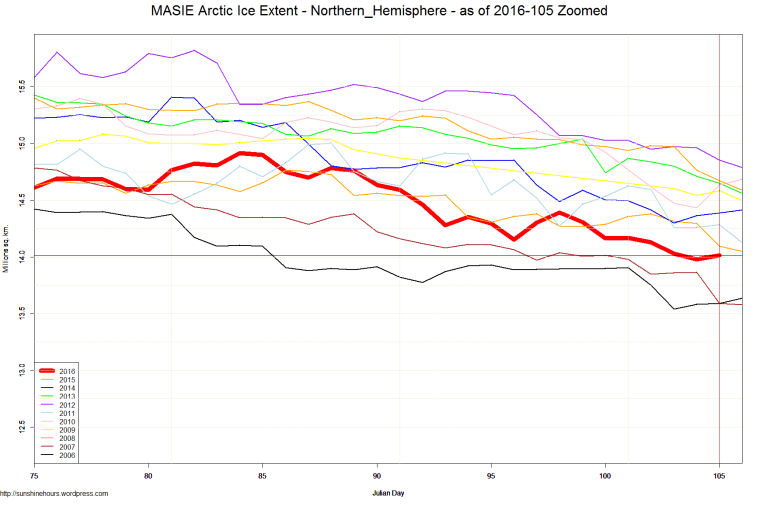
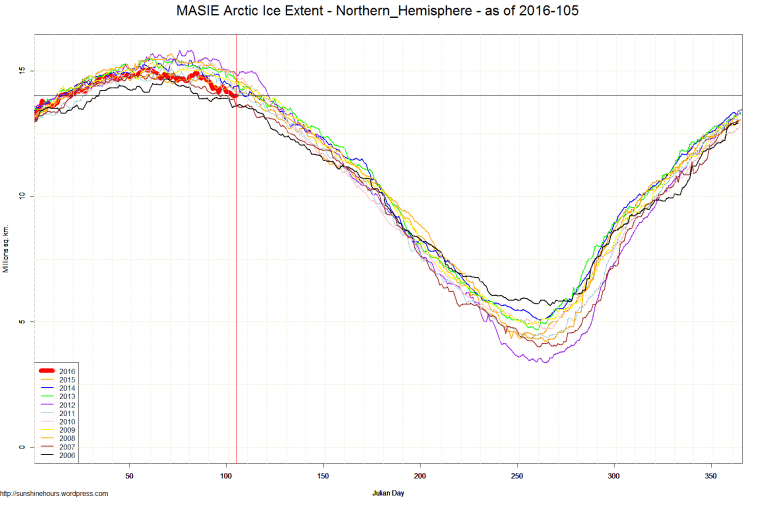
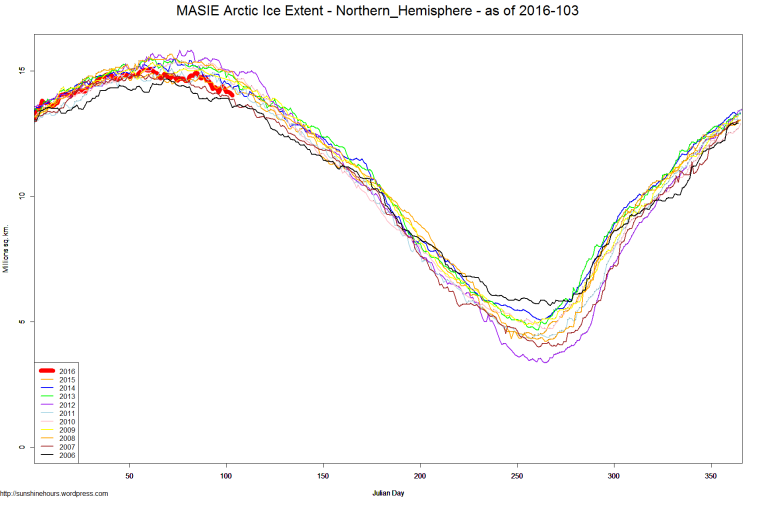
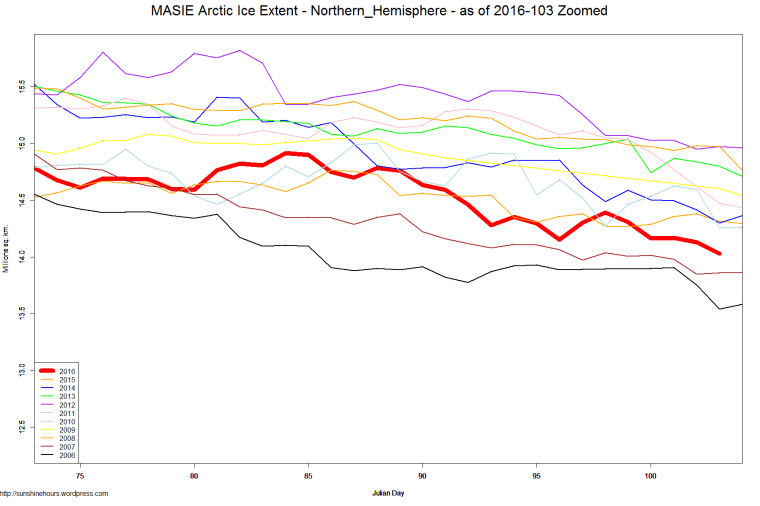
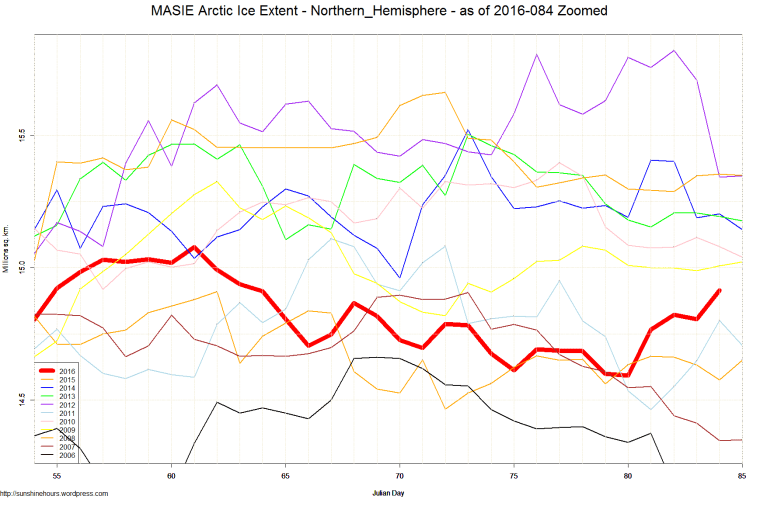
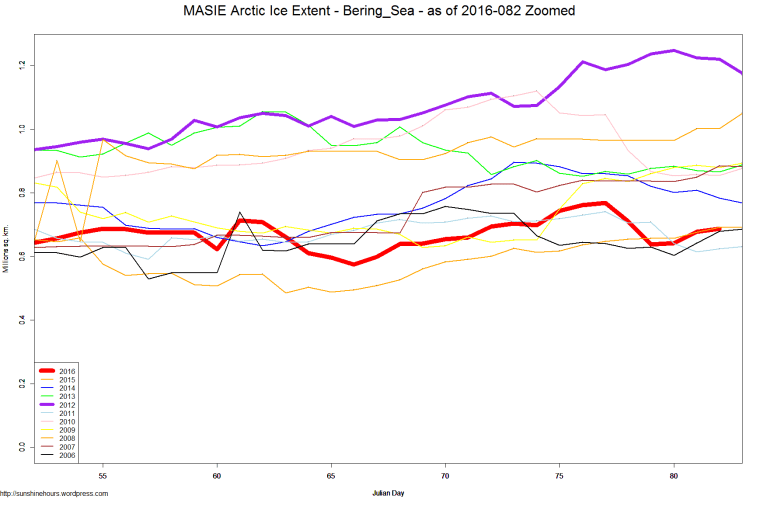
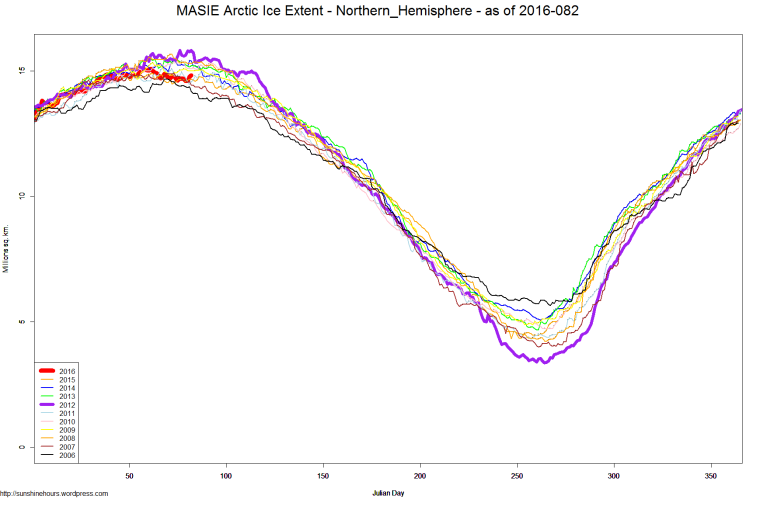
Right now MASIE is running about 1,000,000 sq km lower than 2012. The Bering Sea region is running over 500,000 sq km lower than 2012.
2012 was the highest MASIE maximum (data only goes back to 2006) and also the lowest minimum in the summer.
MASIE and NSIDC are two different sea ice indexes. The difference between the two methodologies is here.
Ron Clutz reminded me that MASIE’s records are different than NSIDC. (MASIE data is only back to 2006)
The only record 2016 holds (so far) is earliest maximum. 2016 has the 4th lowest maximum behind 2006, 2007 and 2015.
MASIE records:
Lowest Minimum 3368882.08 2012
Highest Minimum 5640540.95 2006
Lowest day of Minimum 254 2009
Highest day of Minimum 267 2006
Lowest Maximum 14663037.37 2006
Highest Maximum 15821891.32 2012
Lowest day of Maximum 61 2016
Highest day of Maximum 82 2012
| Year | Min | Max | day of Max | day of Min |
| 2006 | 5640540.95 | 14663037.37 | 69 | 267 |
| 2007 | 3986945.93 | 14907125.15 | 73 | 261 |
| 2008 | 4223400.12 | 15661926.25 | 72 | 265 |
| 2009 | 4871392.35 | 15326130.68 | 62 | 254 |
| 2010 | 4716943.6 | 15396877.99 | 77 | 266 |
| 2011 | 4302977.96 | 15110021.96 | 67 | 257 |
| 2012 | 3368882.08 | 15821891.32 | 82 | 264 |
| 2013 | 4677324.53 | 15505010.03 | 73 | 260 |
| 2014 | 5066134.38 | 15523208.18 | 73 | 262 |
| 2015 | 4442258.23 | 14910198.98 | 62 | 260 |
| 2016 | 15077599.37 | 61 |
I explained the difference between MASIE and NSIDC here.
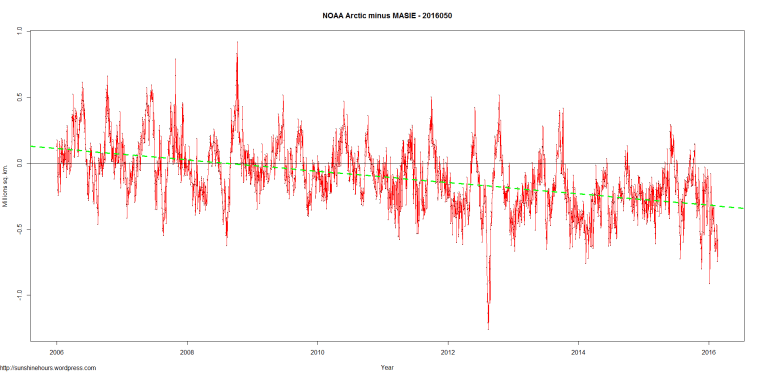
I still don’t understand why the divergence over time is in one direction only.
The latest graph (showing that as time has passed NOAA’s data is showing less and less ice compared to MASIE) is below.
MASIE and NSIDC are two different sea ice indexes. The difference between the two methodologies is here.
“MASIE relies on data from the Interactive Multisensor Snow and Ice Mapping System (IMS) that runs at the National Ice Center (NIC). The IMS product uses several satellite data sources including passive microwave, but it is also based on visual analysis and other data sources and undergoes a form of manual data fusion.”
“The Sea Ice Index (SII) relies on satellite passive microwave data as its only data source. These data are automatically processed using an algorithm and have known biases and limitations;”
Ron Clutz made a comment here that had me thinking what was the difference between the two methodologies over time? The comparison starts in 2006 because that is the oldest MASIE data available.The value being graphed is the NSIDC SII value minus the MASIE value.
As you can see … once upon a time the NSIDC SII was generally higher than MASIE. Now MASIE is generally higher.
What does it mean? I don’t know.

MASIE is running about 400,000 sq km above the NSIDC Sea Ice Index.
MASIE = 14.08 million sq km
NSIDC = 13.605 million sq km