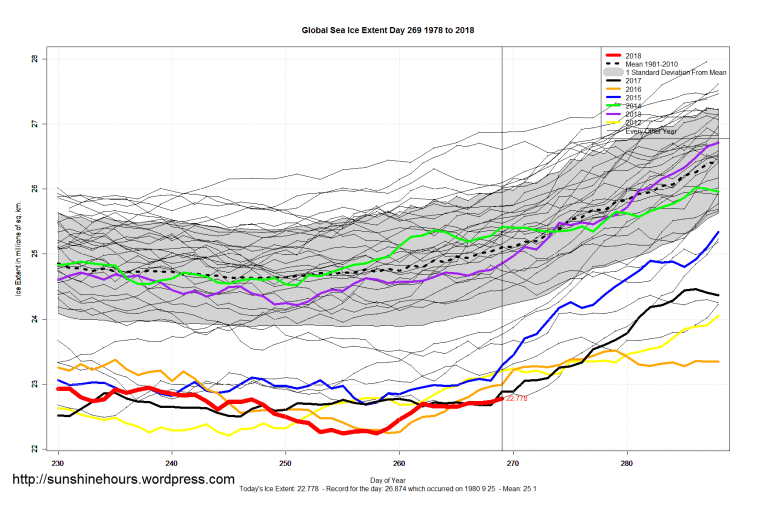
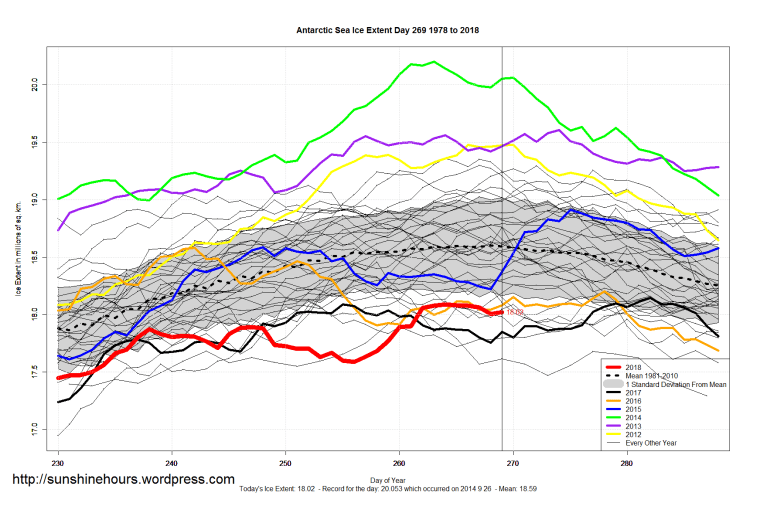
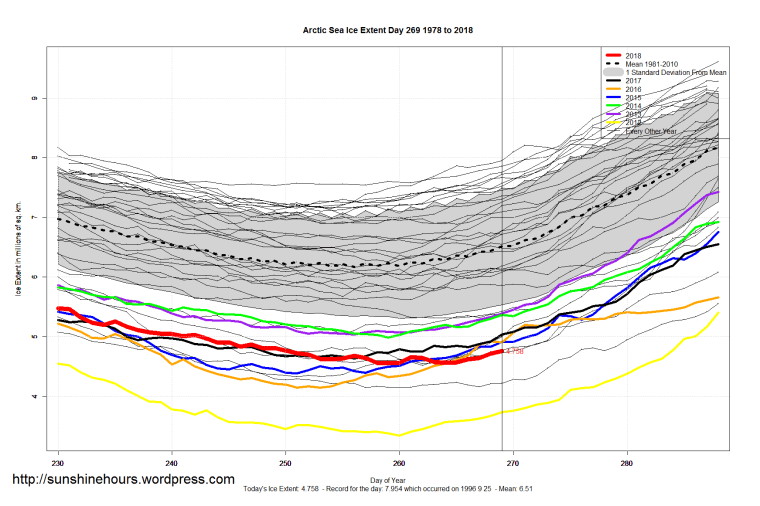
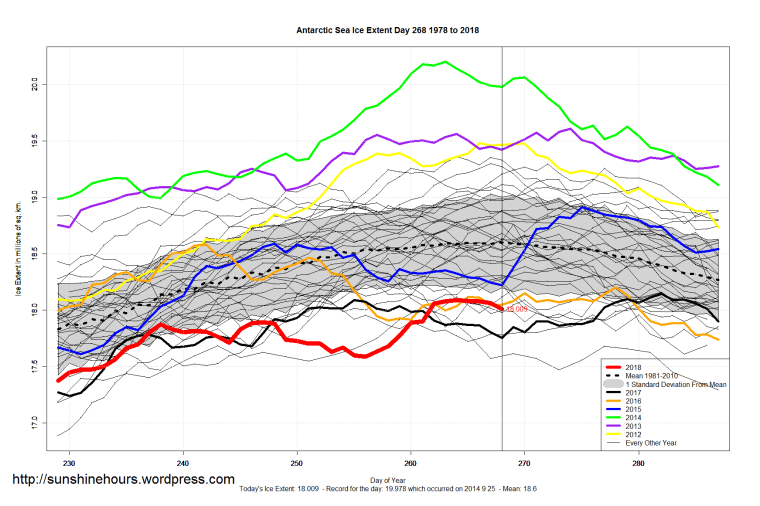
Sea Ice Extent (Global Antarctic and Arctic) – Day 268 – 2018
I think we can call the Arctic minimum. 2018 is the 7th lowest minimum. 2012 is still the lowest by far.
   Year   Min    Max dMax dMin
1  2012 3.340 15.307   78  260
2  2016 4.145 14.566   82  251
3  2007 4.147 14.842   69  257
4  2011 4.333 14.704   66  251
5  2015 4.387 14.554   53  251
6  2008 4.548 15.354   58  262
7  2018 4.553 14.504   73  259


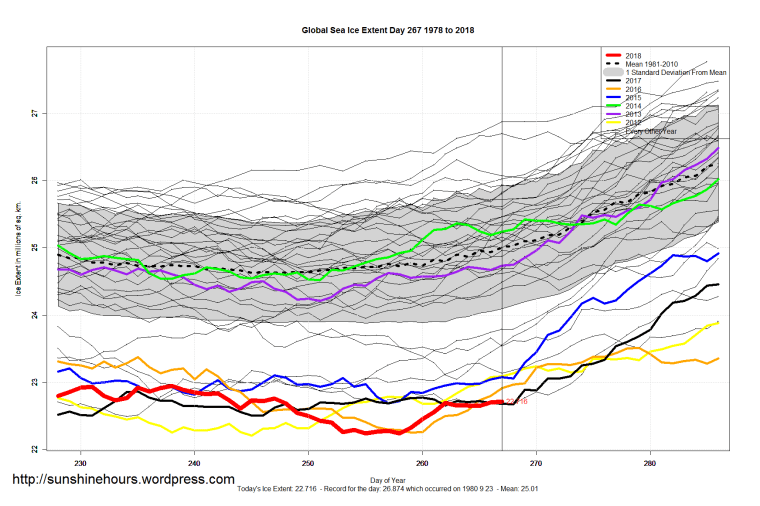
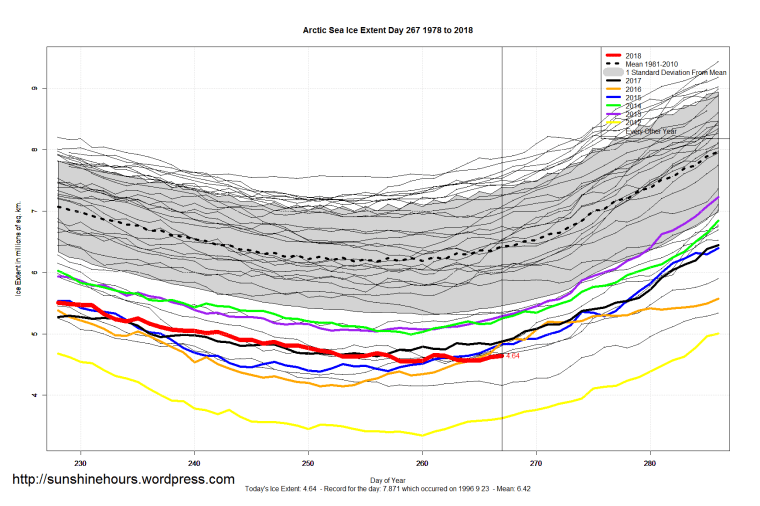
Sea Ice Extent (Global Antarctic and Arctic) – Day 267 – 2018
Arcitc is still on track for 2018 to be the 7th lowest minimum. 2012 is still the lowest by far.
   Year   Min    Max dMax dMin
1  2012 3.340 15.307   78  260
2  2016 4.145 14.566   82  251
3  2007 4.147 14.842   69  257
4  2011 4.333 14.704   66  251
5  2015 4.387 14.554   53  251
6  2008 4.548 15.354   58  262
7  2018 4.553 14.504   73  259

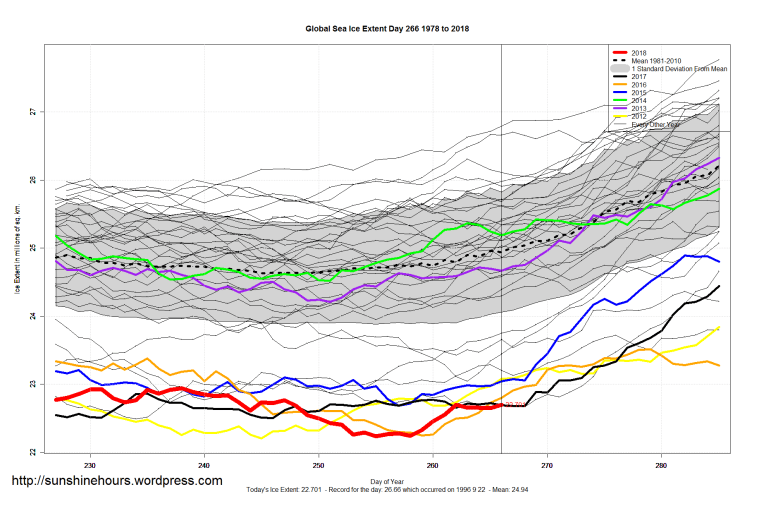
Sea Ice Extent (Global Antarctic and Arctic) – Day 266 – 2018


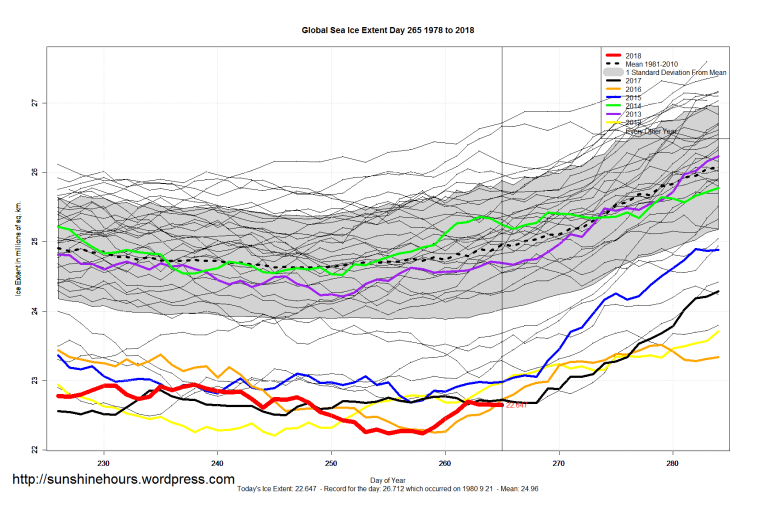
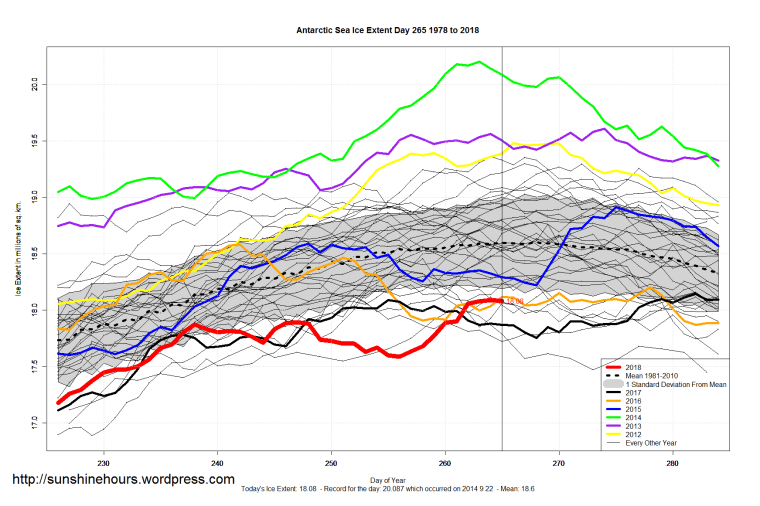
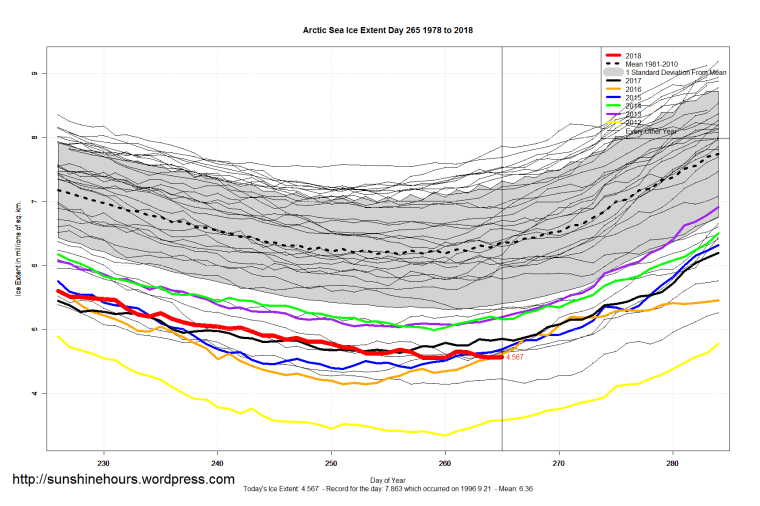
Sea Ice Extent (Global Antarctic and Arctic) – Day 265 – 2018
Roadways lined with solar panels may not be as promising as hoped, first studies show
When you come up with a dumb idea and call it green …
“Four years ago a viral campaign wooed the world with a promise of fighting climate change and jump-starting the economy by replacing tarmac on the world’s roads with solar panels. The bold idea has undergone some road testing since then.
The first results from preliminary studies have recently come out, and they’re a bit underwhelming.
A solar panel lying under a road is at a number of disadvantages.
As it’s not at the optimum tilt angle, it’s going to produce less power and it’s going to be more prone to shading, which is a problem as shade over just 5% of the surface of a panel can reduce power generation by 50%.”
“The panels are also likely to be covered by dirt and dust, and would need far thicker glass than conventional panels to withstand the weight of traffic, which will further limit the light they absorb.
Unable to benefit from air circulation, its inevitable these panels will heat up more than a rooftop solar panel too. For every 1°C over optimum temperature you lose 0.5% of energy efficiency.
As a result a significant drop in performance for a solar road, compared to rooftop solar panels, has to be expected. The question is by how much and what is the economic cost?”

Sea Ice Extent (Global Antarctic and Arctic) – Day 264 – 2018


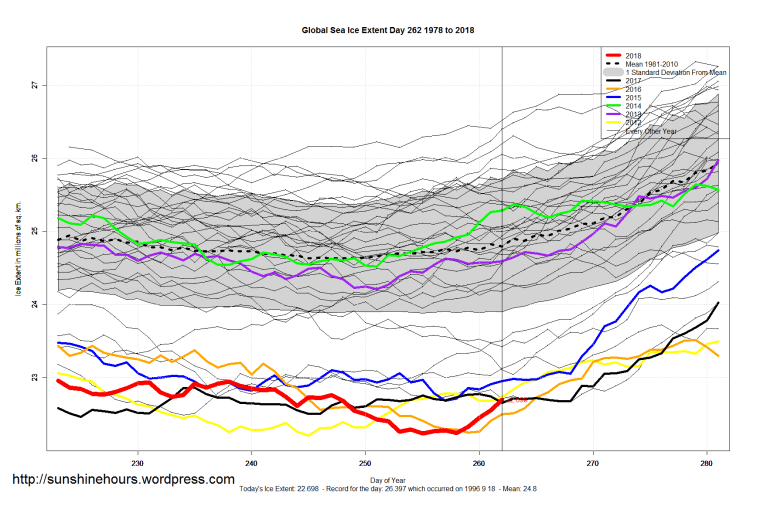
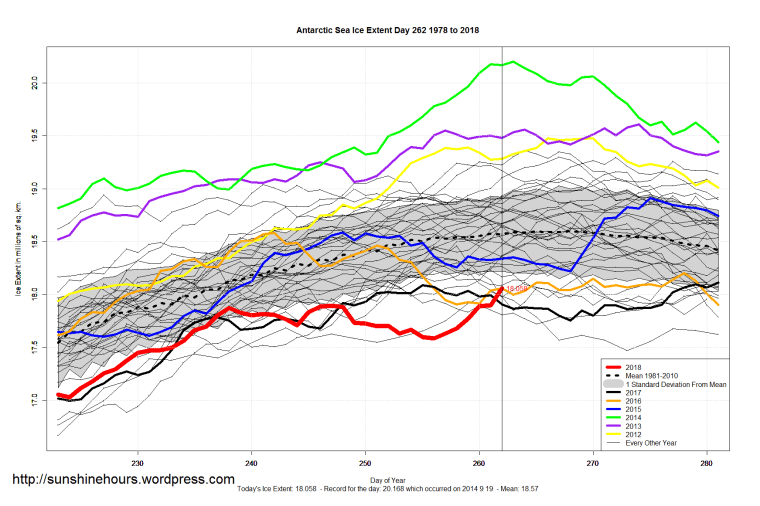
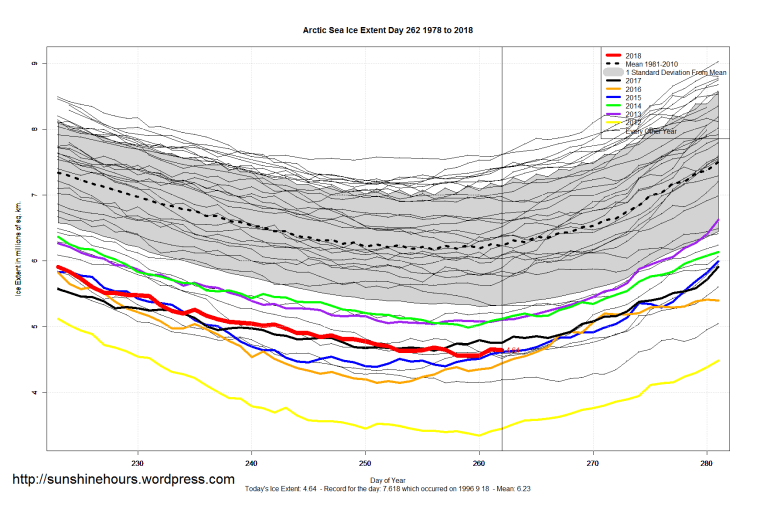
Sea Ice Extent (Global Antarctic and Arctic) – Day 262 – 2018
Speaking of records, Antarctic was on track for the lowest maximum ever. But in the last few days new ice ensures it will be at least the 2nd lowest.
1986’s record is safe. Yes, 1986 had the lowest maximum ever.
# Year   Min    Max    dMax   dMin
1 1986 2.953 18.027     261     65
2 2018 2.150 18.058     262     49
Sea Ice Extent (Global Antarctic and Arctic) – Day 261 – 2018
I’m not calling Arctic minimum yet (it would have been day 259), but this is the list as of day 261.
| Year | Min | Max | day of Max | day of Min | Avg Anomaly |
| 2012 | 3.34 | 15.307 | 78 | 260 | -1.233799915421 |
| 2016 | 4.145 | 14.566 | 82 | 251 | -1.476420134 |
| 2007 | 4.147 | 14.842 | 69 | 257 | -1.160461206774 |
| 2011 | 4.333 | 14.704 | 66 | 251 | -1.151061206774 |
| 2015 | 4.387 | 14.554 | 53 | 251 | -1.06869111545 |
| 2008 | 4.548 | 15.354 | 58 | 262 | -0.662051281541 |
| 2018 | 4.553 | 14.504 | 73 | 259 | |
| 2010 | 4.59 | 15.351 | 90 | 262 | -0.923165316363 |
| 2017 | 4.635 | 14.449 | 64 | 256 | -1.241855727322 |
| 2014 | 4.988 | 15.007 | 79 | 259 | -0.844061206774 |
| 2013 | 5.04 | 15.196 | 73 | 256 | -0.737442028692 |
| 2009 | 5.047 | 15.195 | 61 | 255 | -0.702587234171 |
| 2005 | 5.314 | 14.993 | 68 | 263 | -0.727581754719 |
| 2002 | 5.625 | 15.624 | 68 | 261 | -0.27169134376 |
| 1999 | 5.676 | 15.627 | 89 | 255 | 0.05690865624 |
| 2006 | 5.746 | 14.777 | 70 | 257 | -0.861943398555 |
| 2004 | 5.77 | 15.3 | 70 | 262 | -0.399463849847 |
| 2000 | 5.943 | 15.498 | 63 | 255 | -0.131723412688 |
| 2003 | 5.969 | 15.629 | 79 | 260 | -0.237335179377 |
| 1990 | 6.011 | 16.249 | 71 | 264 | 0.059283998705 |
| 1995 | 6.012 | 15.384 | 90 | 247 | -0.219447508144 |
| 1993 | 6.161 | 16.048 | 72 | 256 | 0.288494957609 |
| 1991 | 6.259 | 15.647 | 56 | 259 | 0.114700437062 |
| 1998 | 6.293 | 16.07 | 56 | 260 | 0.122823724733 |
| 1984 | 6.396 | 15.809 | 78 | 260 | 0.272841947825 |
| 1985 | 6.486 | 16.163 | 76 | 252 | 0.357959847693 |
| 2001 | 6.567 | 15.742 | 63 | 262 | -0.034540658829 |
| 1997 | 6.602 | 15.684 | 79 | 246 | 0.033056601445 |
| 1989 | 6.888 | 15.766 | 65 | 265 | 0.332297697336 |
| 1987 | 6.89 | 16.293 | 52 | 245 | 0.613975225596 |
| 1979 | 6.895 | 16.635 | 60 | 264 | 0.689988773313 |
| 1981 | 6.902 | 15.801 | 73 | 253 | 0.49516345076 |
| 1994 | 6.934 | 15.77 | 52 | 248 | 0.376760711034 |
| 1988 | 7.048 | 16.309 | 70 | 255 | 0.534692920098 |
| 1986 | 7.122 | 16.158 | 69 | 249 | 0.568586738431 |
| 1996 | 7.147 | 15.484 | 52 | 254 | 0.200888609169 |
| 1992 | 7.159 | 15.576 | 72 | 251 | 0.470582598241 |
| 1982 | 7.16 | 16.325 | 58 | 256 | 0.810824861467 |
| 1983 | 7.204 | 16.412 | 73 | 251 | 0.696560711034 |
| 1980 | 7.533 | 16.302 | 65 | 249 | 0.694625094596 |


