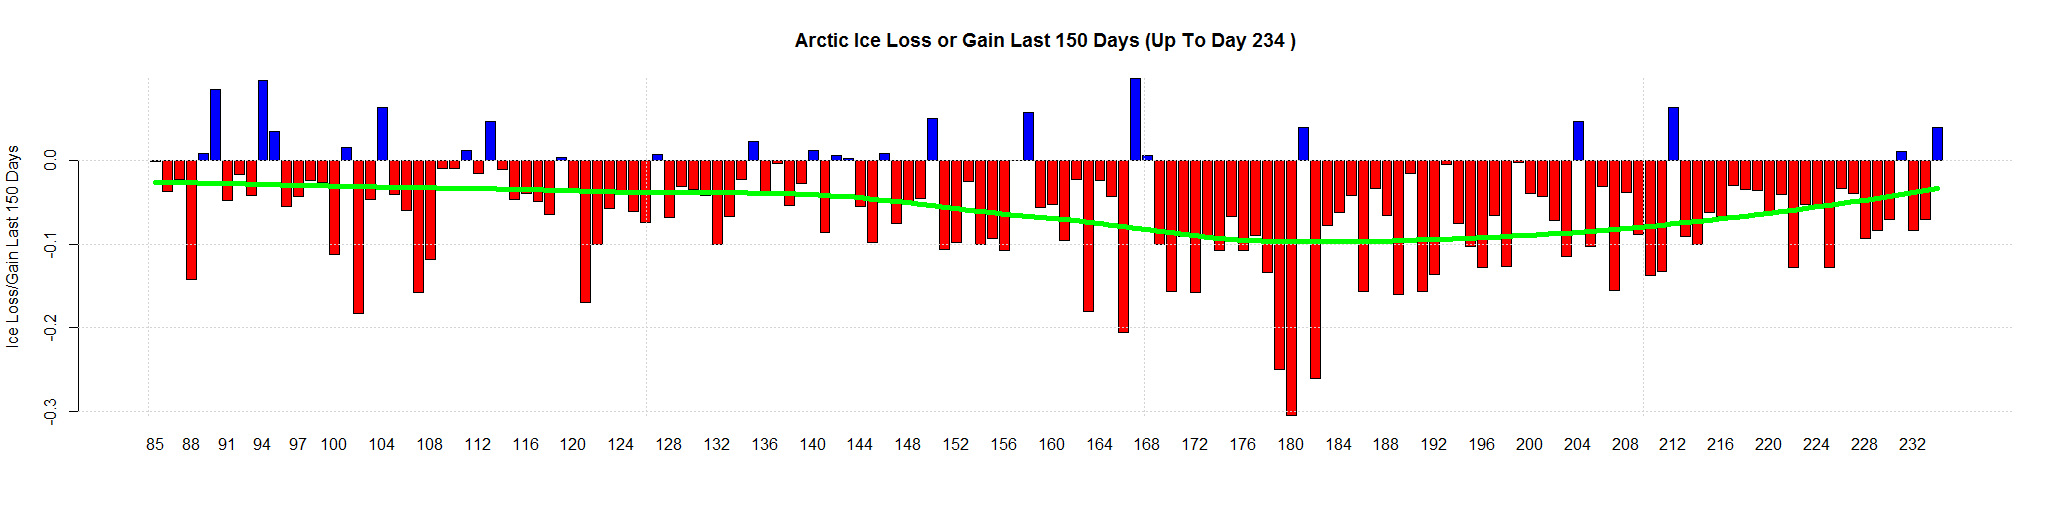
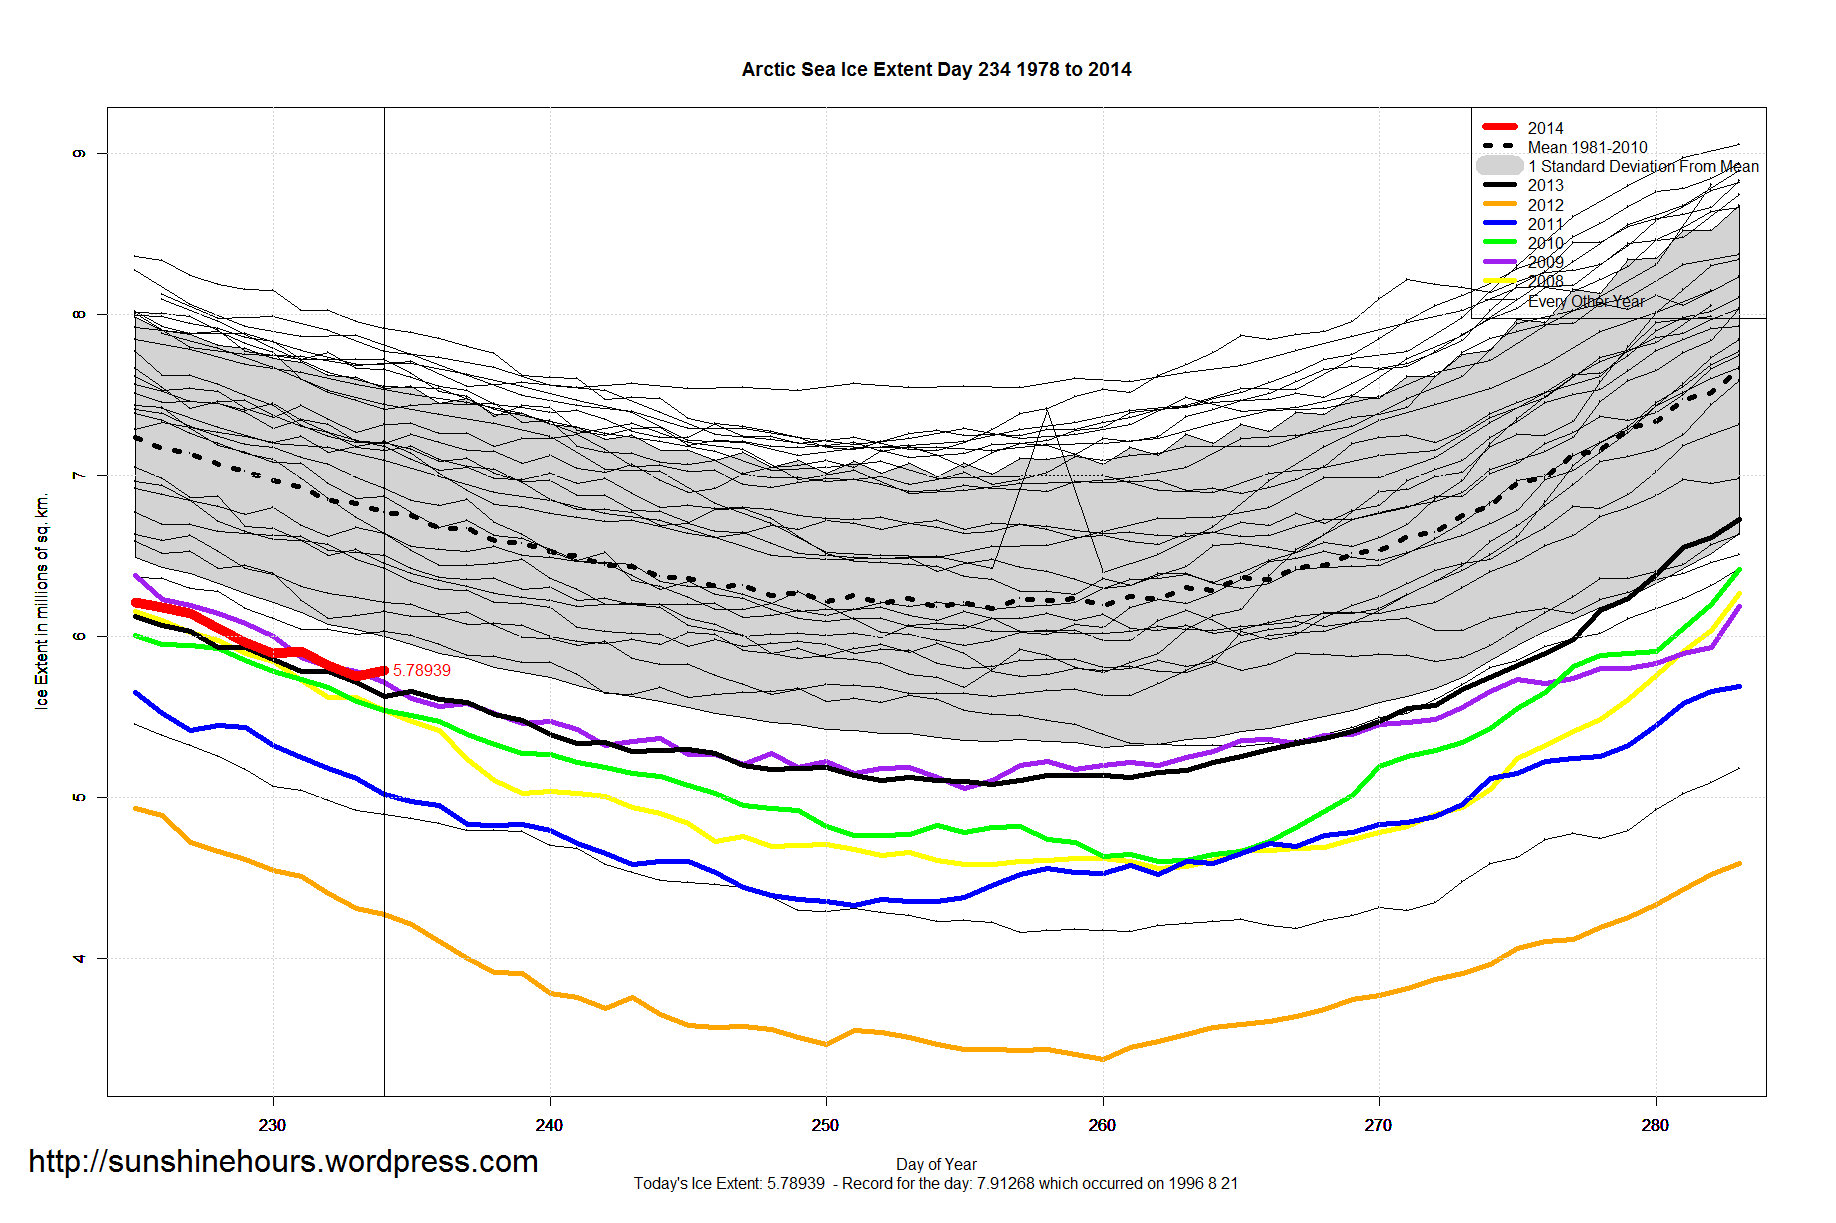
Arctic Sea Ice Extent Aug 23 2014 – -1,071,000 sq km below the 1981-2010 mean. Data for Day 234. Data here.
A 39,000 sq km gain. The second gain in 4 days,

Arctic Sea Ice Extent Aug 23 2014 – -1,071,000 sq km below the 1981-2010 mean. Data for Day 234. Data here.
A 39,000 sq km gain. The second gain in 4 days,
Arctic Sea Ice Extent Aug 22 2014 – -1,115,000 sq km below the 1981-2010 mean. Data for Day 233. Data here.


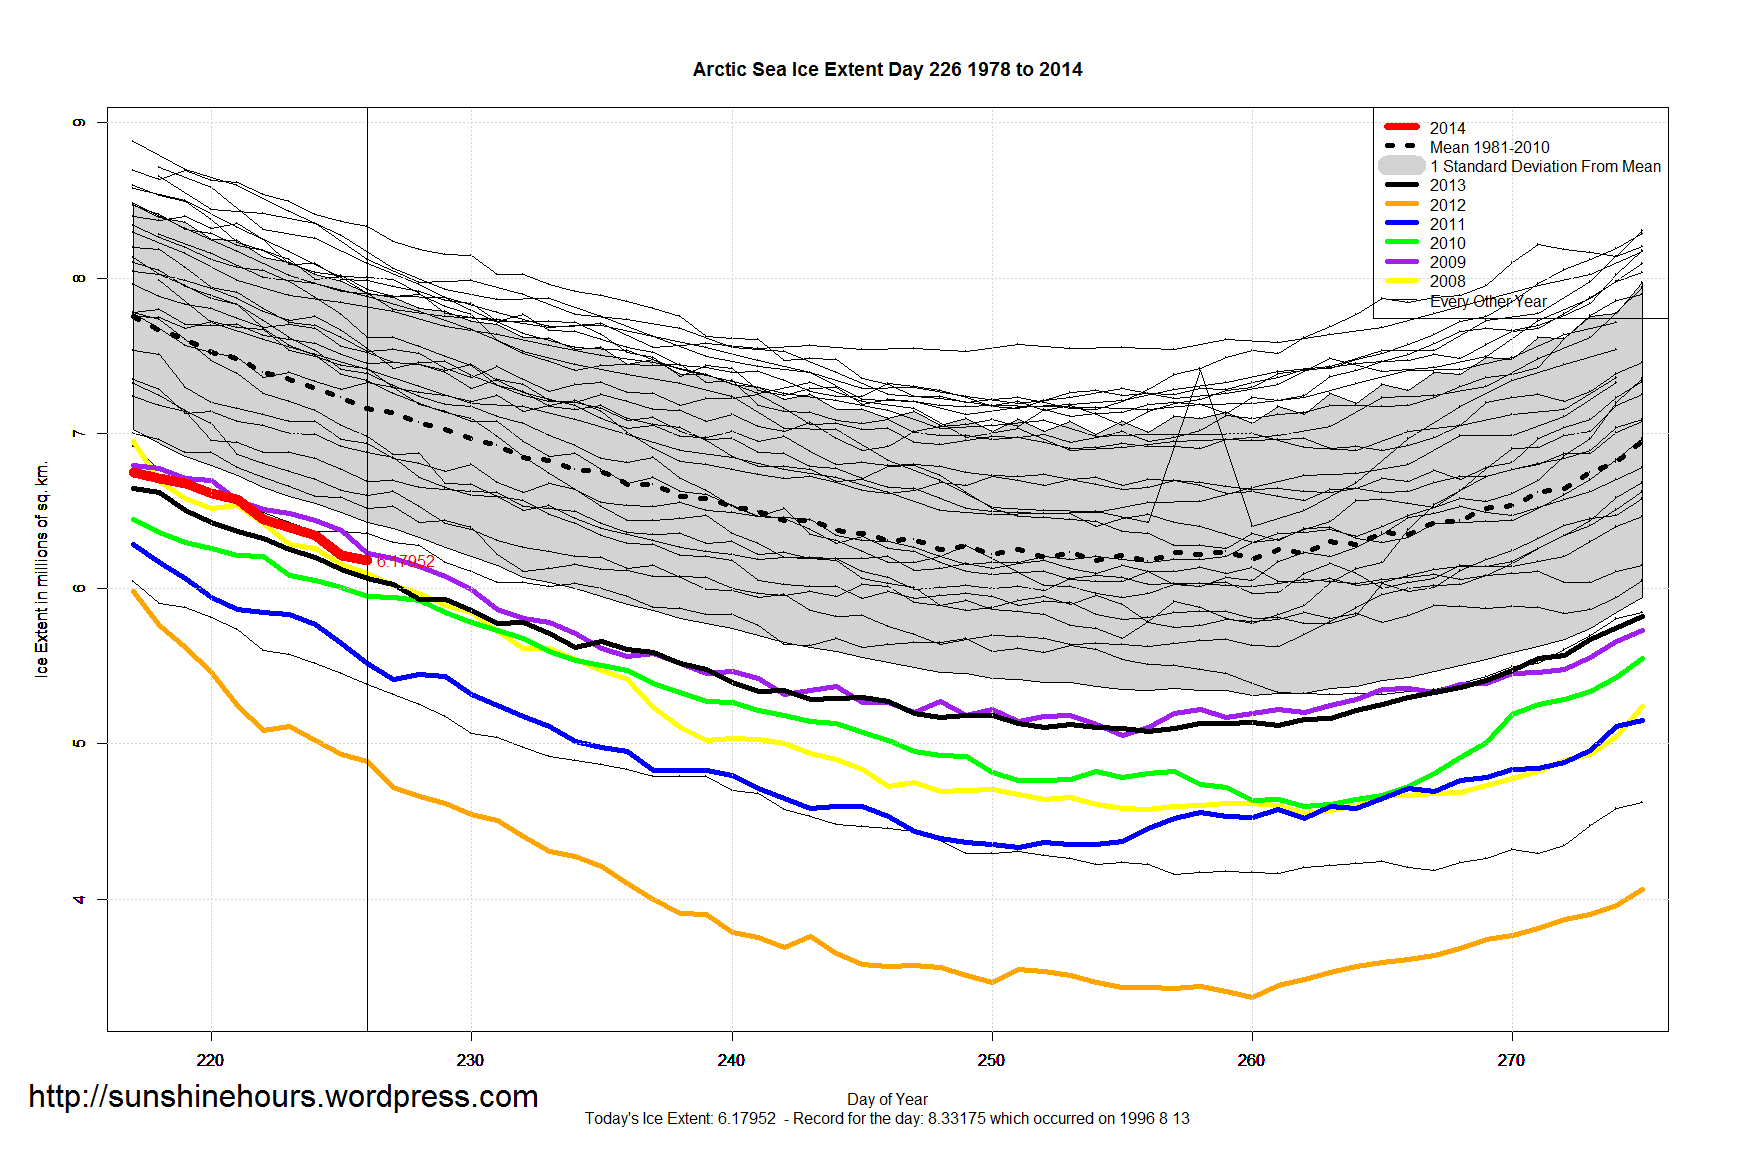
Arctic Sea Ice Extent Aug 21 2014 – -1,076,000 sq km below the 1981-2010 mean. Data for Day 232. Data here.


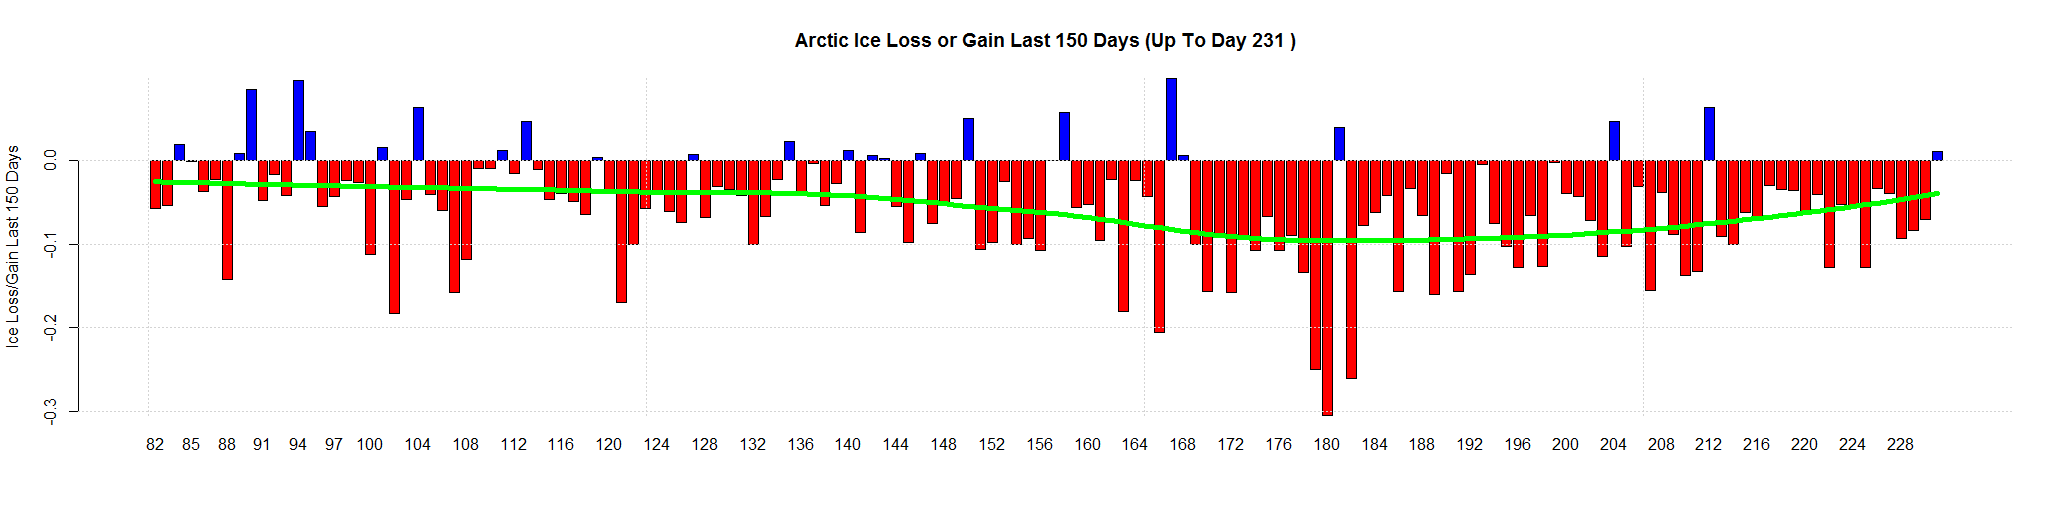
Arctic Sea Ice Extent Aug 20 2014 – -1,084,000 sq km below the 1981-2010 mean. Data for Day 231. Data here.
The tiny blue bar all the way to the right is a 10,000 sq km gain.


Arctic Sea Ice Extent Aug 19 2014 – -1,156,000 sq km below the 1981-2010 mean. Data for Day 230. Data here.


Arctic Sea Ice Extent Aug 18 2014 – -1,126,000 sq km below the 1981-2010 mean. Data for Day 229. Data here.


Arctic Sea Ice Extent Aug 17 2014 – -1,102,000 sq km below the 1981-2010 mean. Data for Day 228. Data here.


Arctic Sea Ice Extent Aug 16 2014 – -1,055,000 sq km above the 1981-2010 mean. Data for Day 227. Data here.


Arctic Sea Ice Extent is -1,064,000 sq km below the 1981-2010 mean.

Arctic Sea Ice Extent is -1,043,000 sq km below the 1981-2010 mean.
Drifting very slowly away from the standard deviation mark. It is now 300,000 sq km below. A few days ago it was 220,000. But, to be fair, 2 weeks ago it was 500,000 below.
The data is for day 224. Day 245 was the earliest minimum ever. Day 265 was the latest. So 3 to 6 weeks more melting.

