PIOMAS is: “Sea Ice Volume is calculated using the Pan-Arctic Ice Ocean Modeling and Assimilation System (PIOMAS, Zhang and Rothrock, 2003) developed at APL/PSC. Anomalies for each day are calculated relative to the average over the 1979 -2014 period for that day of the year to remove the annual cycle.”
The PIOMAS daily data is up to the end of February 2016.
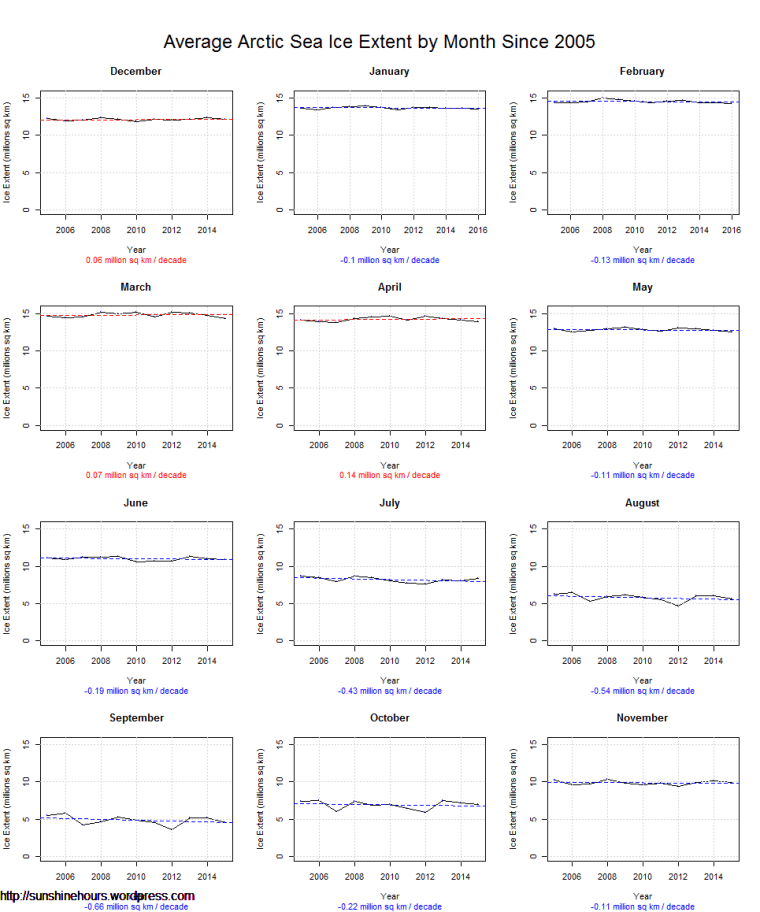
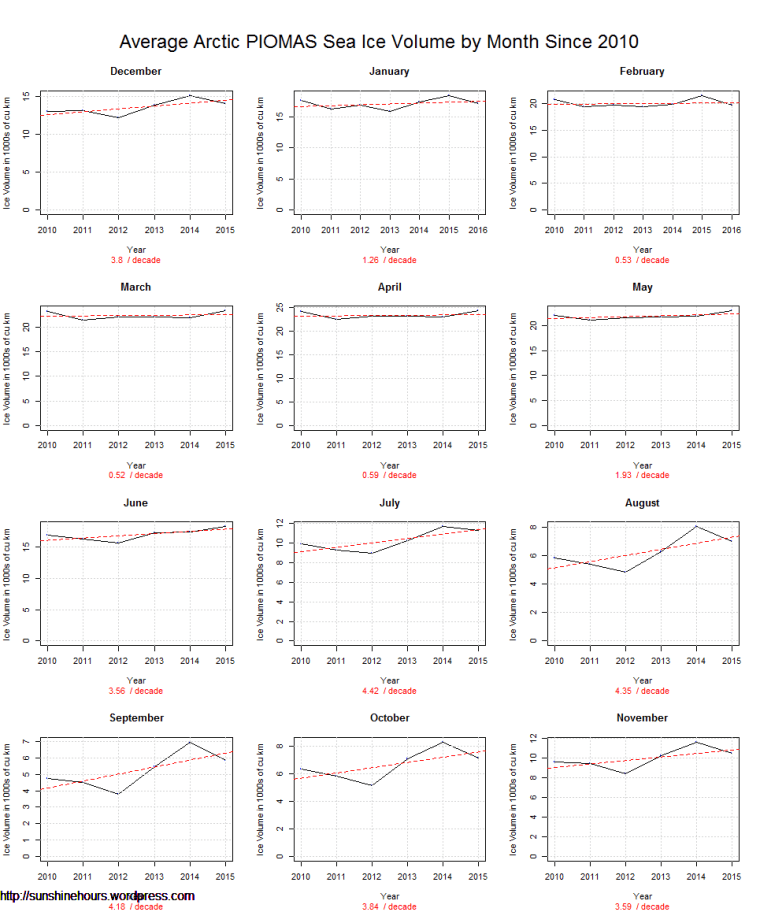
I post a lot of graphs about sea ice area and extent. Some of them show all the data. Some of them show data from 2005 because thats when the arctic sea ice extent trends levelled out.
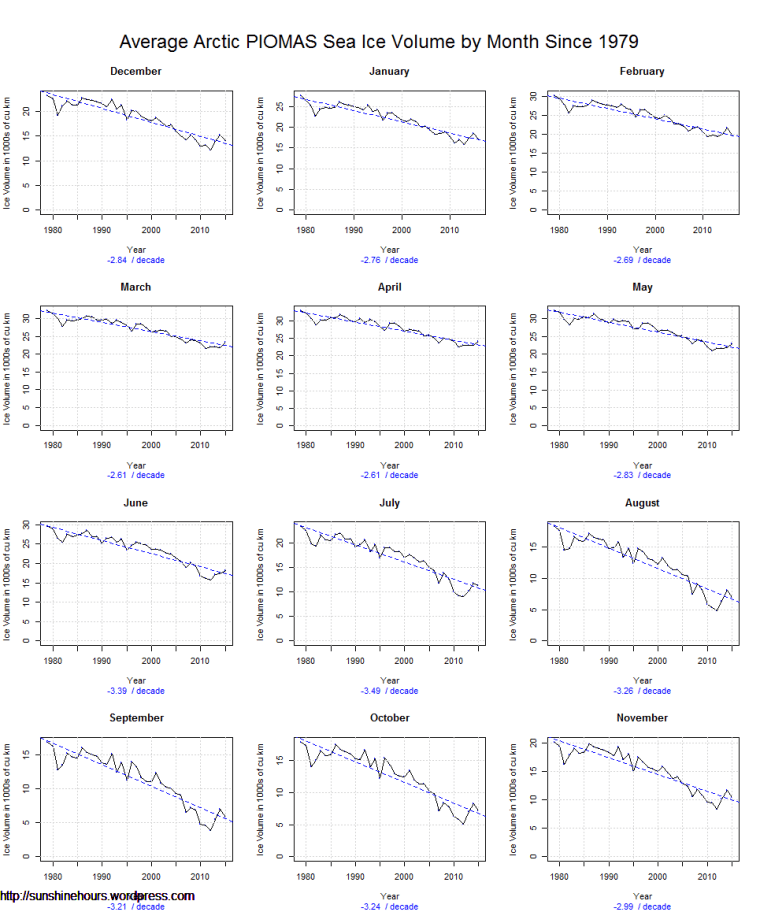
PIOMAS also shows a leveling out, but not until 2010. I will show both the monthly graphs from 2010 and from 1979. (Click twice for larger) (Graph corrected due to incorrect units)
References:
Volume time series and uncertainties:
Schweiger, A., R. Lindsay, J. Zhang, M. Steele, H. Stern, Uncertainty in modeled arctic sea ice volume, J. Geophys. Res., doi:10.1029/2011JC007084, 2011
Model details:
Zhang, J.L. and D.A. Rothrock, “Modeling global sea ice with a thickness and enthalpy distribution model in generalized curvilinear coordinates“, Mon. Weather Rev., 131, 845-861, 2003
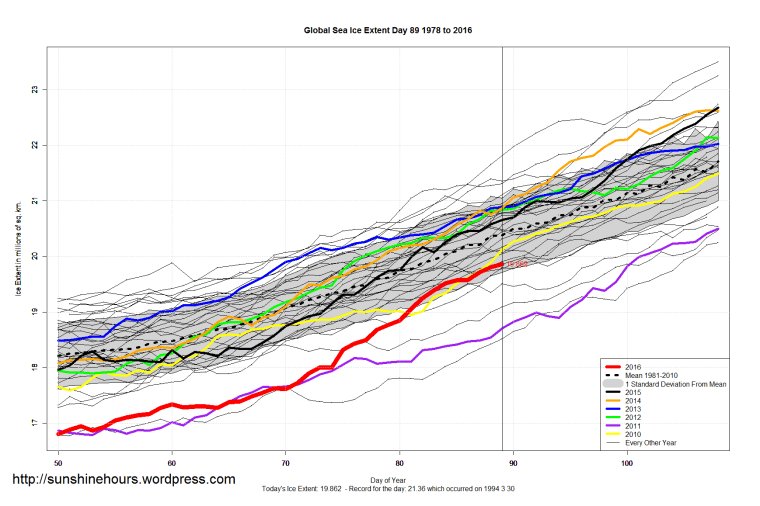
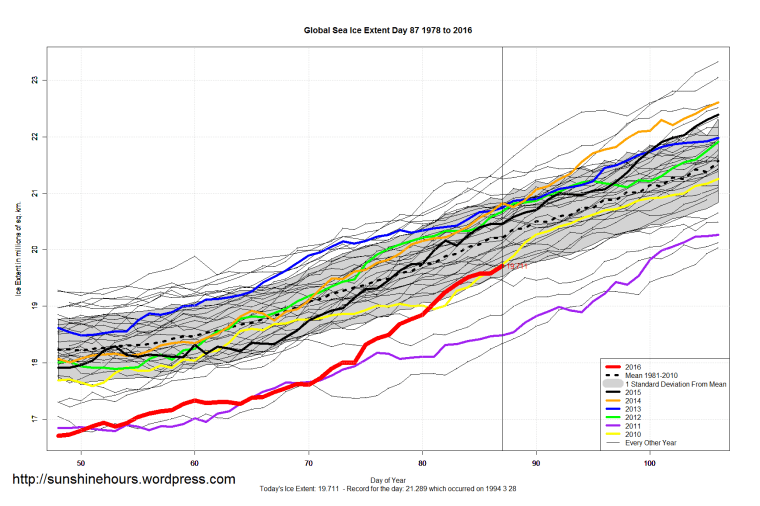
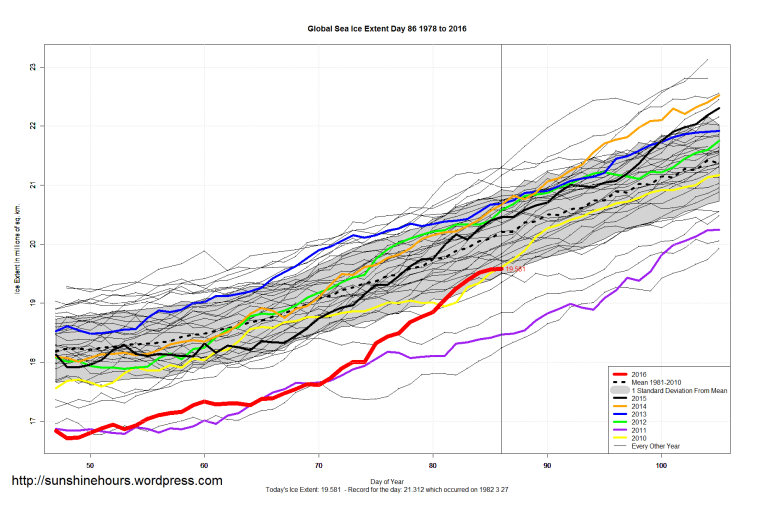
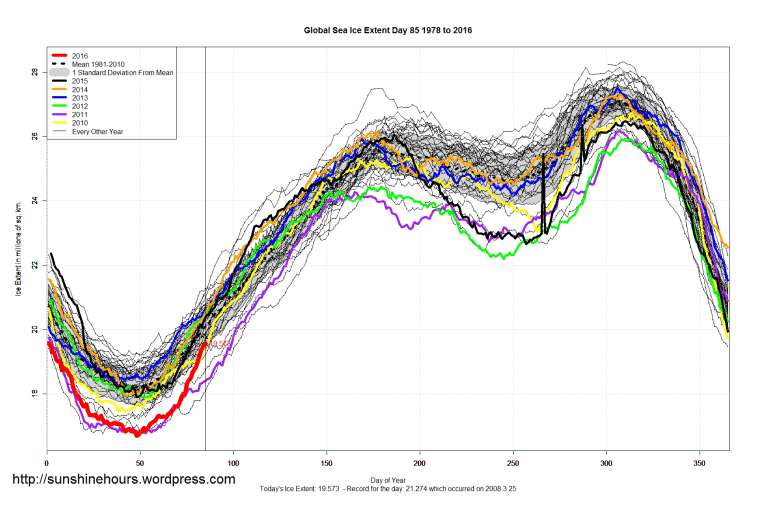
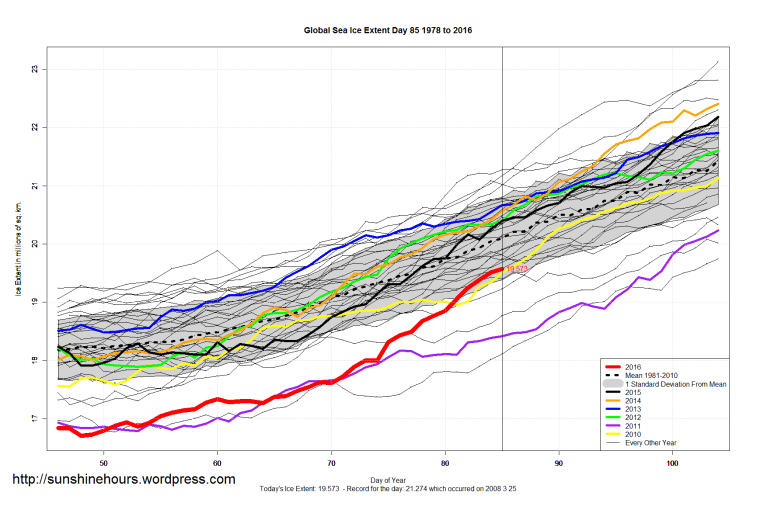
Global Sea Ice is inside the one standard deviation mark.
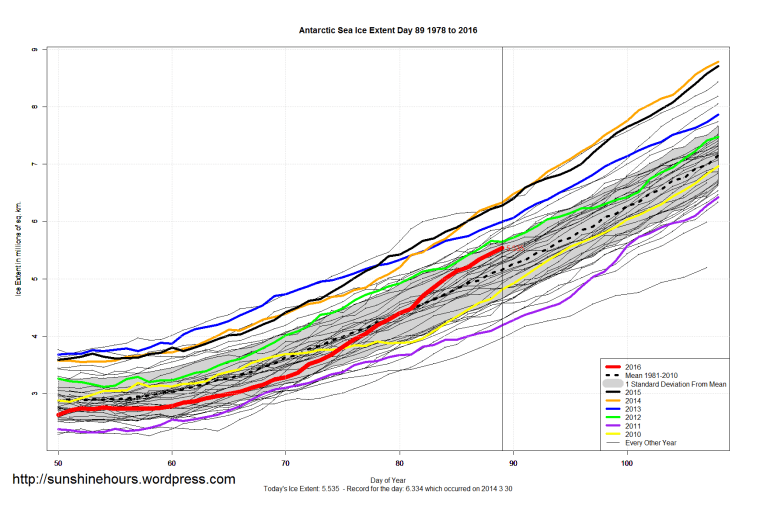
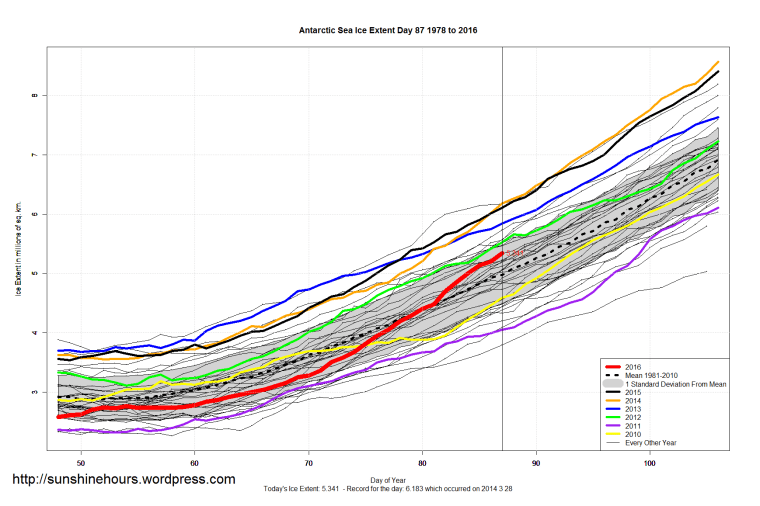
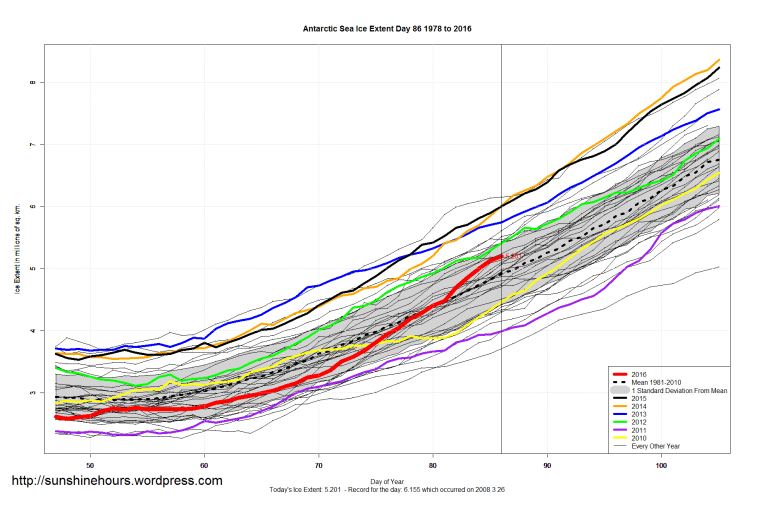
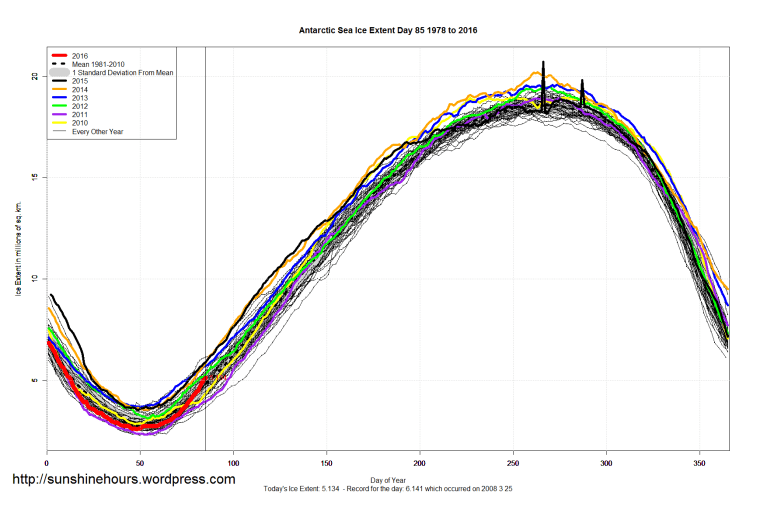
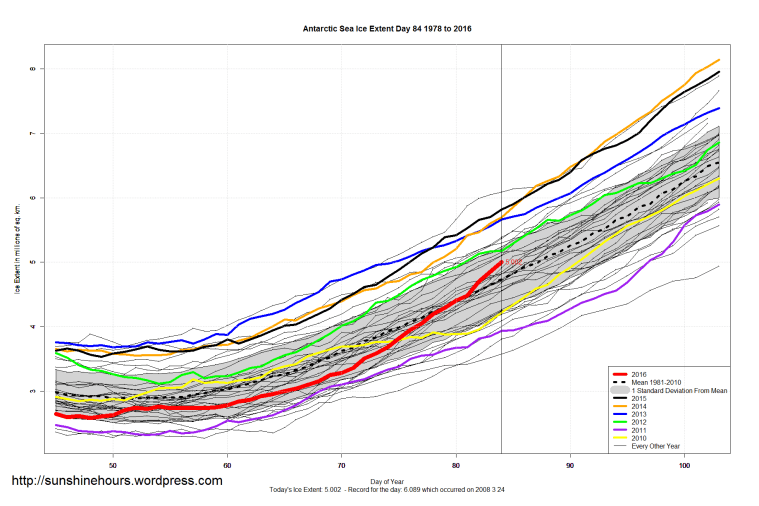
Antarctic Sea Ice is approaching the above one standard mean mark.
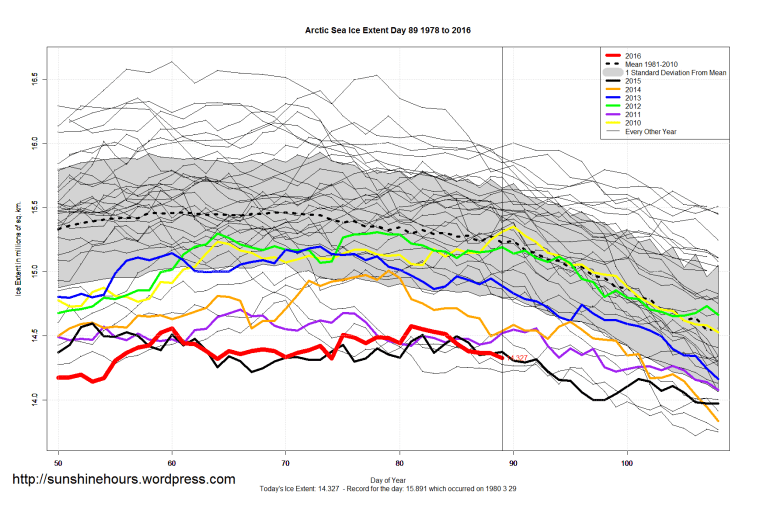
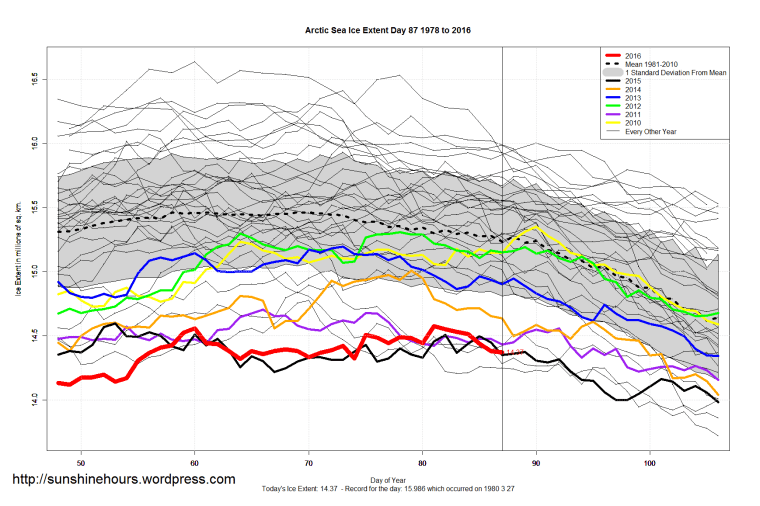
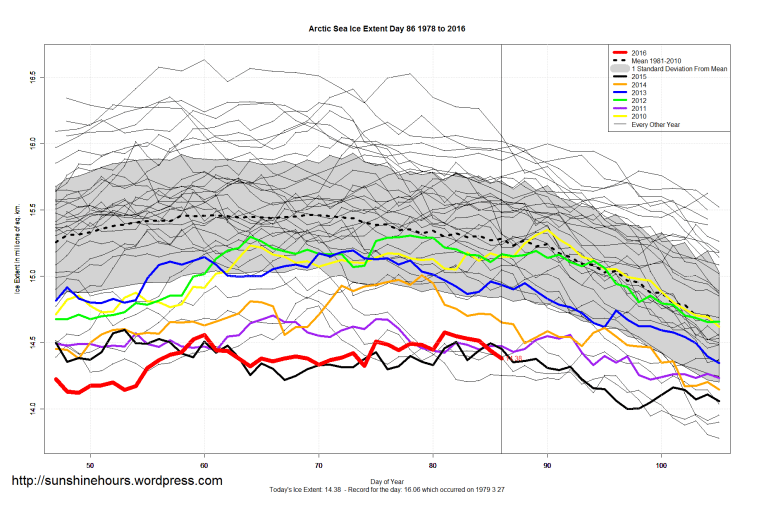
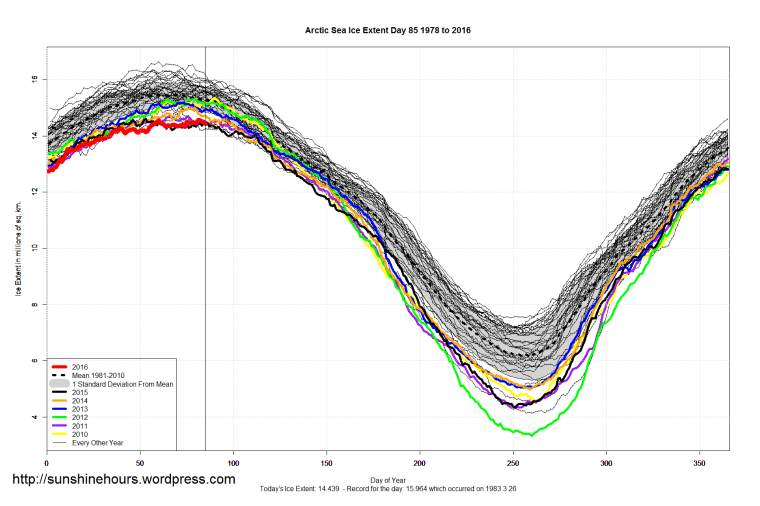
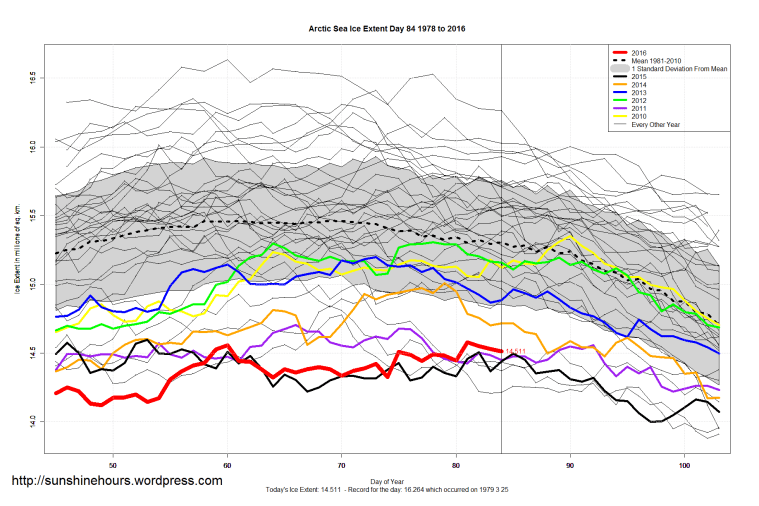
I’m pretty sure Arctic Sea Ice no longer has any chance of changing the maximum for 2016 and therefore will set the record for lowest maximum (NSIDC) by about 20,000 sq km (MASIE disagrees).


There have been many online articles predicting Arctic Sea Ice doom in the last week.
My favorite quote is: “Scientists warn that the area covered by this winter’s Arctic sea ice could turn out to be the lowest ever measured.”
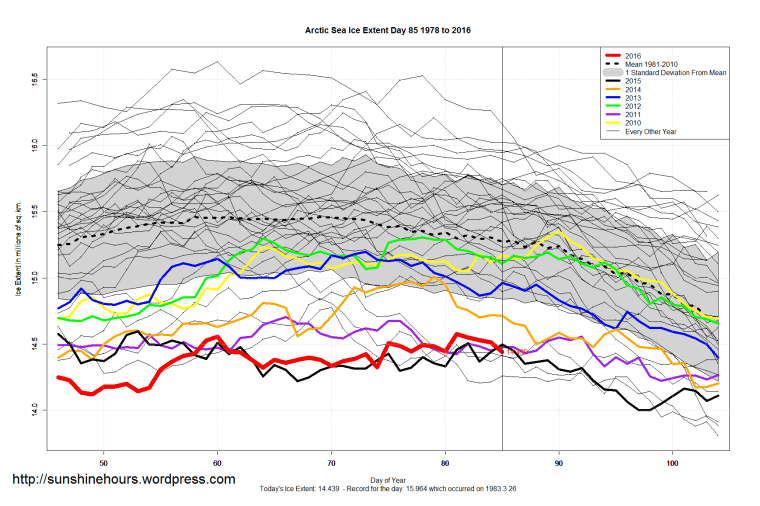
Total nonsense. In fact, as of day 83 Arctic Sea Ice extent is higher than it was in 2005, 2006, 2007, 2011 and 2015.
The record that may be set (maybe not since there is still a week or so to go before day 90 which is the latest maximum) is lowest maximum.
The record may be broken by 20,000 sq km. Out of 14,000,000 sq km. 0.14%
And MASIE (a different method) has 2016’s maximum 400,000 sq km HIGHER than 2006. (MASIE only goes back to 2006)
| Year | Min | Max | day of Max | day of Min |
| 2012 | 3368882.08 | 15821891.32 | 82 | 264 |
| 2008 | 4223400.12 | 15661926.25 | 72 | 265 |
| 2014 | 5066134.38 | 15523208.18 | 73 | 262 |
| 2013 | 4677324.53 | 15505010.03 | 73 | 260 |
| 2010 | 4716943.6 | 15,396,877.99 | 77 | 266 |
| 2009 | 4871392.35 | 15,326,130.68 | 62 | 254 |
| 2011 | 4302977.96 | 15,110,021.96 | 67 | 257 |
| 2016 | 13095244.88 | 15,077,599.37 | 61 | |
| 2015 | 4442258.23 | 14,910,198.98 | 62 | 260 |
| 2007 | 3986945.93 | 14,907,125.15 | 73 | 261 |
| 2006 | 5640540.95 | 14,663,037.37 | 69 | 267 |
NSIDC/NOAA data graph.