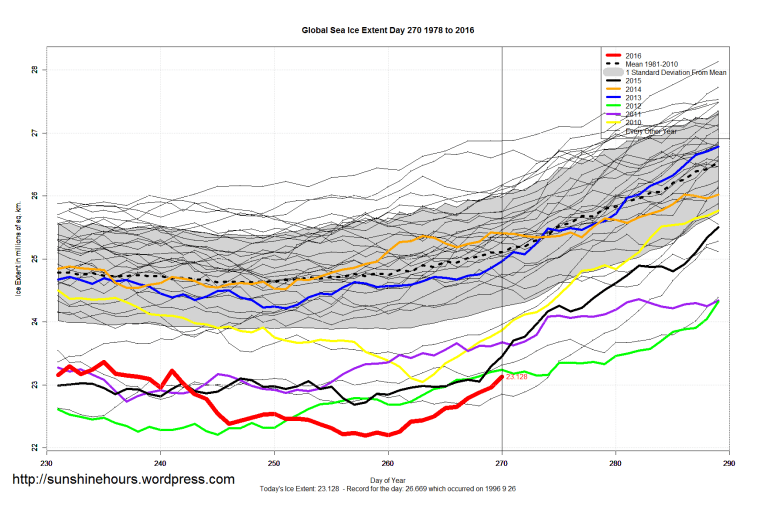
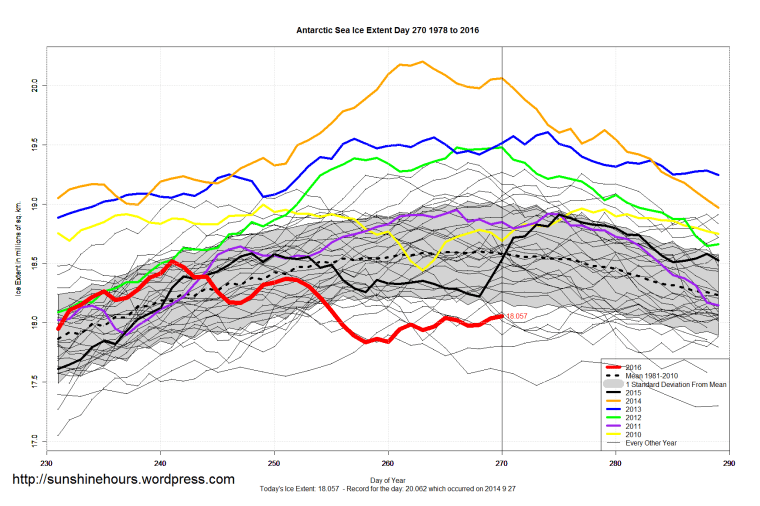
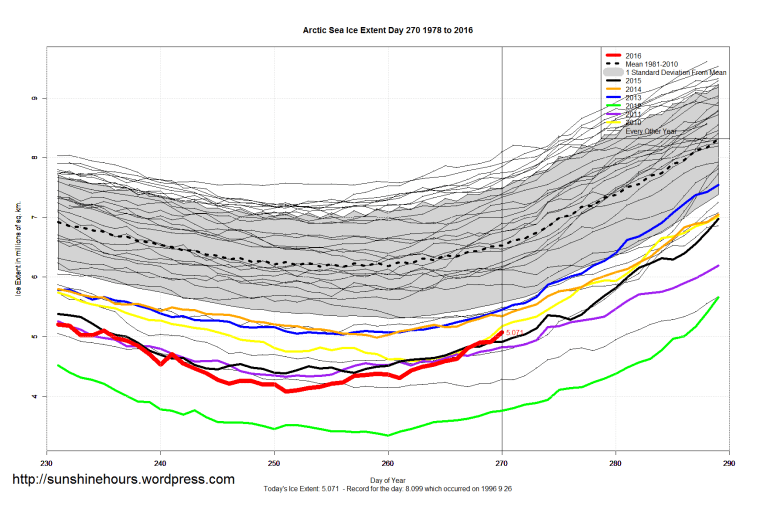
Sea Ice Extent (Global Antarctic and Arctic) – Day 270 – 2016 Published on September 27, 2016September 27, 2016 by sunshinehours11 Comment South / North
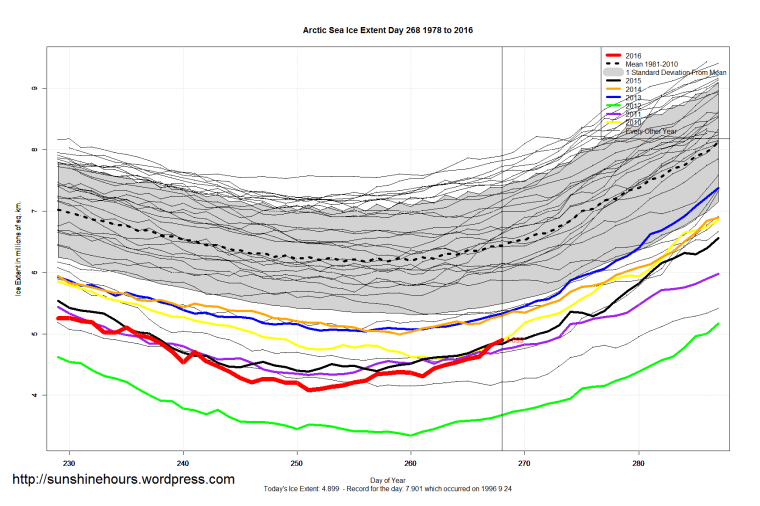
Sea Ice Extent (Global Antarctic and Arctic) – Day 268 – 2016 Published on September 25, 2016September 25, 2016 by sunshinehours1Leave a comment A quick recovery for the Arctic sees day 268 2016 higher than 2012, 2007,2008,2011,2015 and 2010. South / North
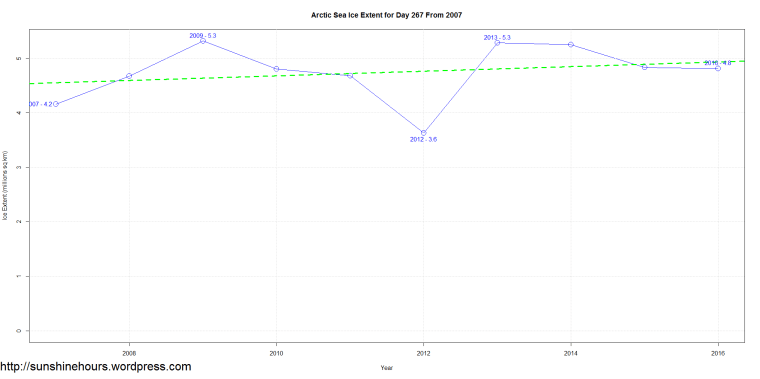
Sea Ice Extent (Global Antarctic and Arctic) – Day 267 – 2016 Published on September 23, 2016September 24, 2016 by sunshinehours1Leave a comment Day 267 1.2 million sq km above 2012. And also higher than 2007, 2008, 2011 and 2010. South / North
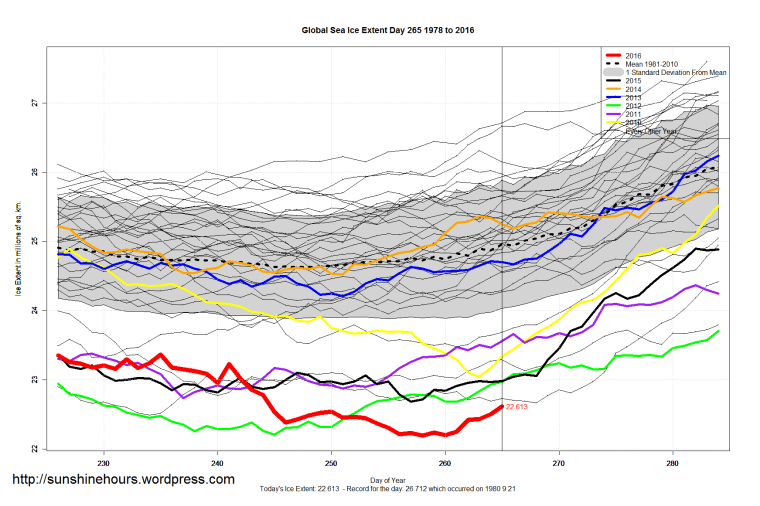
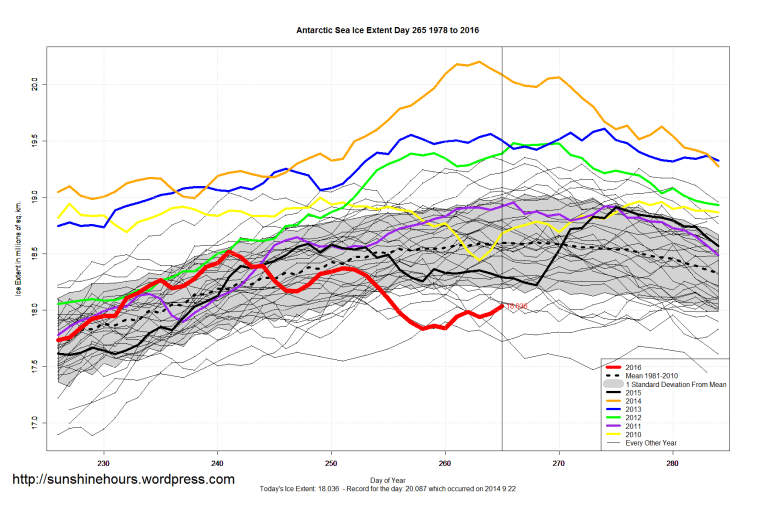
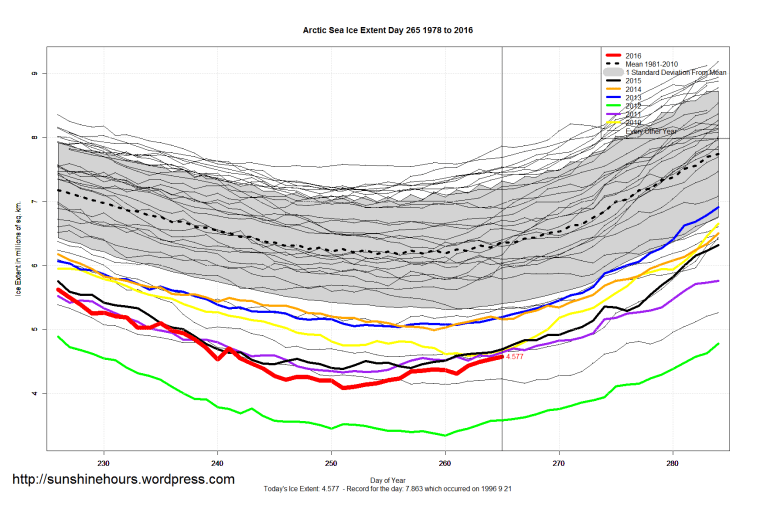
Sea Ice Extent (Global Antarctic and Arctic) – Day 265 – 2016 Published on September 22, 2016September 22, 2016 by sunshinehours1Leave a comment South / North
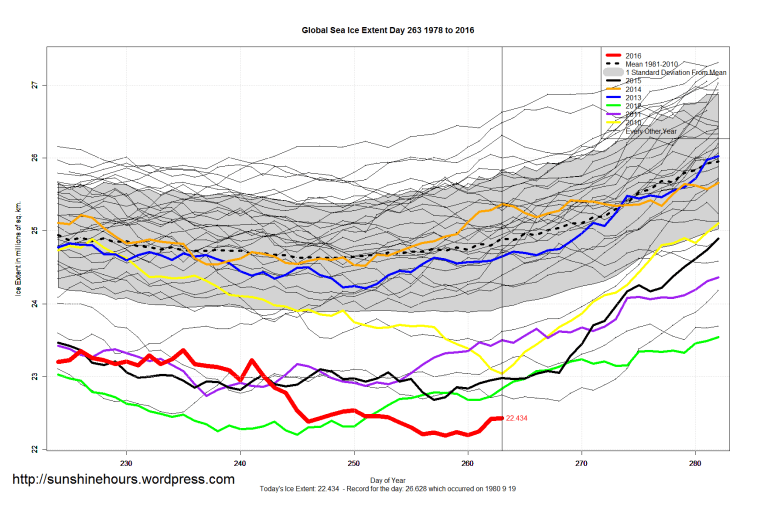
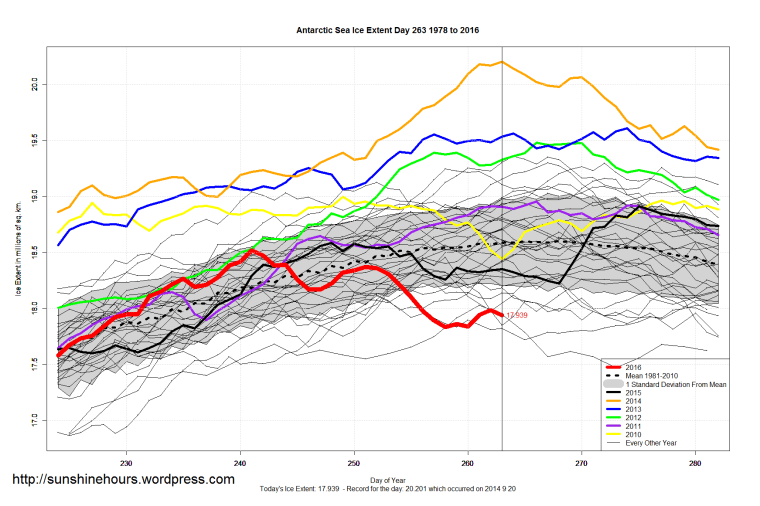
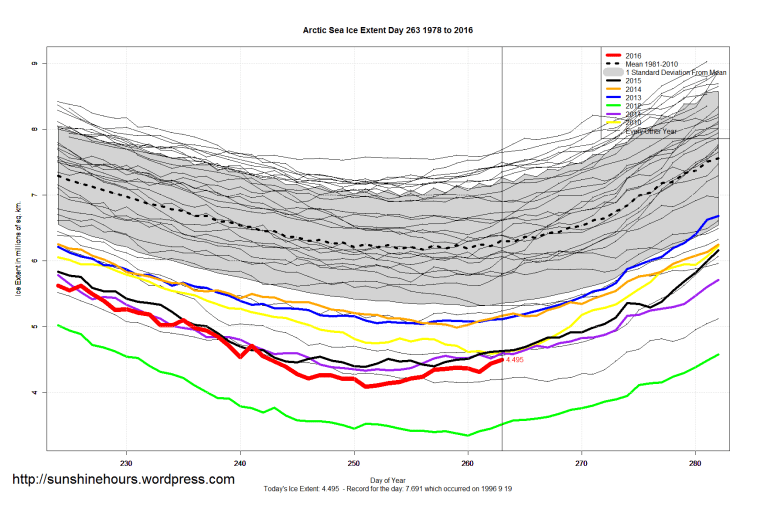
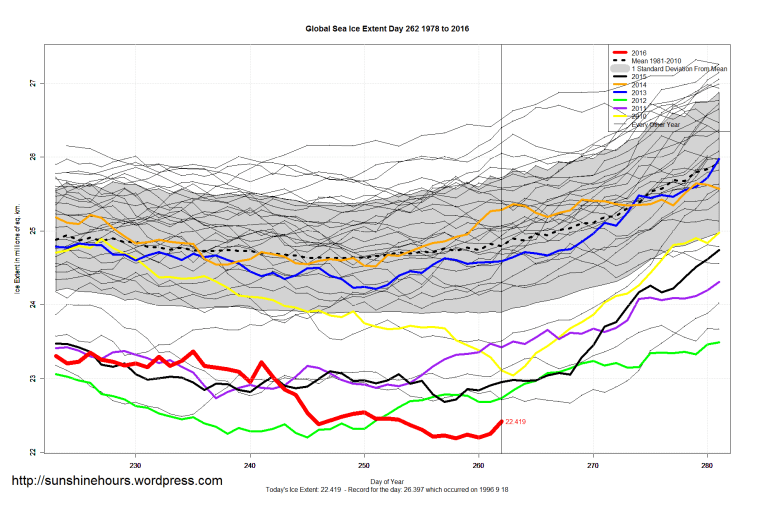
Sea Ice Extent (Global Antarctic and Arctic) – Day 263 – 2016 Published on September 20, 2016September 20, 2016 by sunshinehours1Leave a comment South / North
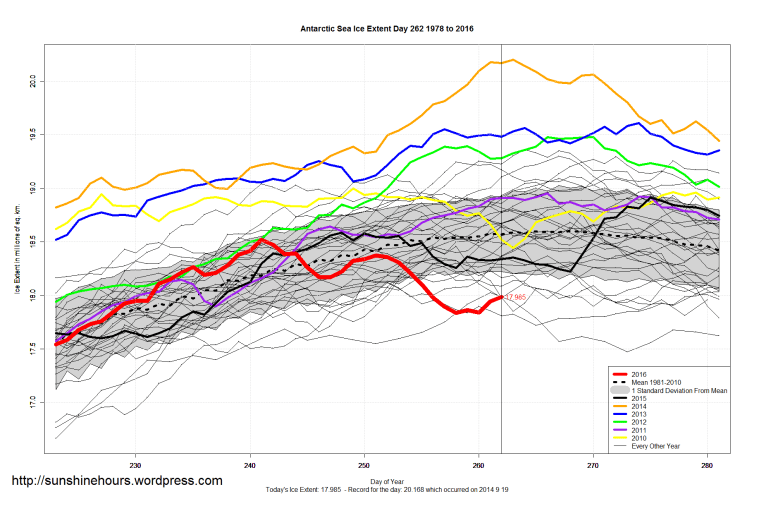
Sea Ice Extent (Global Antarctic and Arctic) – Day 262 – 2016 Published on September 19, 2016September 19, 2016 by sunshinehours11 Comment South / North
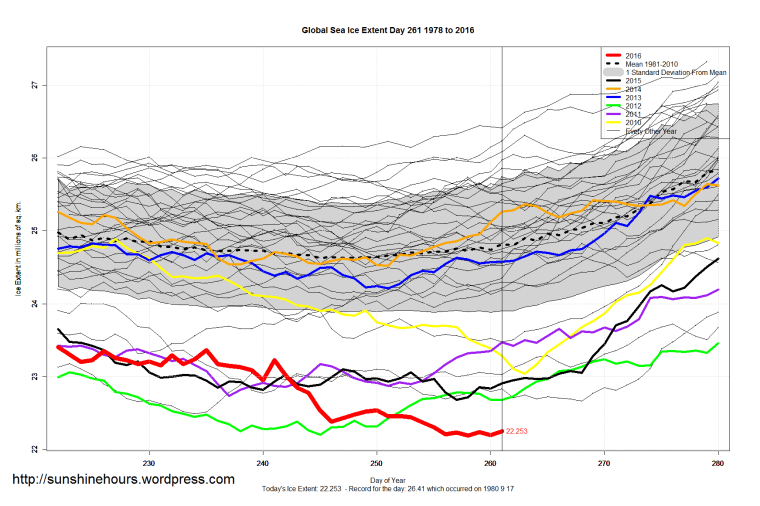
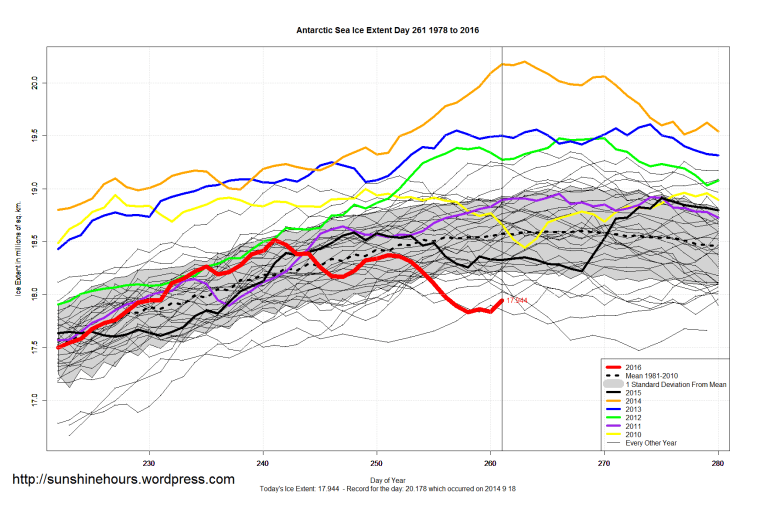
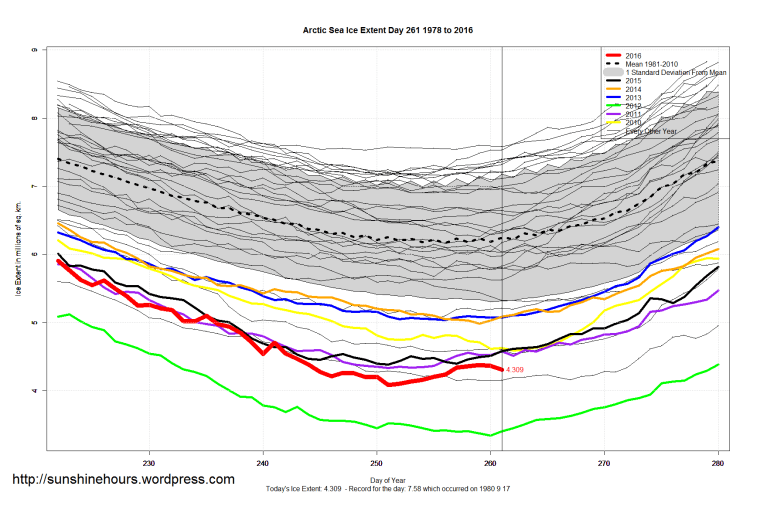
Sea Ice Extent (Global Antarctic and Arctic) – Day 261 – 2016 Published on September 19, 2016September 19, 2016 by sunshinehours1Leave a comment Update: Day 262 is now posted. This is the data from Sept 17th (which I should have posted yesterday) The data for the 18th has not appeared yet on the NOAA website. South / North
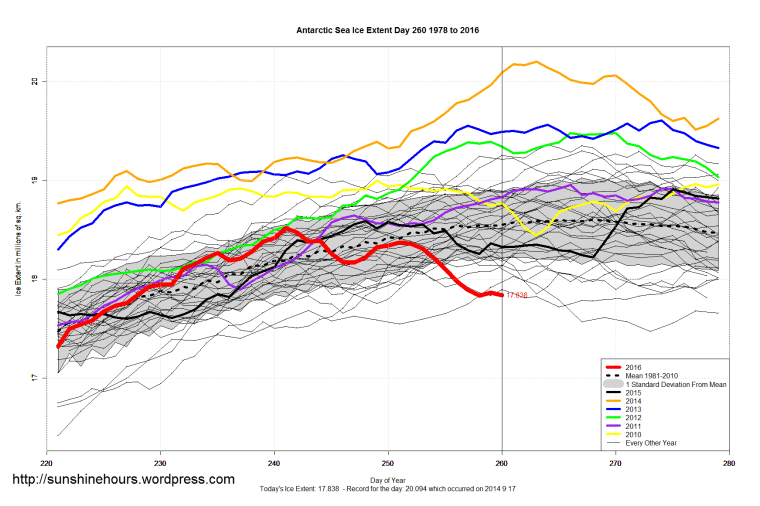
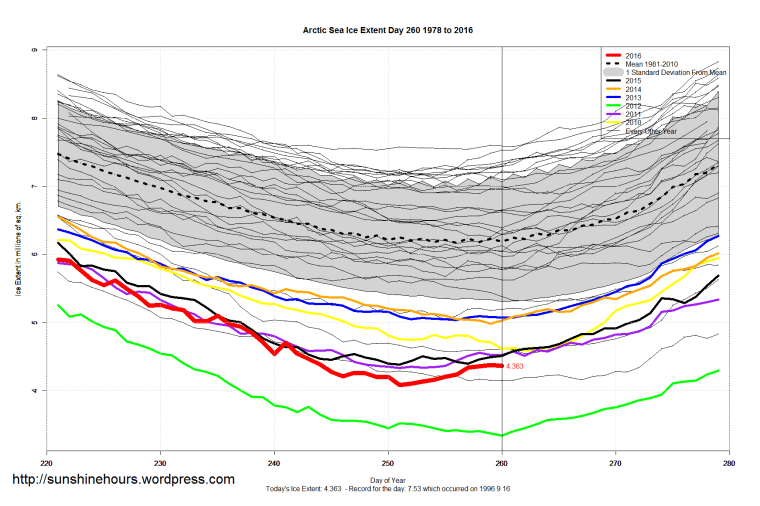
Sea Ice Extent (Global Antarctic and Arctic) – Day 260 – 2016 Published on September 17, 2016September 17, 2016 by sunshinehours11 Comment South / North
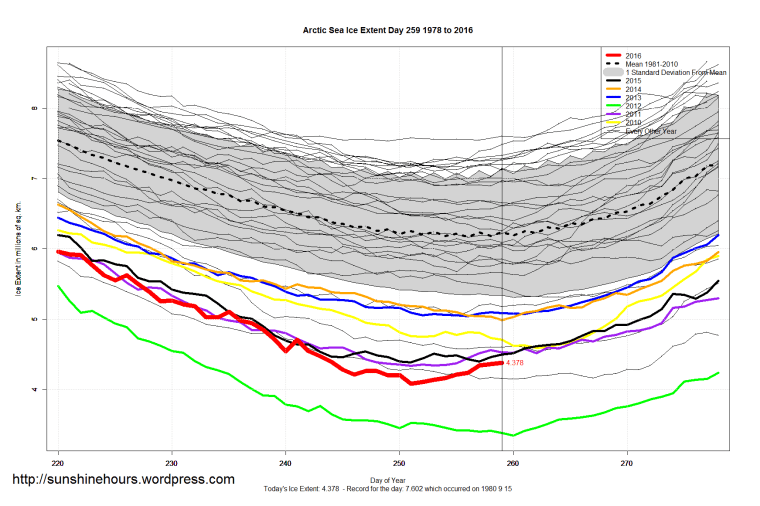
Sea Ice Extent (Global Antarctic and Arctic) – Day 259 – 2016 Published on September 16, 2016September 16, 2016 by sunshinehours11 Comment Day 259 isn’t particularly significant except for the math. In 2012 arctic sea ice was 3.378 million sq km. In 2016 it is 4.378 million sq km. Exactly 1,000,000 sq km difference. South / North
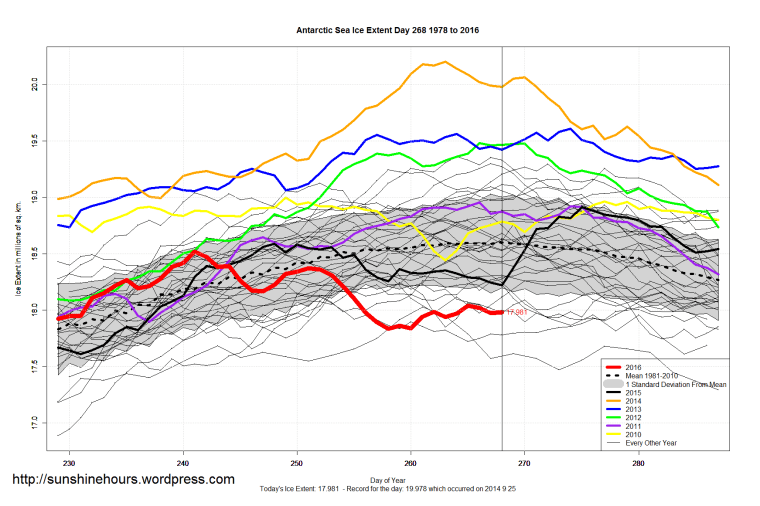
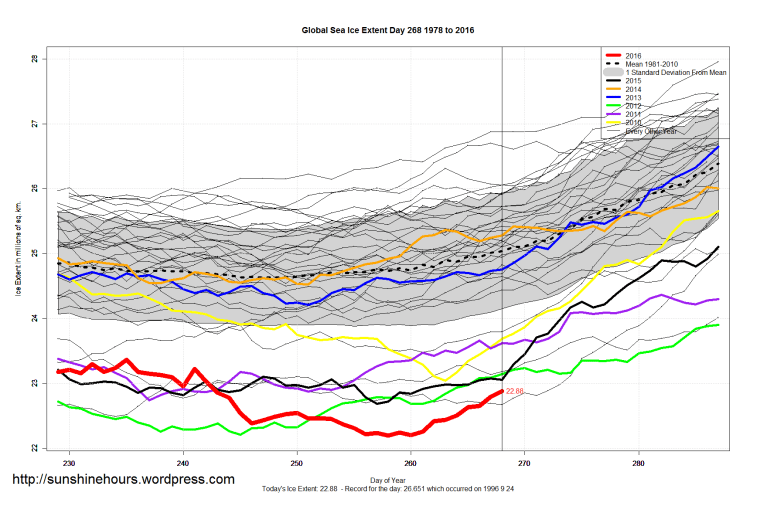
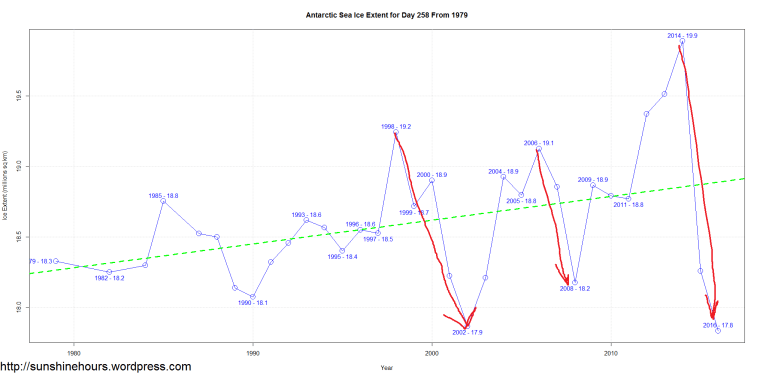
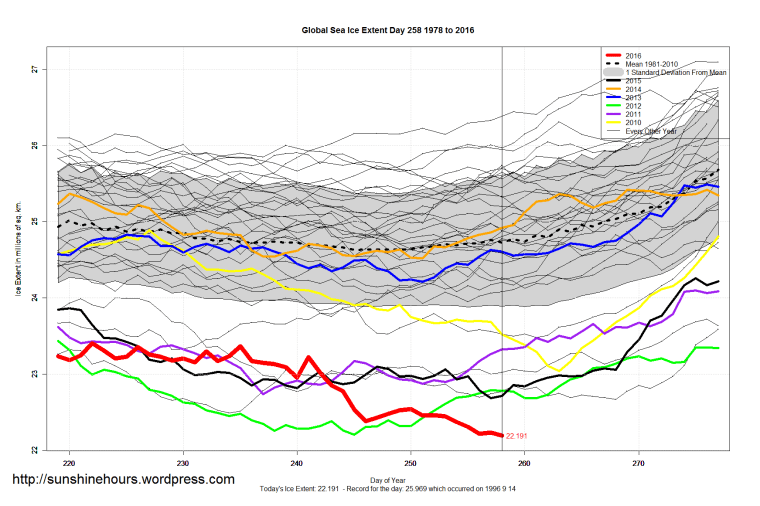
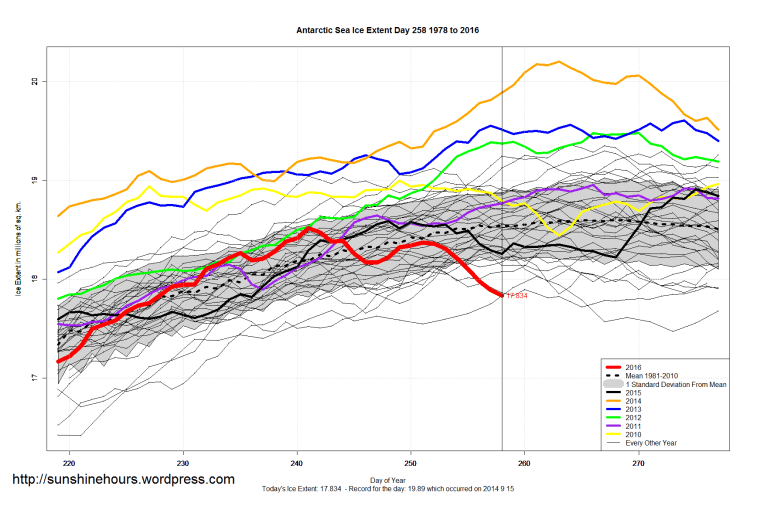
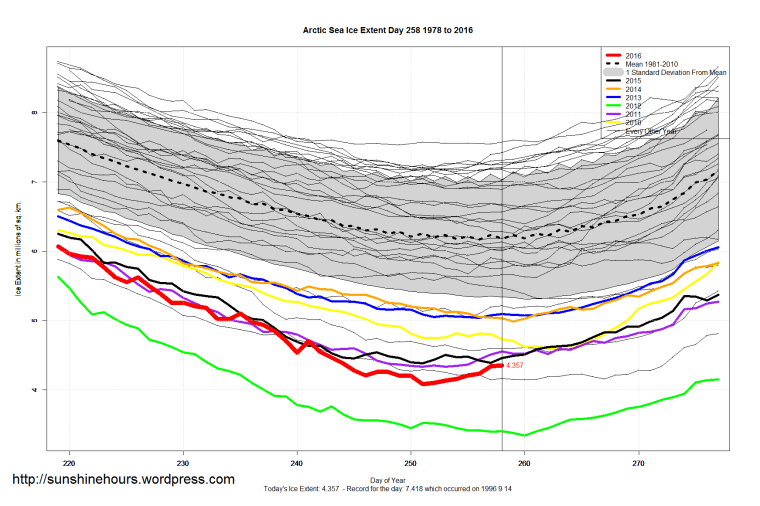
Sea Ice Extent (Global Antarctic and Arctic) – Day 258 – 2016 Published on September 15, 2016September 15, 2016 by sunshinehours11 Comment Its not unusual for there to be deep drops in Antarctic Sea Ice after a peak … but this is a big one. Of course the peaking of the AMO might have something to do with it. The first graph is just for day 258. South / North