Sea Ice Extent (Global Antarctic and Arctic) – Day 93 – 2016 (No Data Yet)

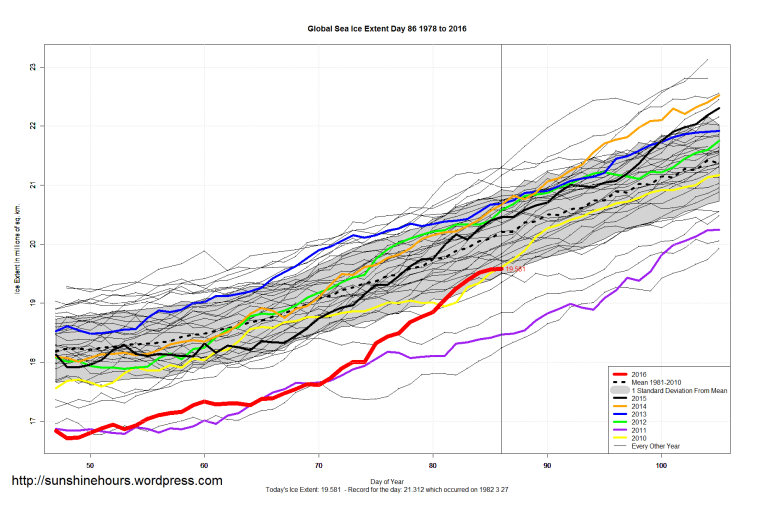
The data for day 93 has not been uploaded to the website. It is late.


South / North

Arctic Sea Ice Extent Since 2005 With 0 Shown on Y Axis

Arctic Sea Ice Extent By Month from 2005 with 0 shown on the Y axis. Red line shows an increasing ice trend.

Does this look like doom for the Arctic to you?

Average Arctic Sea Ice Extent by Month Since 2005


The latest South / North

Sea Ice Extent (Global Antarctic and Arctic) – Day 88 – 2016

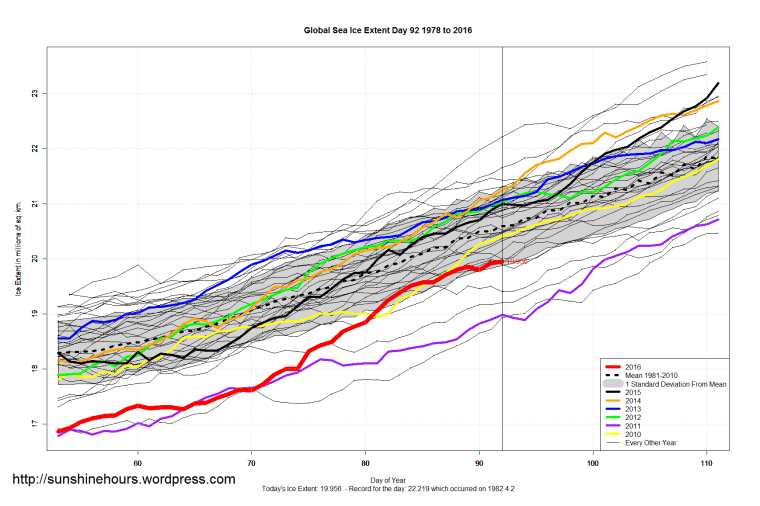
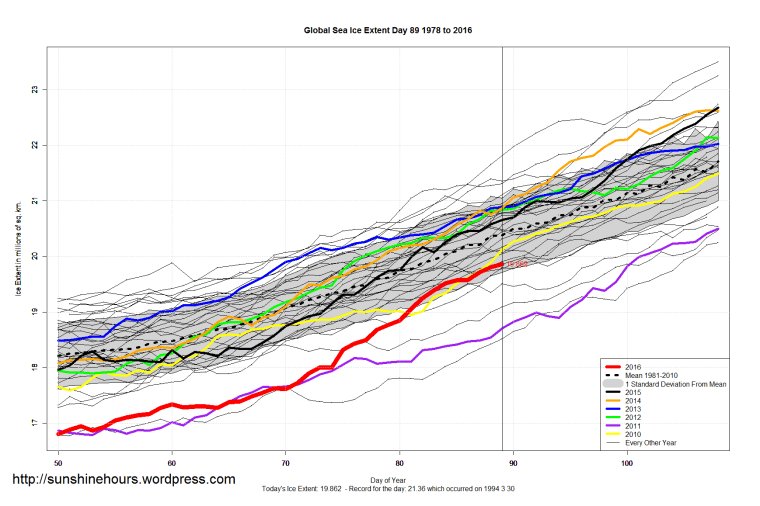
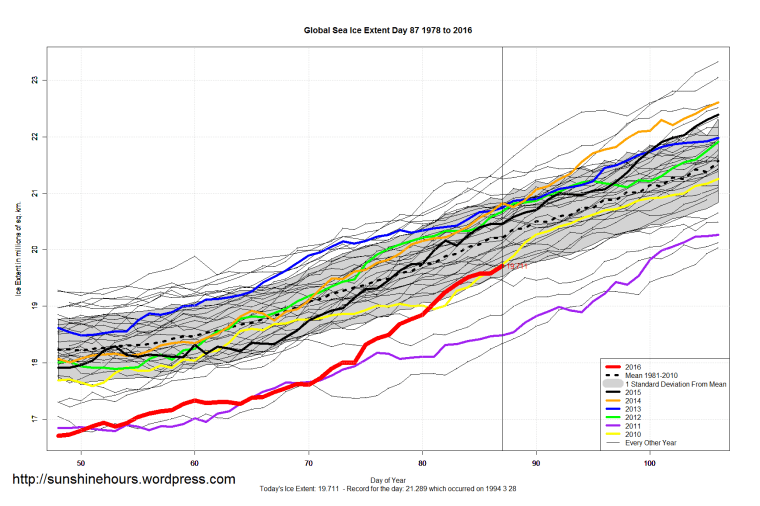
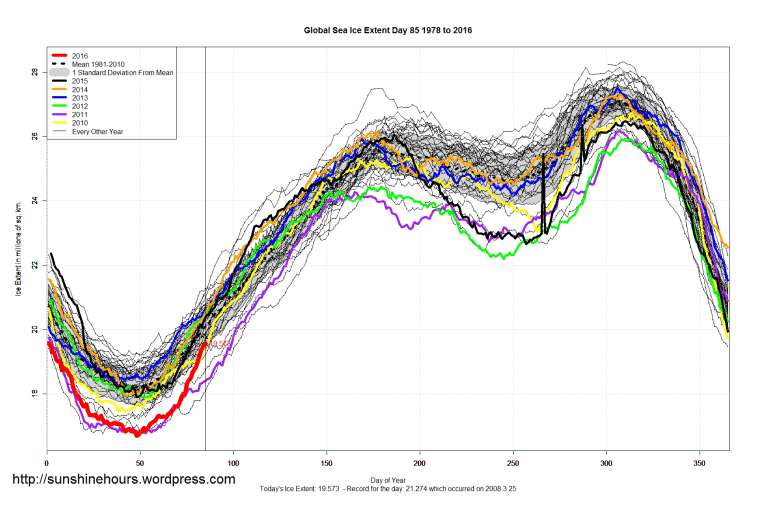
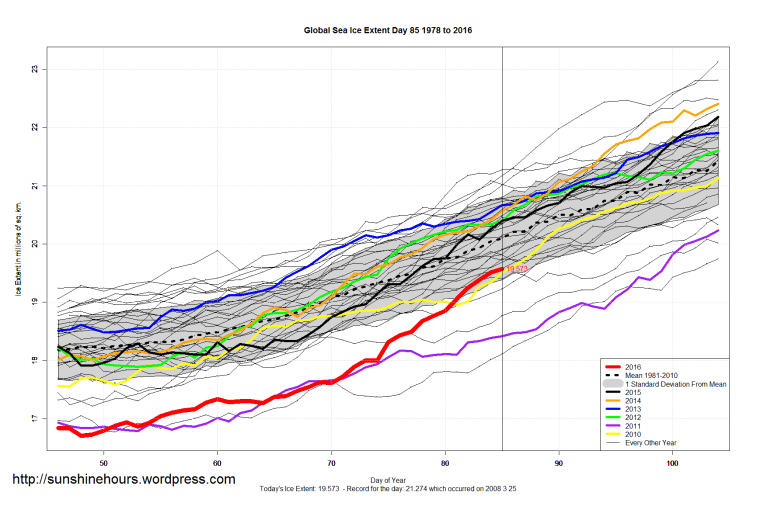
Global Sea Ice is inside the one standard deviation mark.

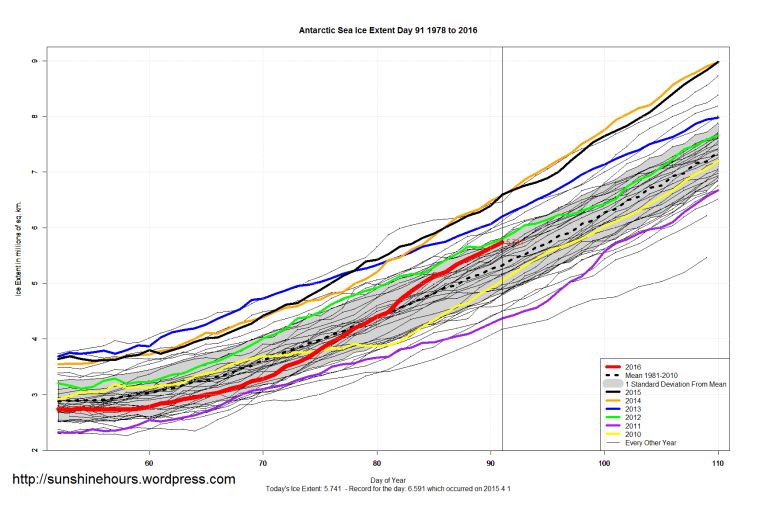
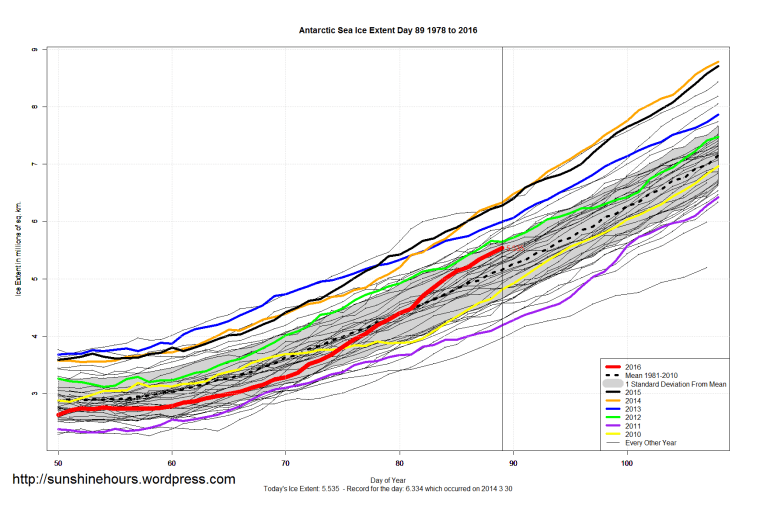
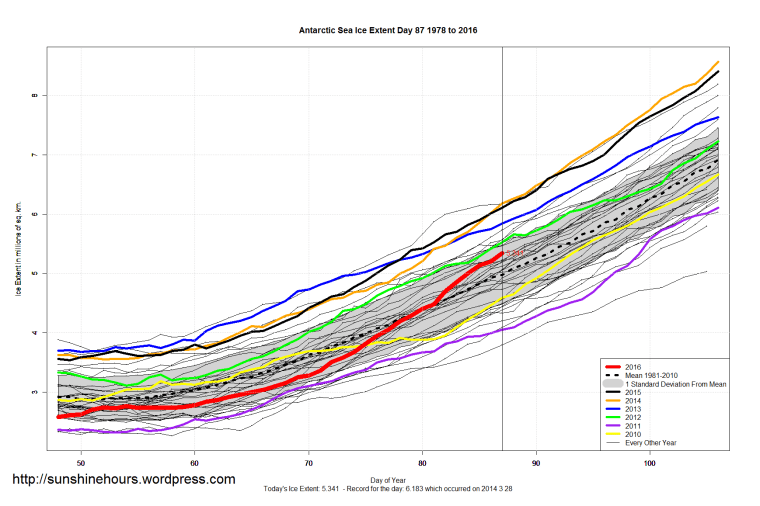
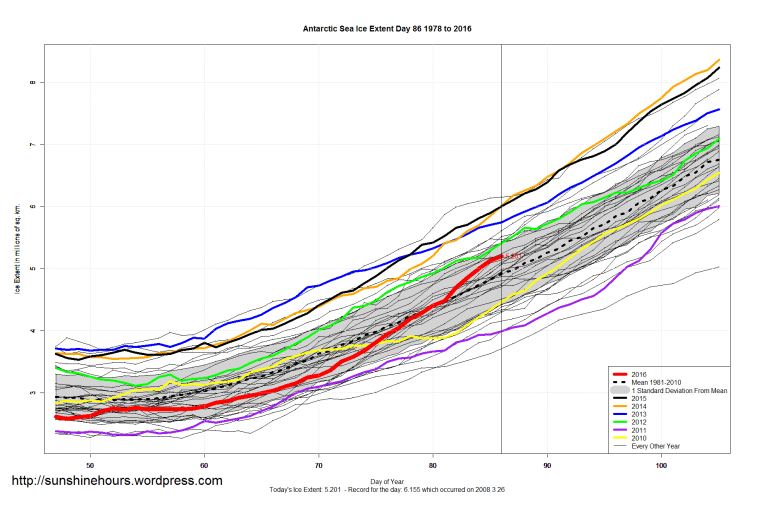
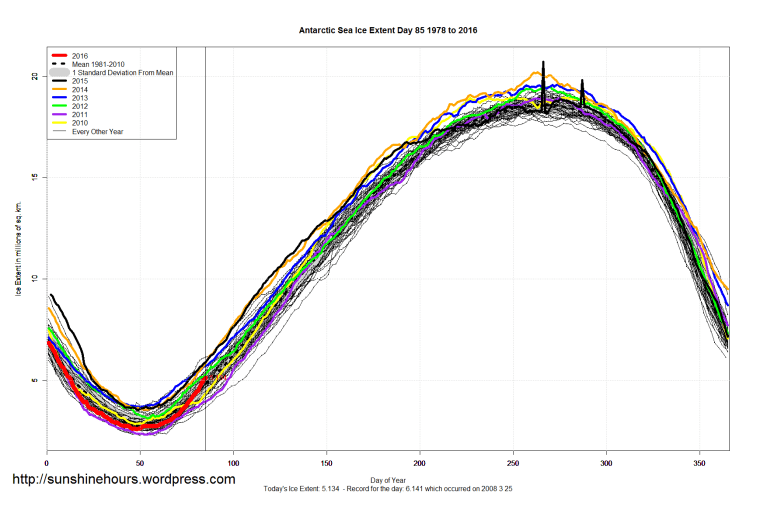
Antarctic Sea Ice is approaching the above one standard mean mark.

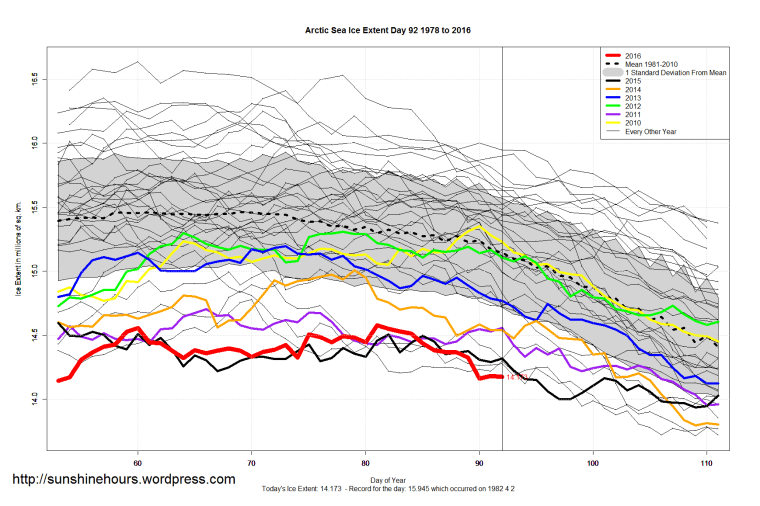
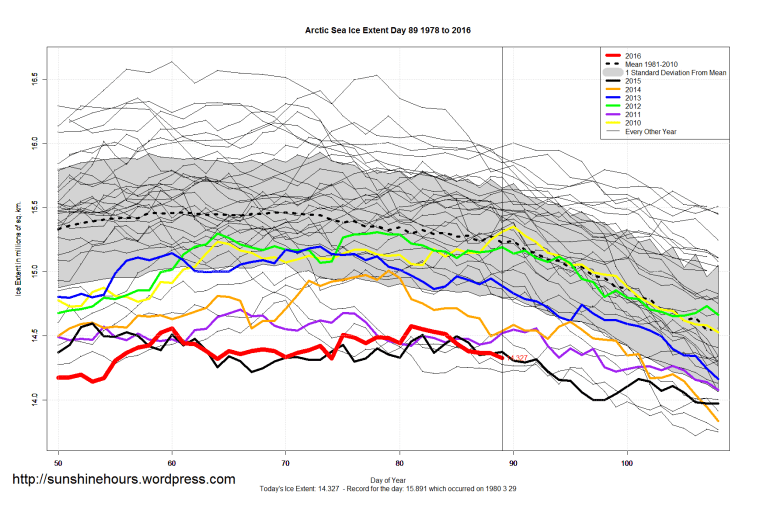
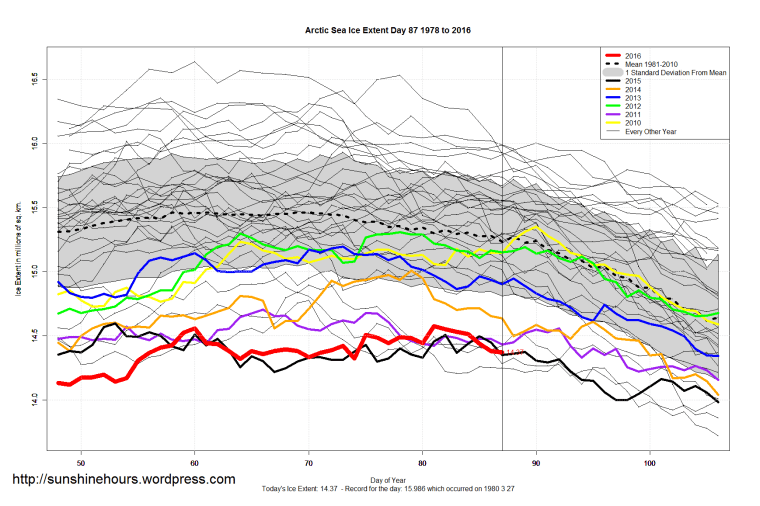
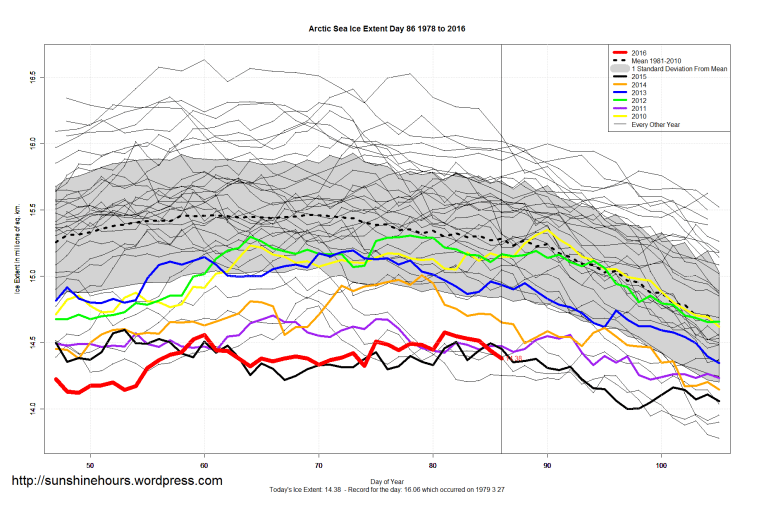
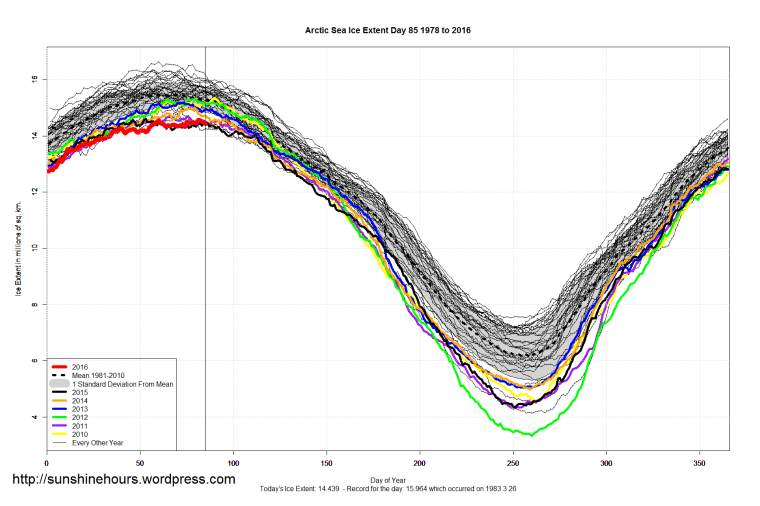
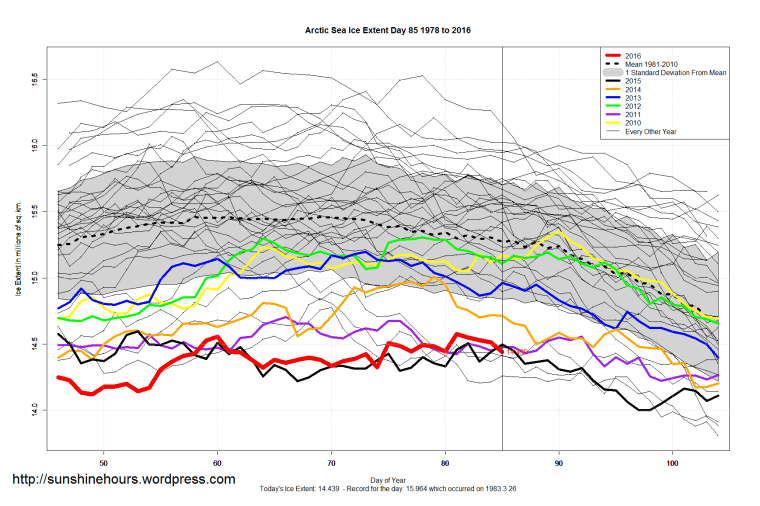
I’m pretty sure Arctic Sea Ice no longer has any chance of changing the maximum for 2016 and therefore will set the record for lowest maximum (NSIDC) by about 20,000 sq km (MASIE disagrees).

Global_Sea_Ice_Extent_Zoomed_2016_Day_88_1981-2010 Antarctic_Sea_Ice_Extent_Zoomed_2016_Day_88_1981-2010 Arctic_Sea_Ice_Extent_Zoomed_2016_Day_88_1981-2010

South / North

Sea Ice Extent (Global Antarctic and Arctic) – Day 85 – 2016

Global Sea Ice is well inside the one standard deviation mark.

Antarctic Sea Ice is well above the mean.

Global_Sea_Ice_Extent_2016_Day_85_1981-2010 Global_Sea_Ice_Extent_Zoomed_2016_Day_85_1981-2010 Antarctic_Sea_Ice_Extent_2016_Day_85_1981-2010 Antarctic_Sea_Ice_Extent_Zoomed_2016_Day_85_1981-2010 Arctic_Sea_Ice_Extent_2016_Day_85_1981-2010 Arctic_Sea_Ice_Extent_Zoomed_2016_Day_85_1981-2010

South / North