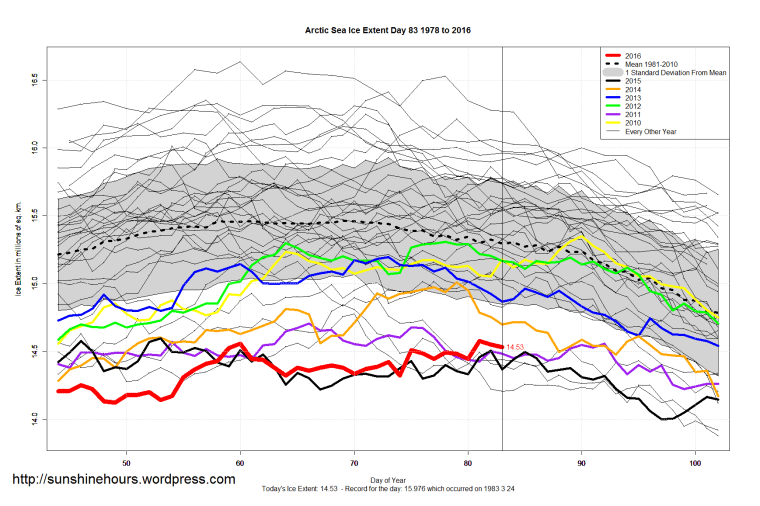
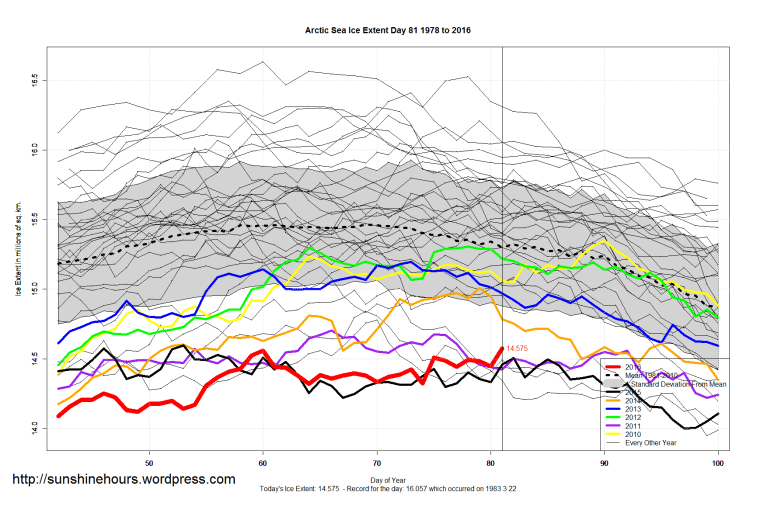
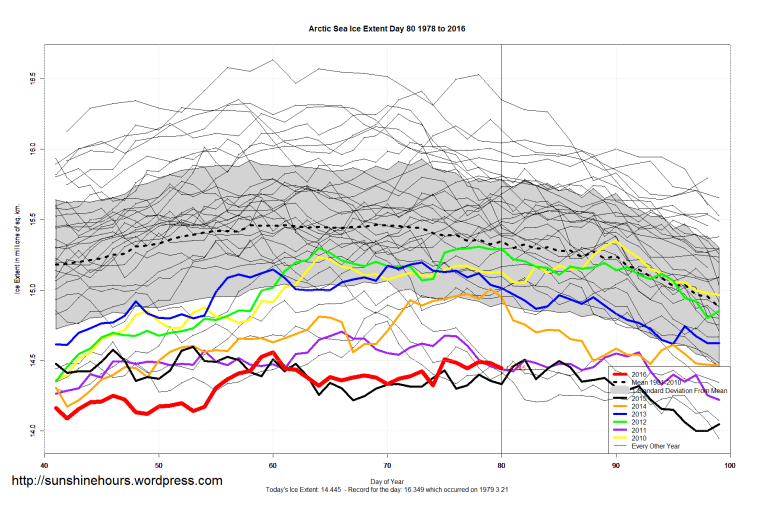
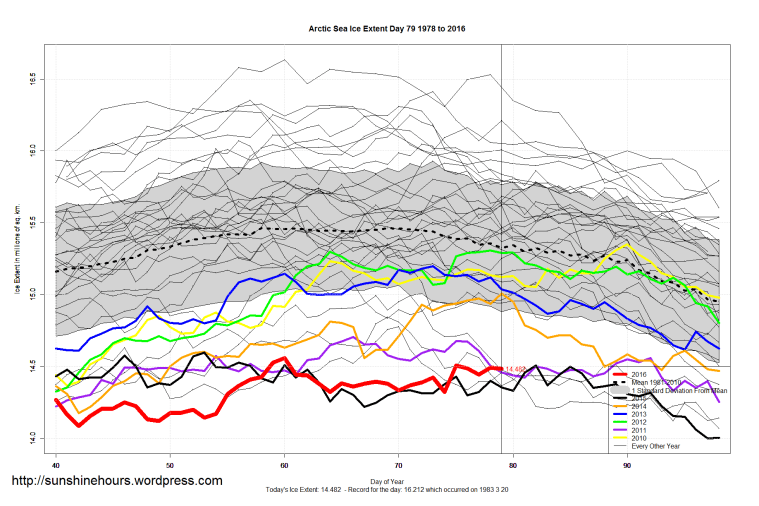
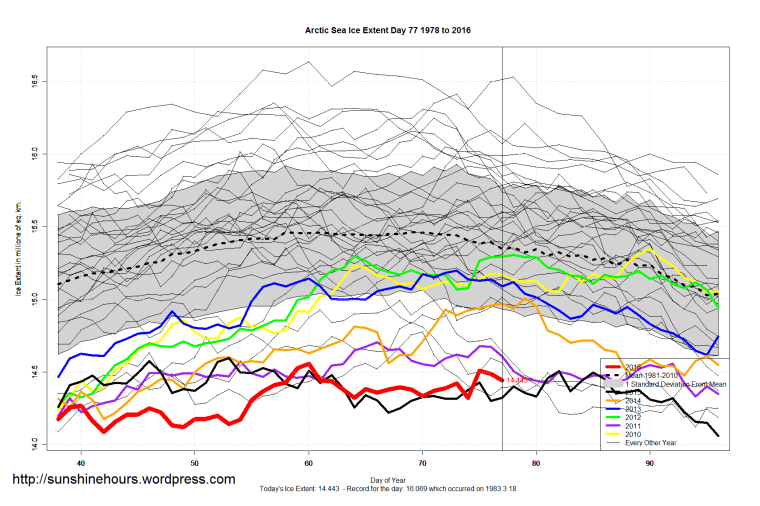
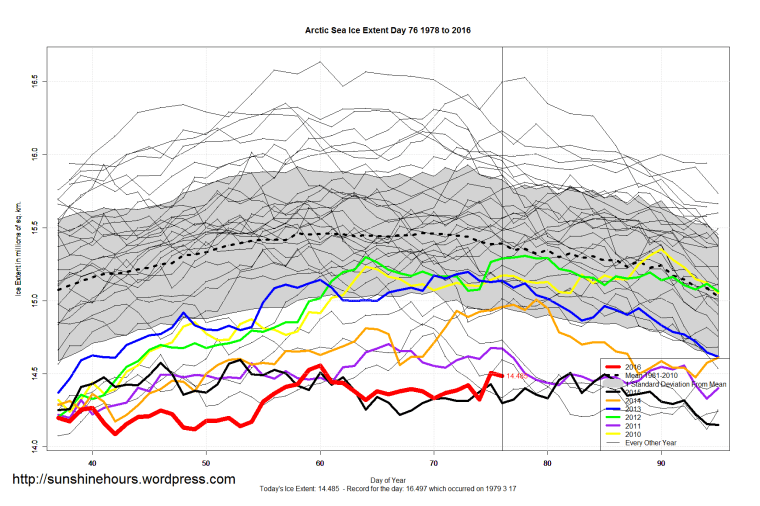
Arctic Sea Ice is just bouncing along at the same level its been for 30 days.
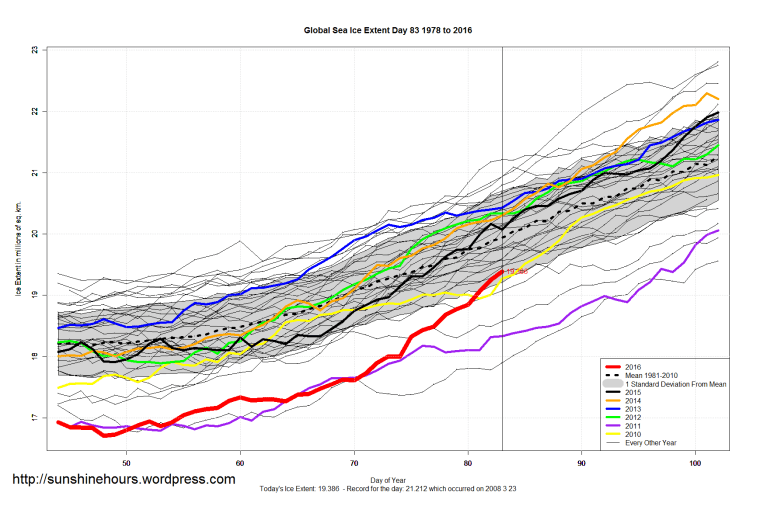
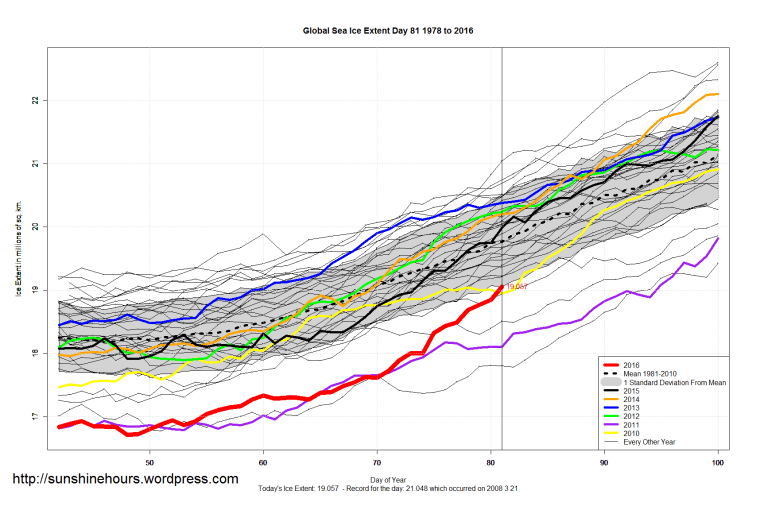
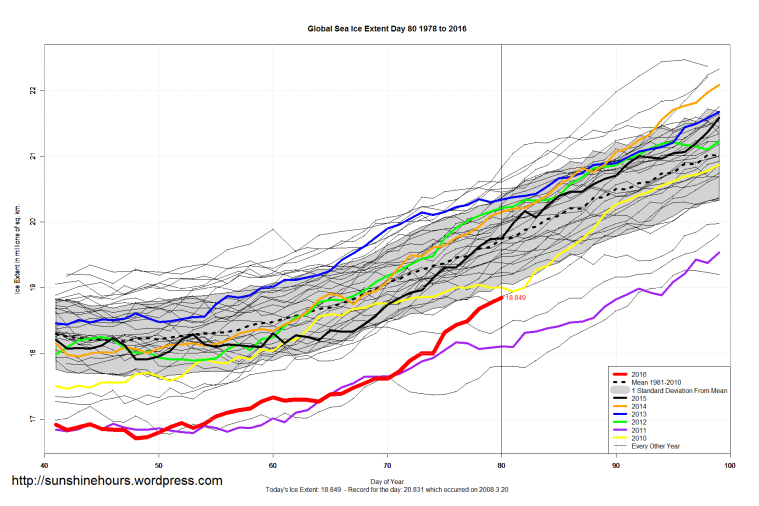
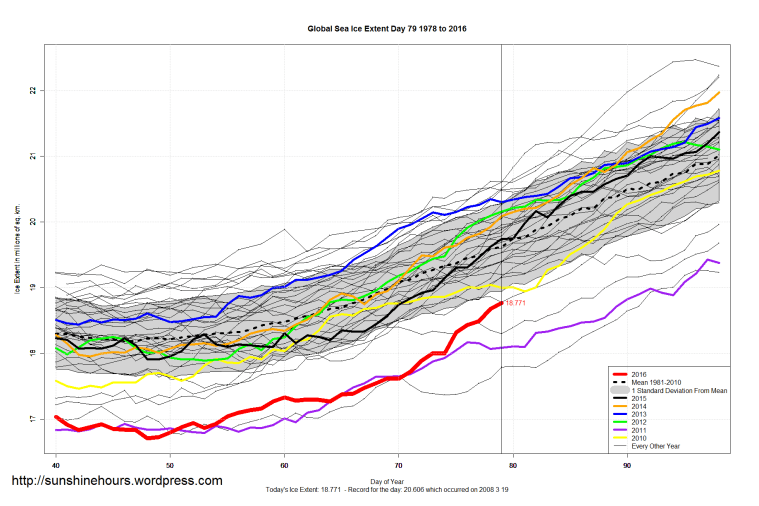
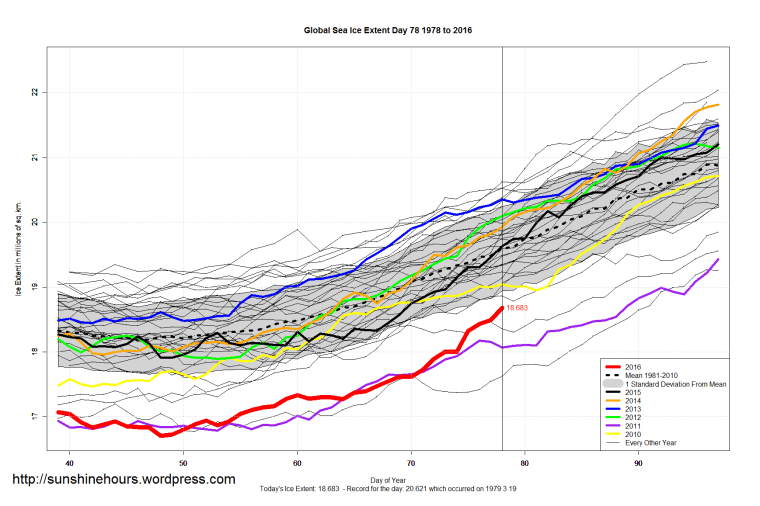
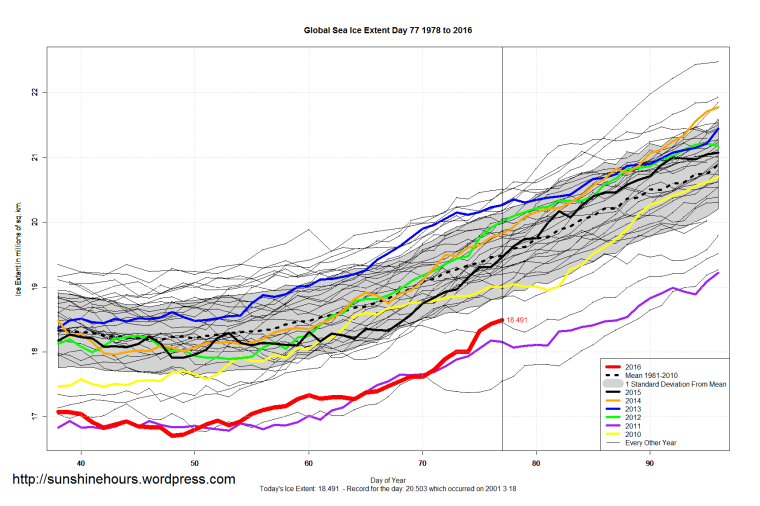
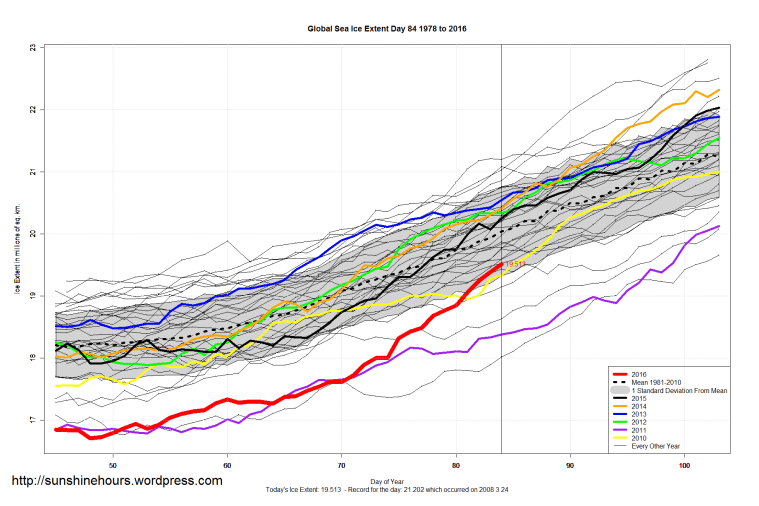
Global Sea Ice is well inside the one standard deviation mark.
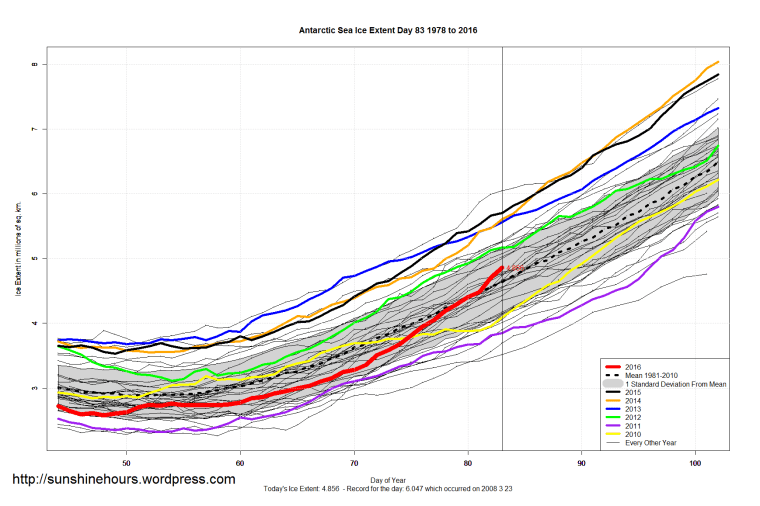
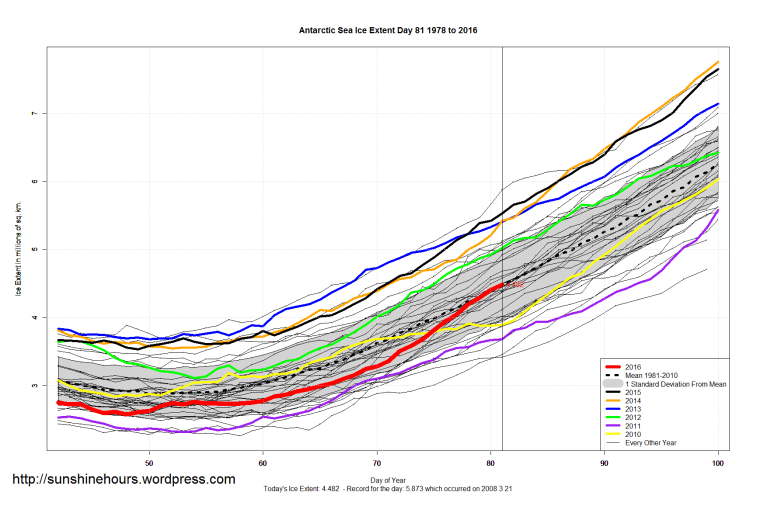
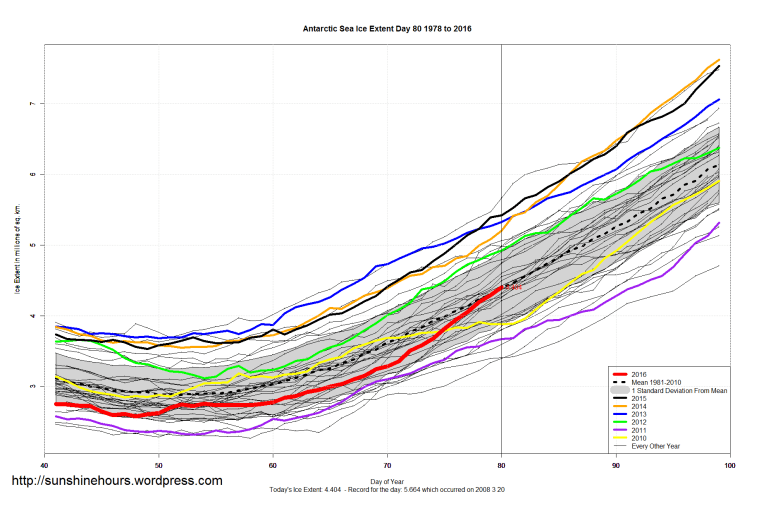
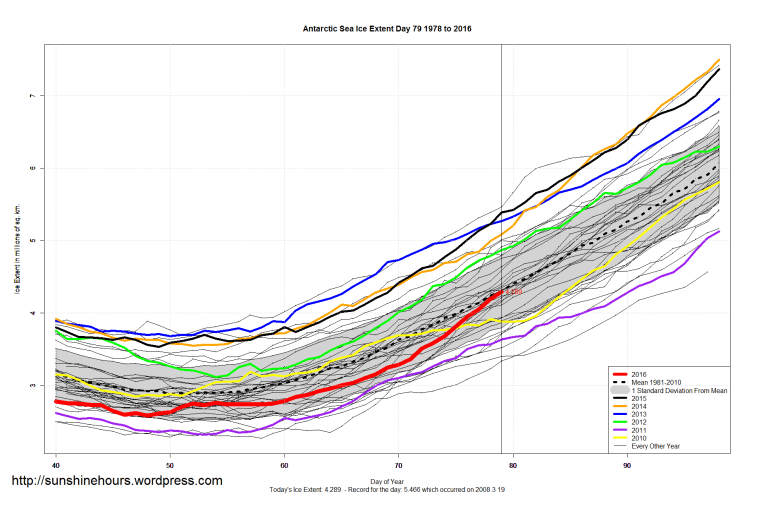
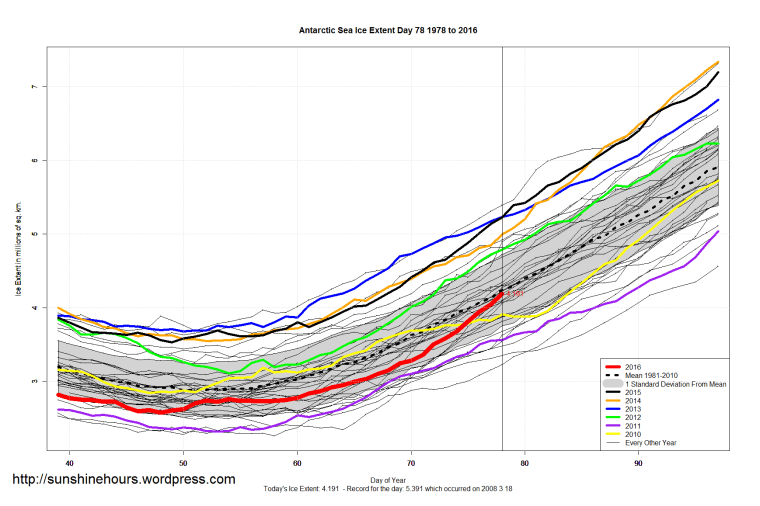
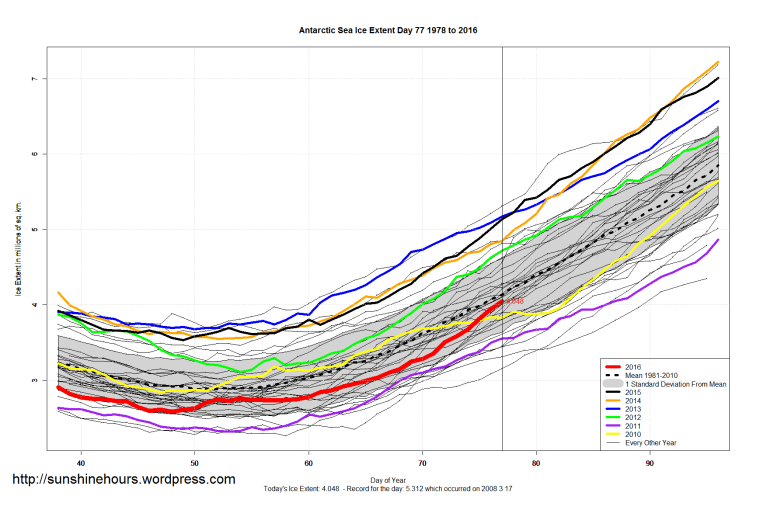
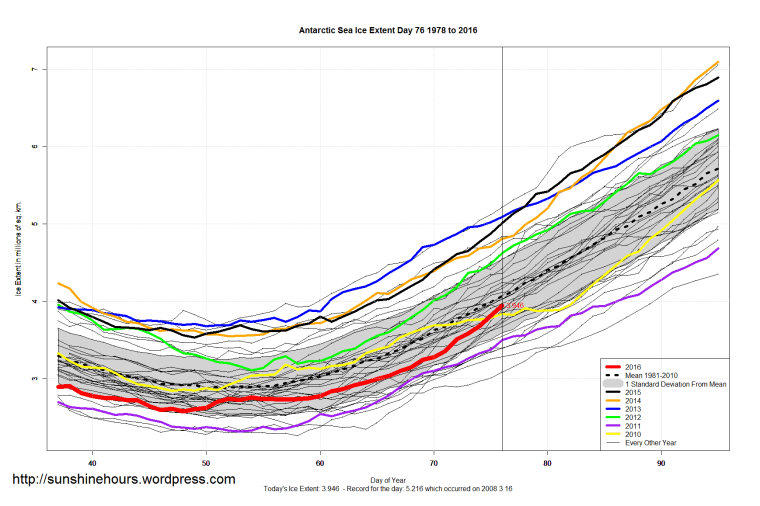
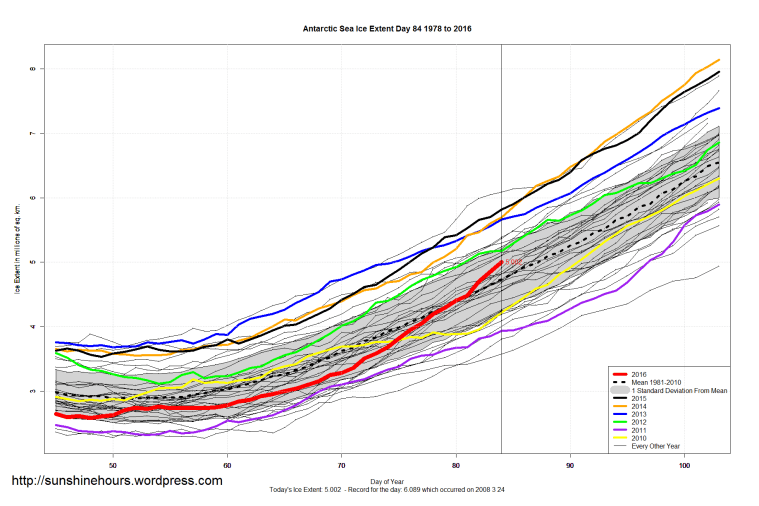
Antarctic Sea Ice is well above the mean.
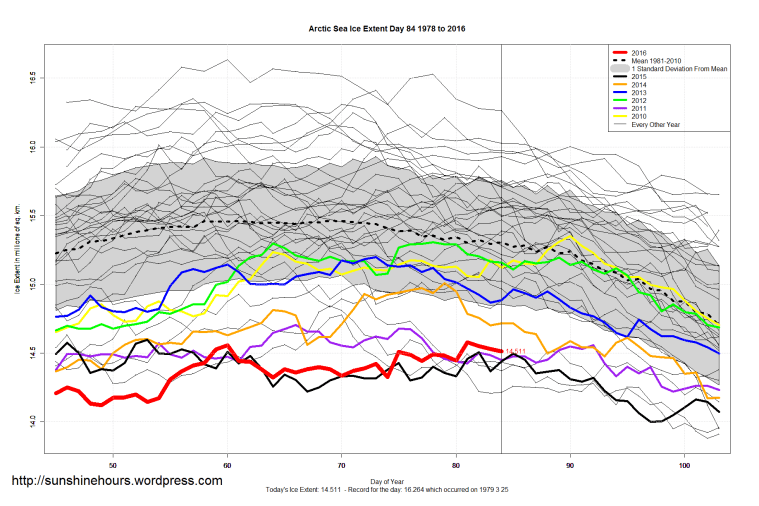
There have been many online articles predicting Arctic Sea Ice doom in the last week.
My favorite quote is: “Scientists warn that the area covered by this winter’s Arctic sea ice could turn out to be the lowest ever measured.”
Total nonsense. In fact, as of day 83 Arctic Sea Ice extent is higher than it was in 2005, 2006, 2007, 2011 and 2015.
The record that may be set (maybe not since there is still a week or so to go before day 90 which is the latest maximum) is lowest maximum.
The record may be broken by 20,000 sq km. Out of 14,000,000 sq km. 0.14%
And MASIE (a different method) has 2016’s maximum 400,000 sq km HIGHER than 2006. (MASIE only goes back to 2006)
| Year | Min | Max | day of Max | day of Min |
| 2012 | 3368882.08 | 15821891.32 | 82 | 264 |
| 2008 | 4223400.12 | 15661926.25 | 72 | 265 |
| 2014 | 5066134.38 | 15523208.18 | 73 | 262 |
| 2013 | 4677324.53 | 15505010.03 | 73 | 260 |
| 2010 | 4716943.6 | 15,396,877.99 | 77 | 266 |
| 2009 | 4871392.35 | 15,326,130.68 | 62 | 254 |
| 2011 | 4302977.96 | 15,110,021.96 | 67 | 257 |
| 2016 | 13095244.88 | 15,077,599.37 | 61 | |
| 2015 | 4442258.23 | 14,910,198.98 | 62 | 260 |
| 2007 | 3986945.93 | 14,907,125.15 | 73 | 261 |
| 2006 | 5640540.95 | 14,663,037.37 | 69 | 267 |
NSIDC/NOAA data graph.