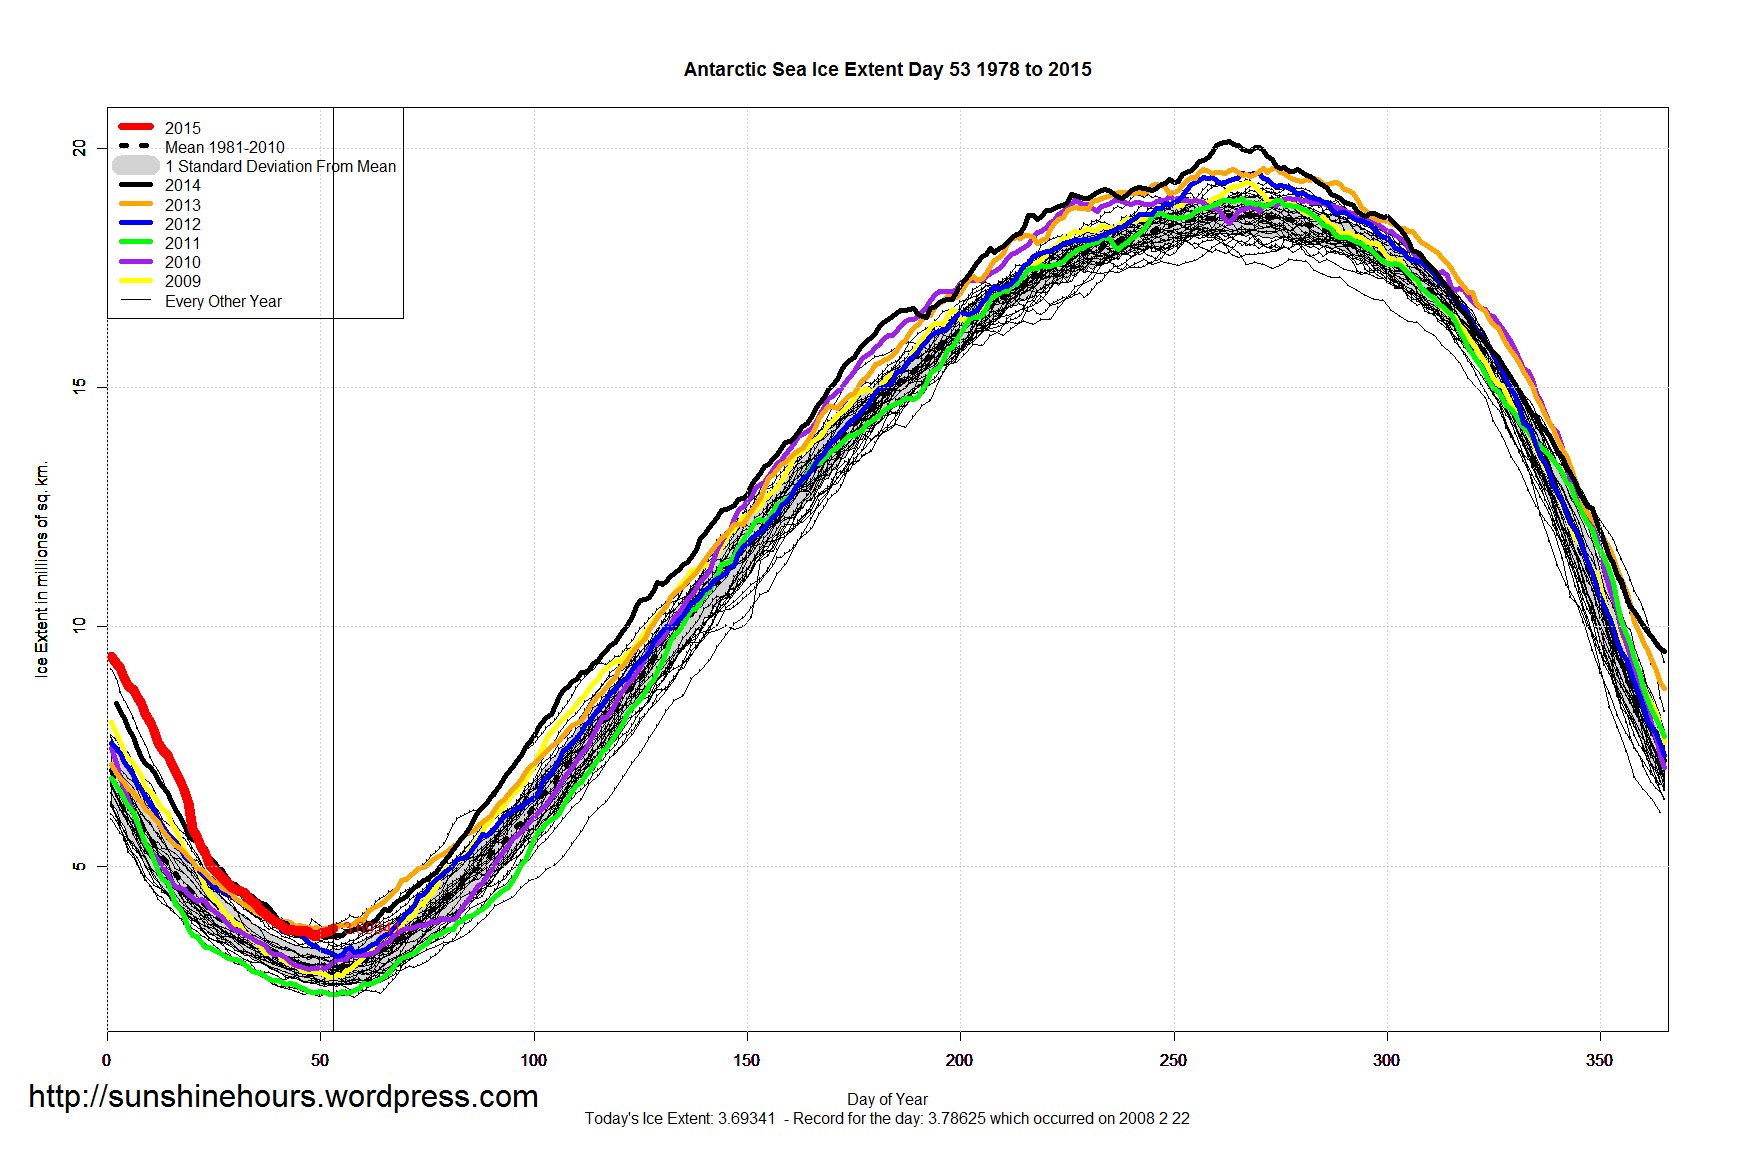
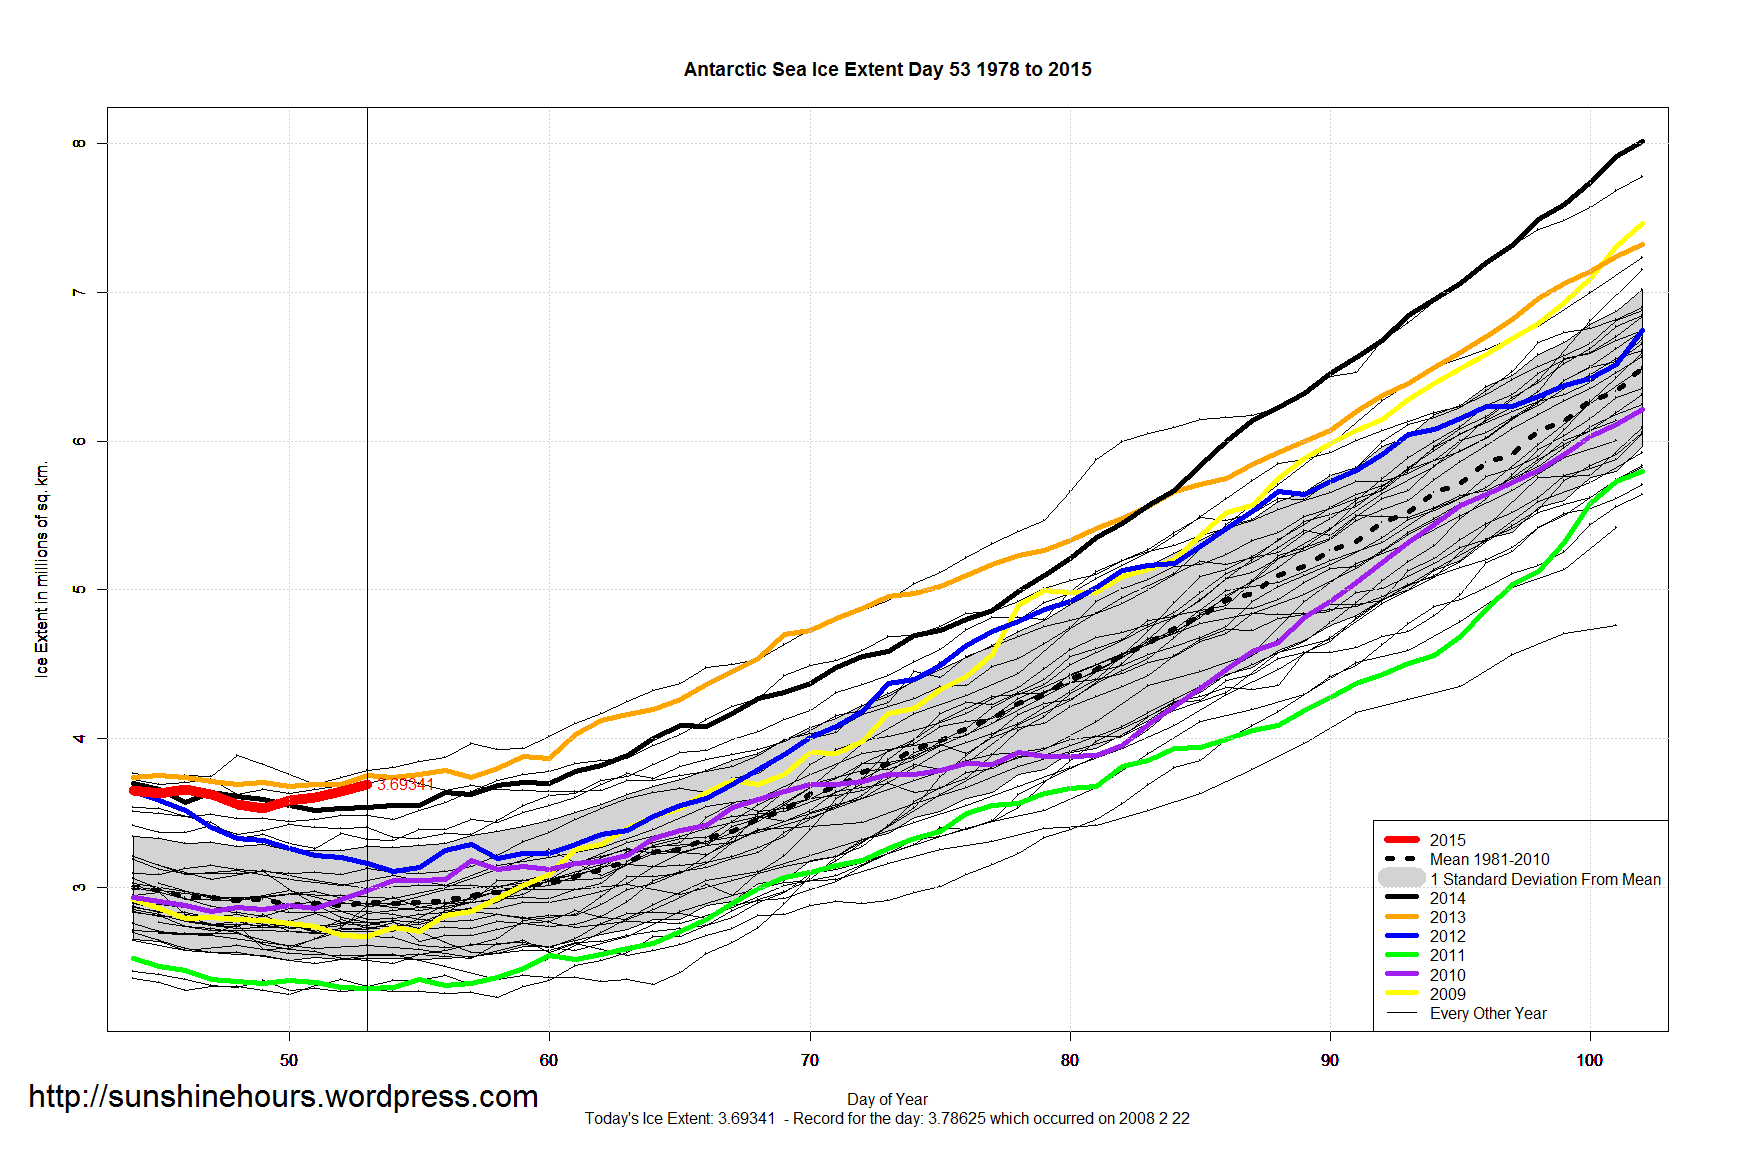
Antarctica Records – 2015 Probably Is 4th Highest Minimum
| Year | Min | Max | day of Max | day of Min | Avg Anomaly |
| 2008 | 3.69176 | 18.29726 | 247 | 51 | 0.6 |
| 2013 | 3.67897 | 19.60692 | 274 | 50 | 0.87 |
| 2003 | 3.6257 | 18.67907 | 268 | 48 | 0.32 |
| 2015 | 3.53244 | TBA | TBA | 49 | TBA |
| 2014 | 3.51506 | 20.14215 | 263 | 51 | 1.09 |
| 2001 | 3.44094 | 18.49324 | 271 | 50 | 0.02 |
| 1995 | 3.32988 | 18.7353 | 269 | 55 | 0.15 |
| 2004 | 3.25927 | 19.12341 | 252 | 51 | 0.32 |
| 2012 | 3.11109 | 19.47713 | 266 | 54 | 0.36 |
| 1994 | 3.08286 | 18.8266 | 243 | 43 | 0.12 |
| 1987 | 3.01642 | 18.52332 | 258 | 52 | -0.24 |
| 1986 | 2.95395 | 18.02672 | 261 | 65 | -0.55 |
| 1979 | 2.91521 | 18.36699 | 256 | 48 | 0.04 |
| 1982 | 2.8927 | 18.55004 | 246 | 52 | -0.02 |
| 1983 | 2.84656 | 18.81042 | 263 | 55 | -0.25 |
| 2010 | 2.8422 | 18.9968 | 249 | 47 | 0.45 |
| 2005 | 2.80387 | 19.29451 | 272 | 49 | 0.04 |
| 1990 | 2.78435 | 18.3788 | 273 | 53 | -0.24 |
| 1998 | 2.7715 | 19.2433 | 258 | 56 | 0.08 |
| 1989 | 2.7229 | 18.27368 | 266 | 51 | -0.23 |
| 2007 | 2.7227 | 19.08545 | 272 | 50 | 0.03 |
| 1999 | 2.70723 | 18.98068 | 273 | 51 | 0.11 |
| 2002 | 2.69691 | 18.11556 | 252 | 51 | -0.43 |
| 1981 | 2.69524 | 18.85906 | 261 | 51 | -0.21 |
| 2009 | 2.67096 | 19.29864 | 267 | 53 | 0.39 |
| 1988 | 2.63862 | 18.78456 | 277 | 55 | -0.14 |
| 1985 | 2.60211 | 18.93215 | 254 | 50 | -0.04 |
| 1996 | 2.59733 | 18.83039 | 267 | 56 | 0.13 |
| 2000 | 2.58248 | 19.15817 | 272 | 49 | 0.11 |
| 1991 | 2.55355 | 18.66993 | 273 | 58 | -0.11 |
| 1980 | 2.52686 | 19.09137 | 267 | 57 | -0.39 |
| 1992 | 2.49238 | 18.4663 | 255 | 54 | -0.24 |
| 2006 | 2.4866 | 19.35934 | 264 | 51 | -0.19 |
| 1984 | 2.38292 | 18.37747 | 266 | 58 | -0.2 |
| 2011 | 2.31884 | 18.95328 | 266 | 53 | -0.15 |
| 1993 | 2.28078 | 18.709 | 263 | 50 | -0.23 |
| 1997 | 2.26415 | 18.79094 | 265 | 58 | -0.26 |
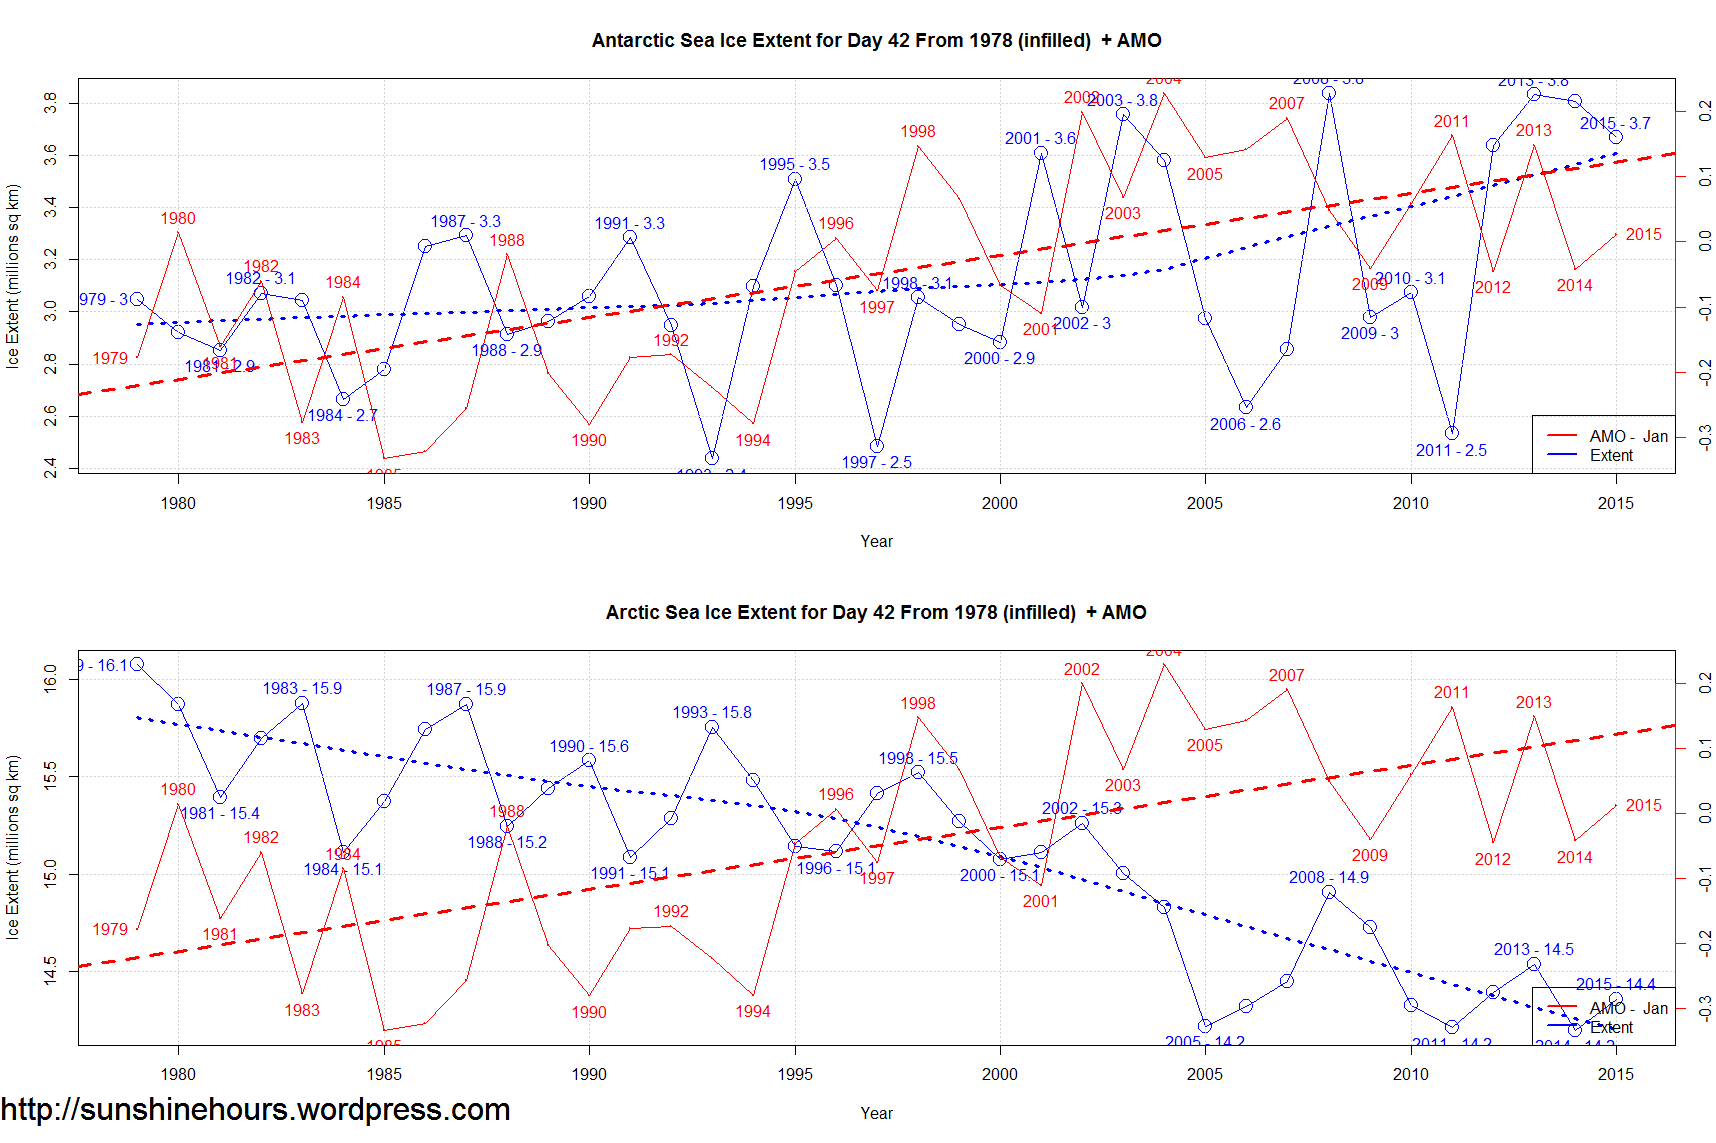
Update: I have added a graph at the top.
The red line is the AMO for January’s only. The blue lines are Antarctic Sea Ice (top) and Arctic Sea Ice (bottom) for just day 42.
Note that Antarctica follows the AMO. And the Arctic does the opposite of the AMO. And also the Arctic is a mirror of the Antarctic.
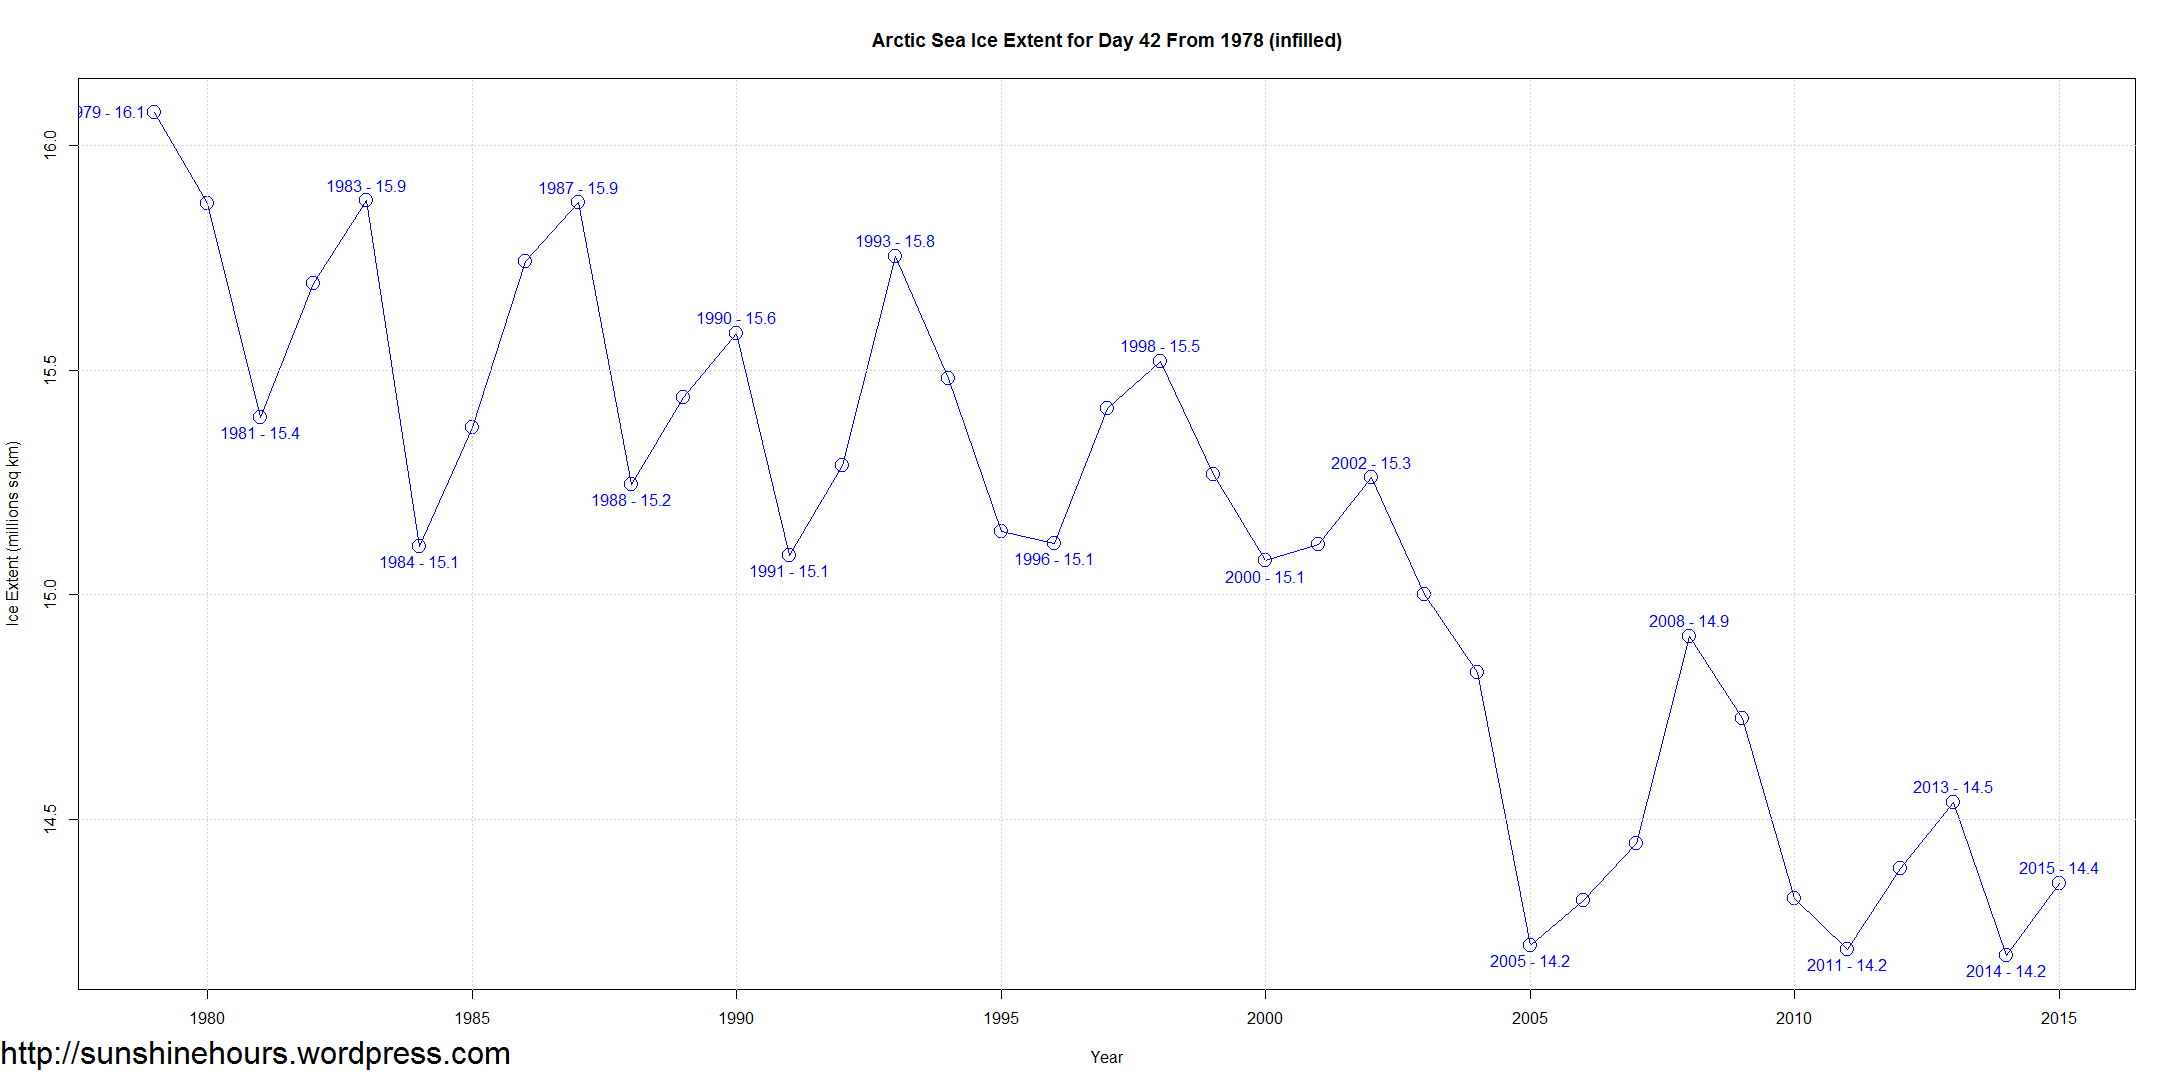
Note also that the January AMO has flattened out around 2005 which is when the Arctic at this time of year bottomed out.
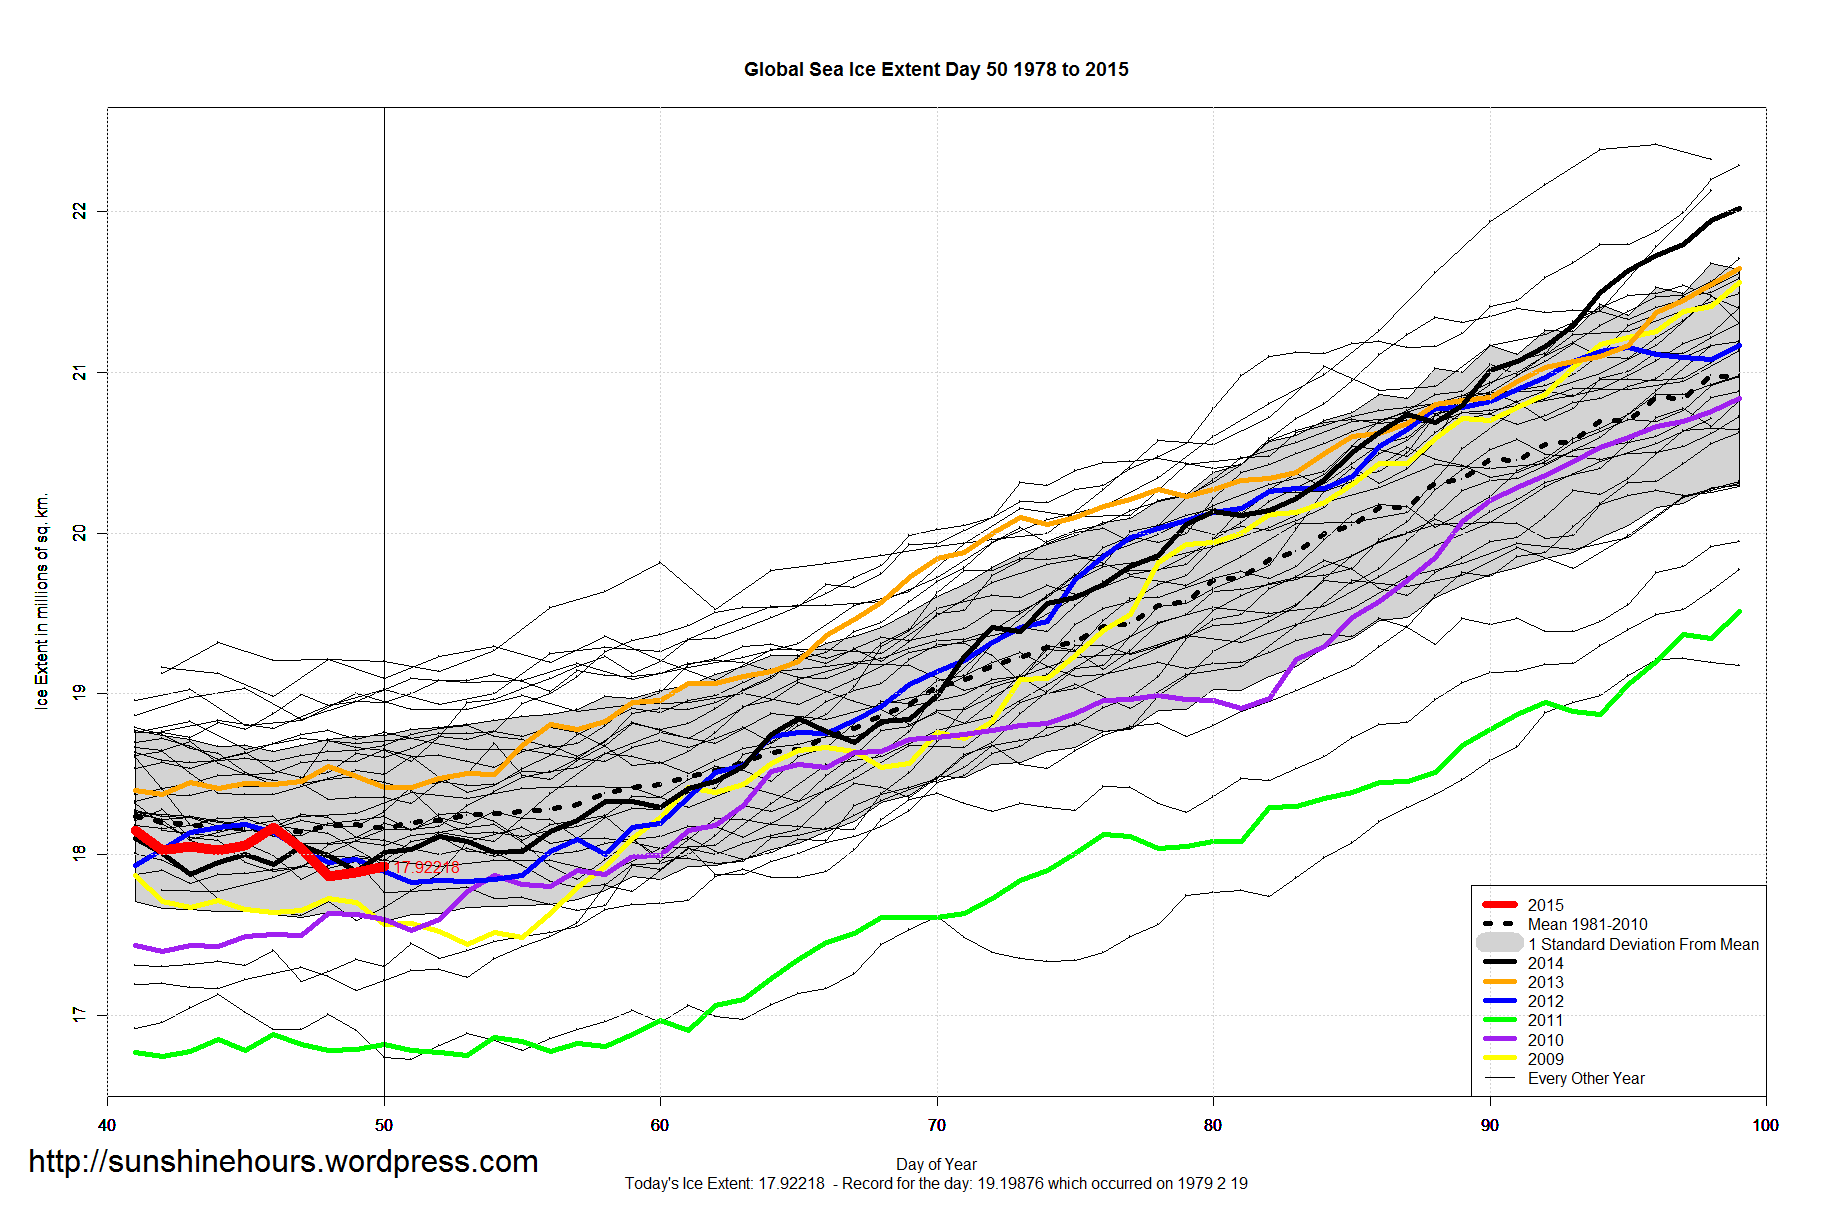
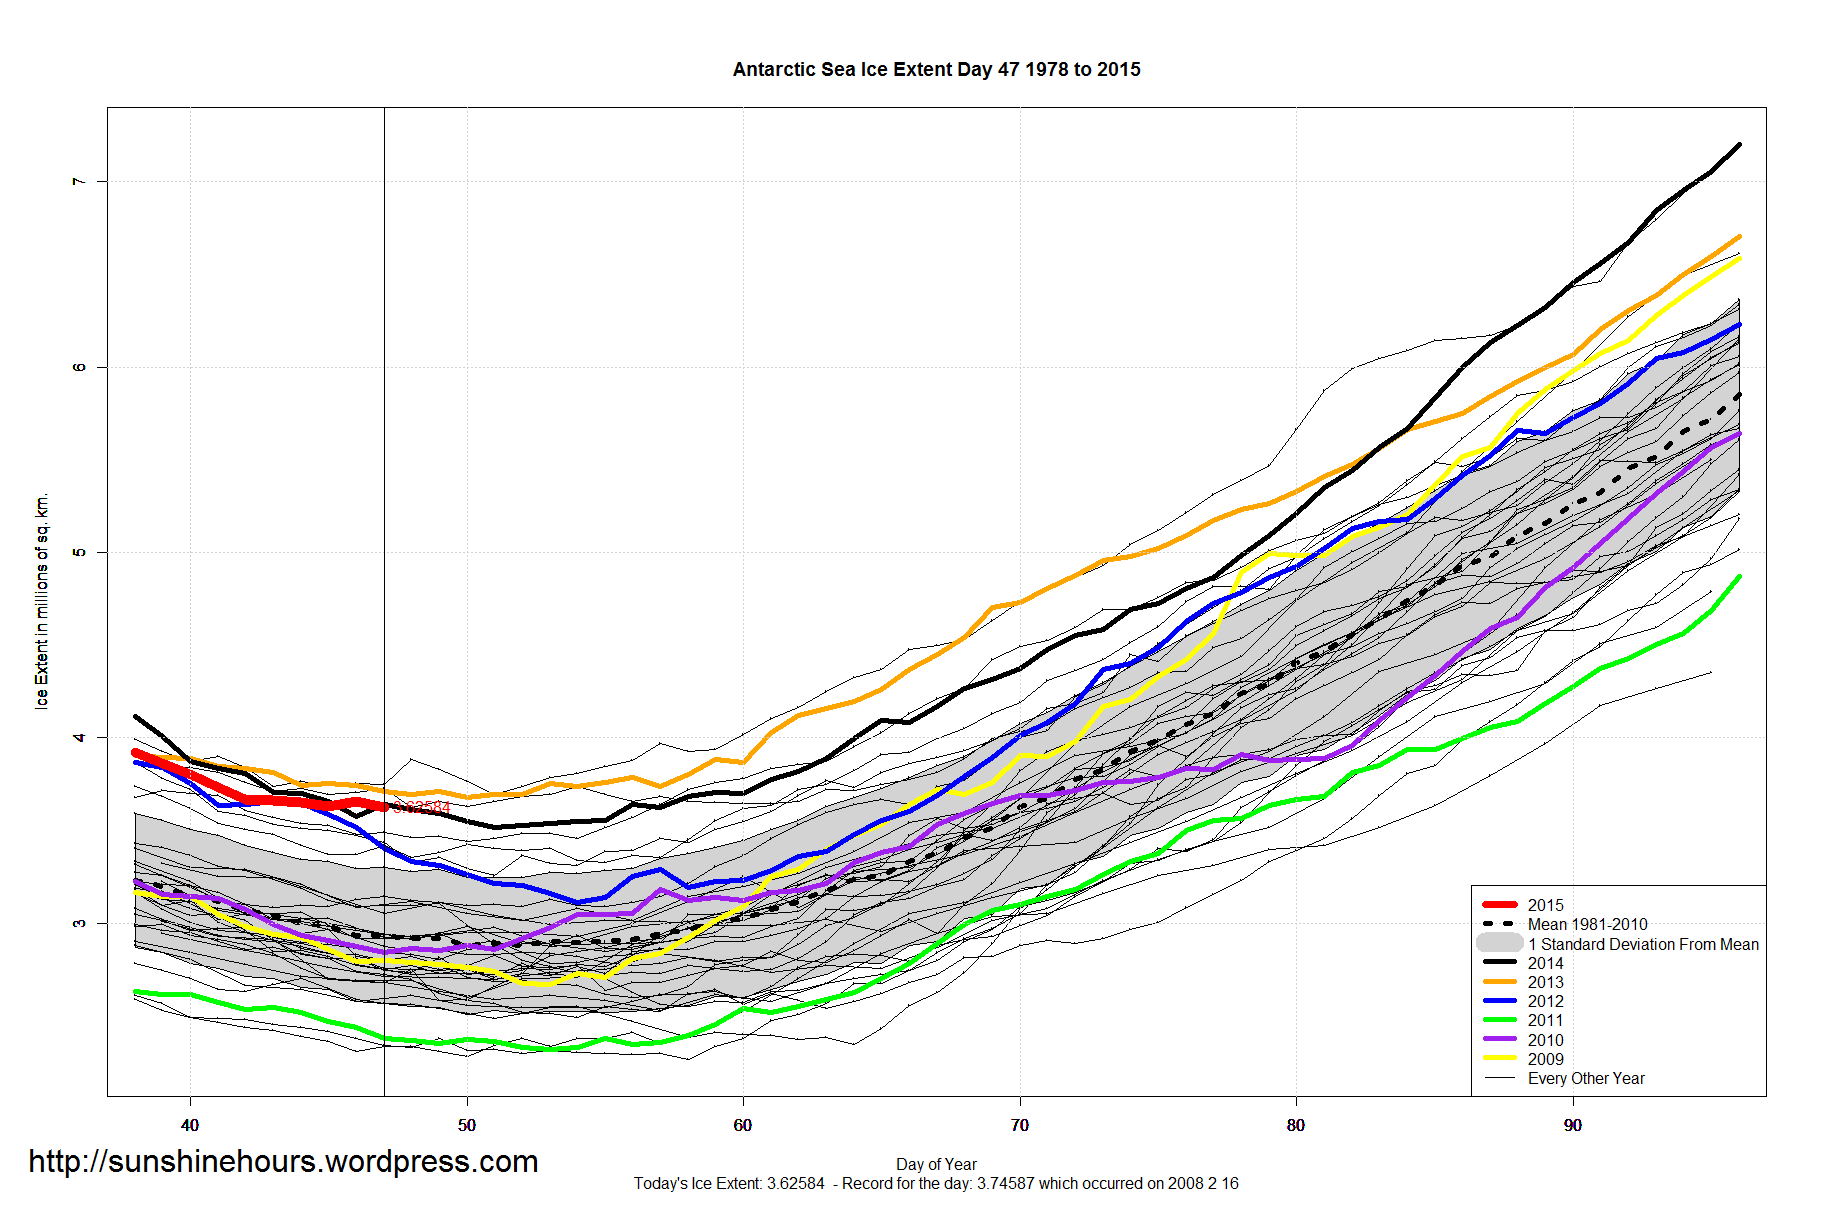
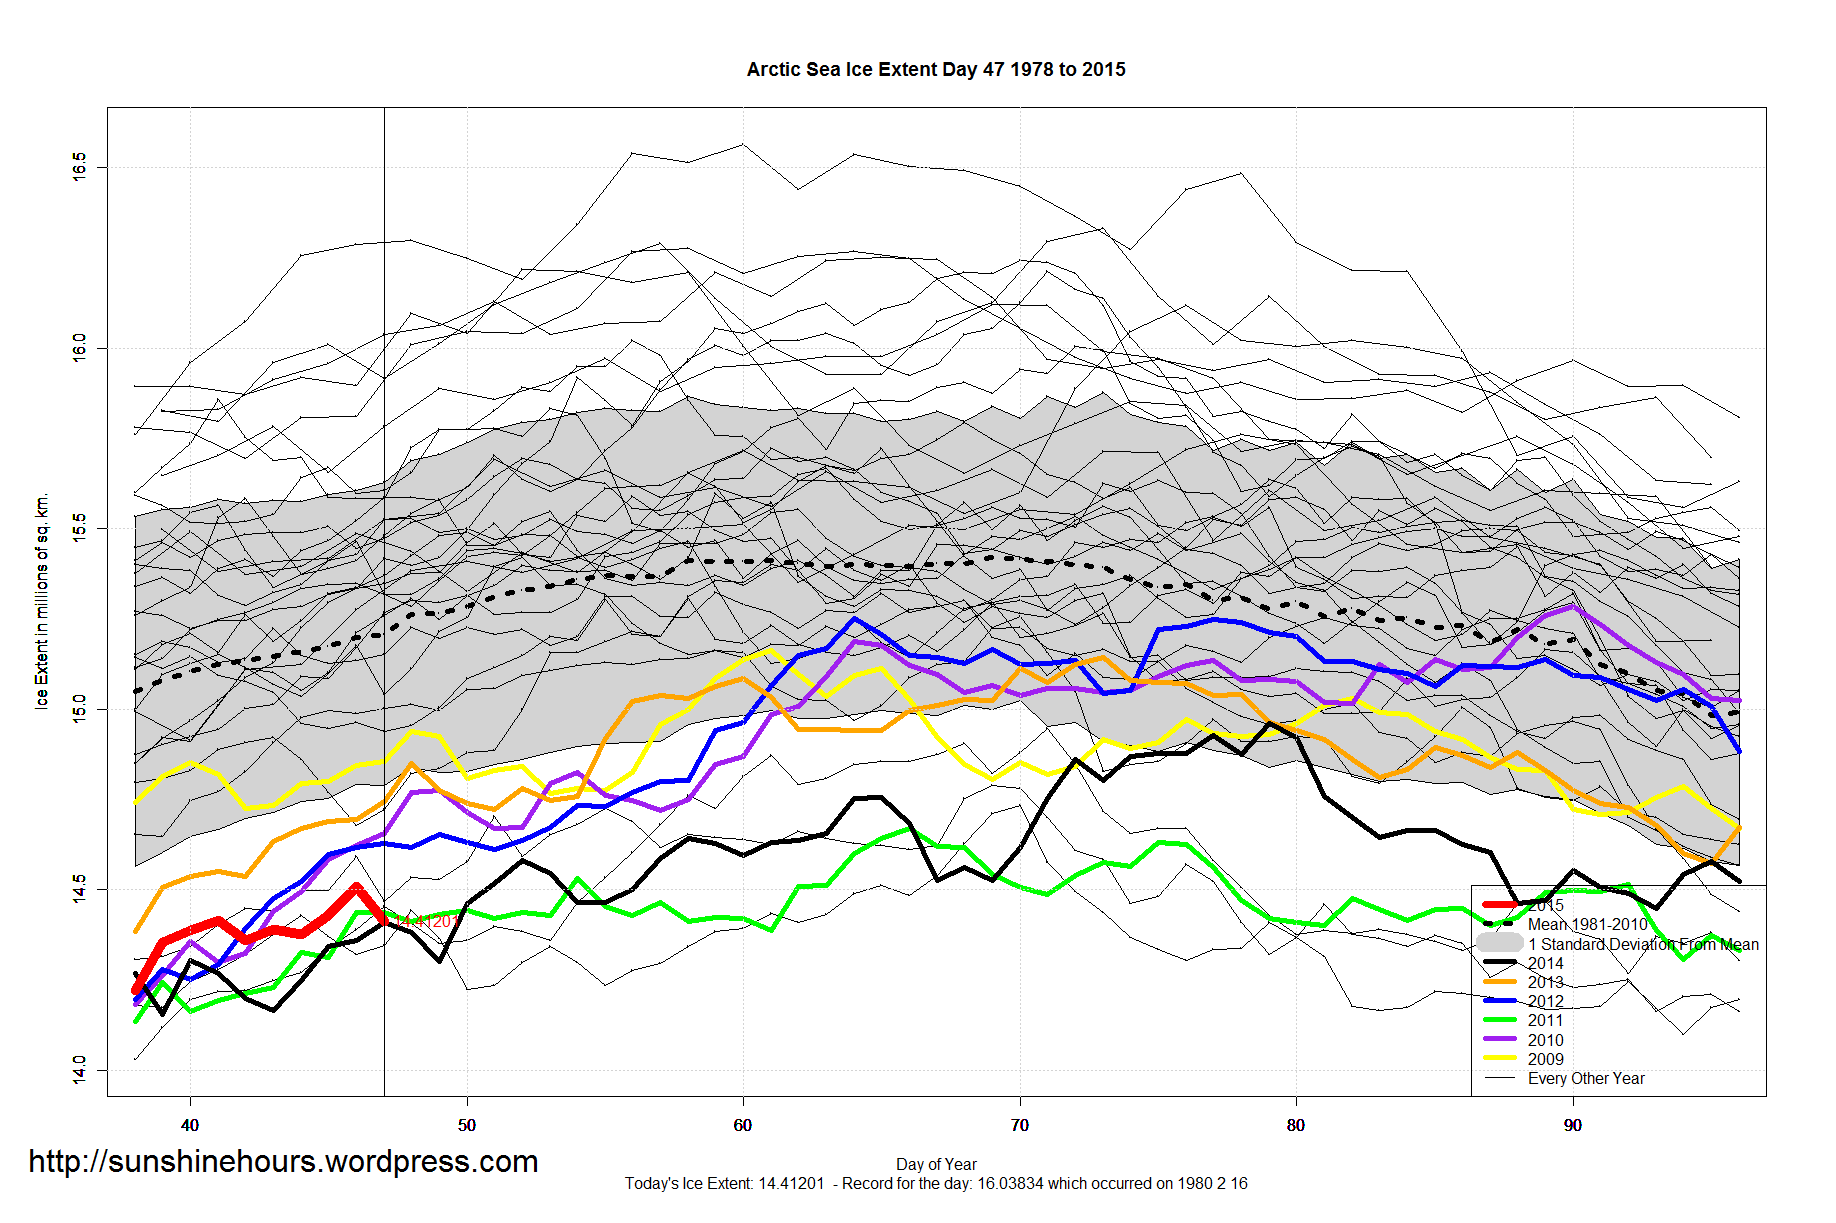
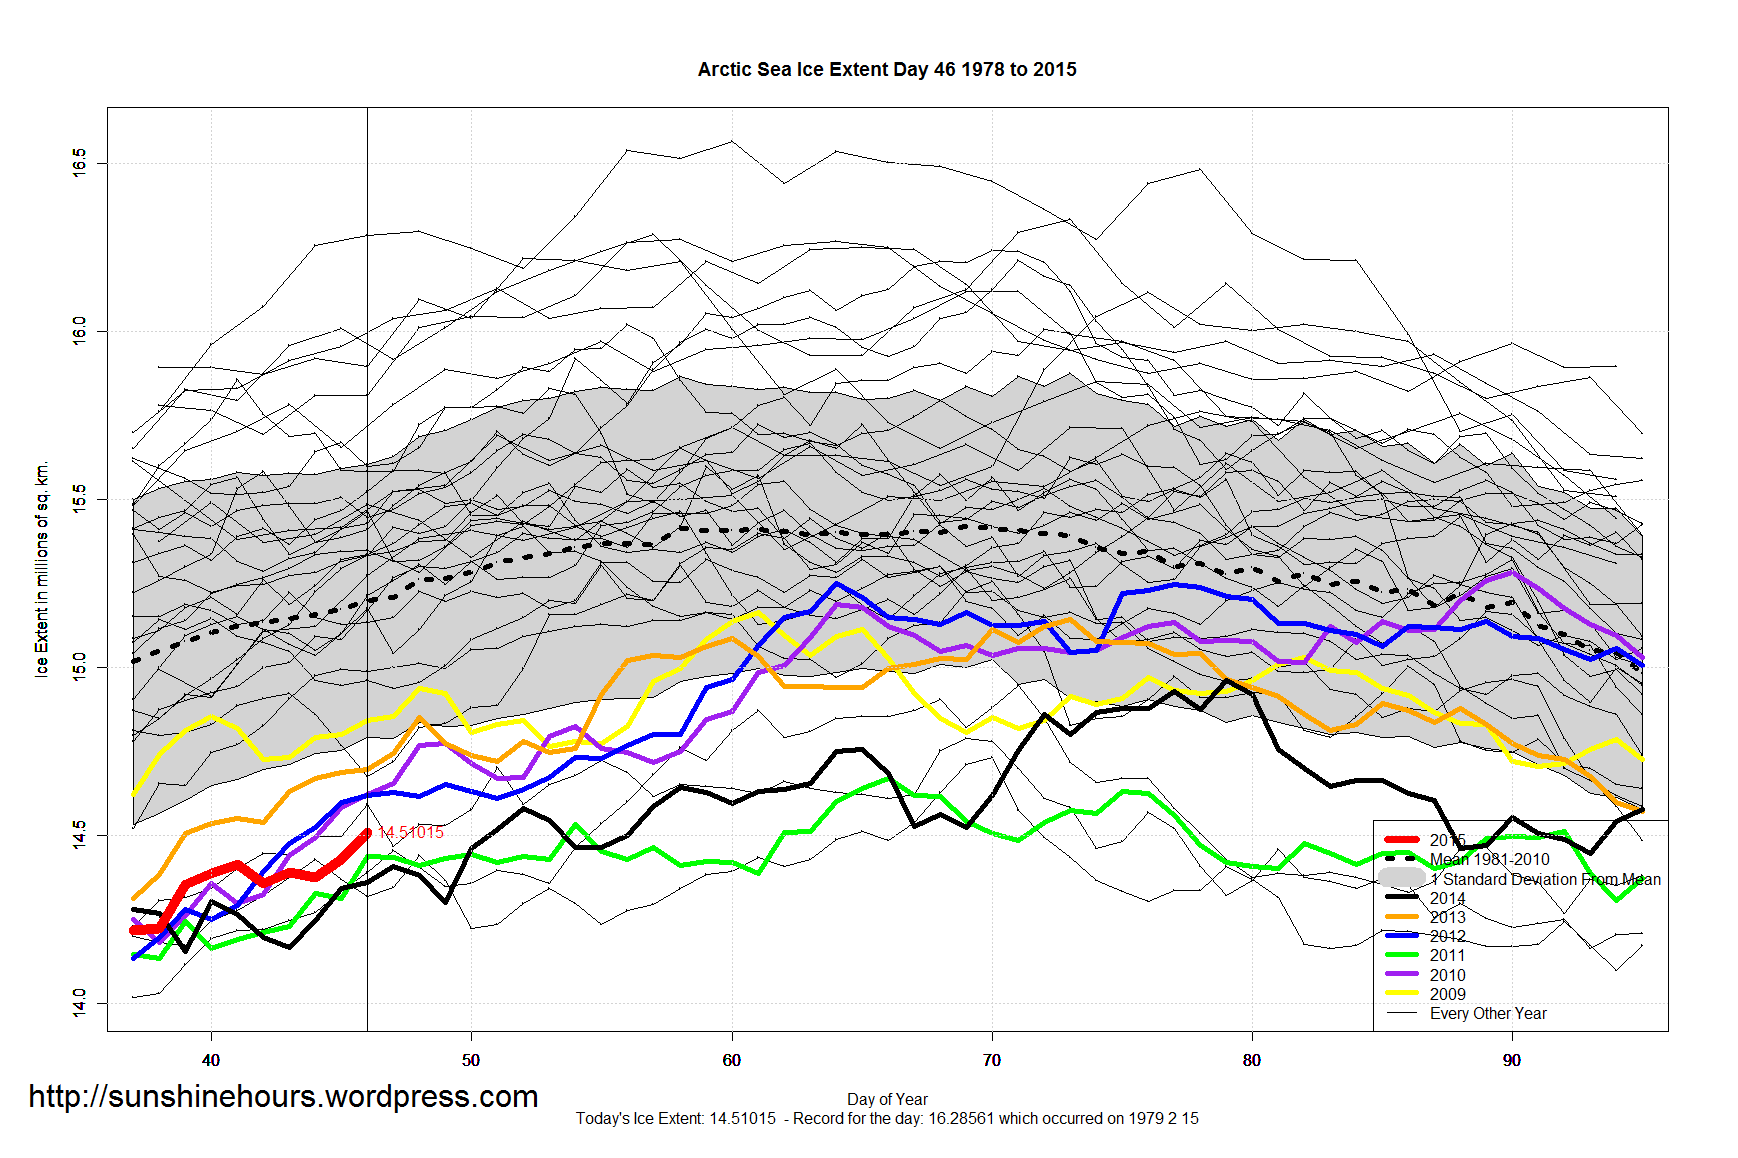
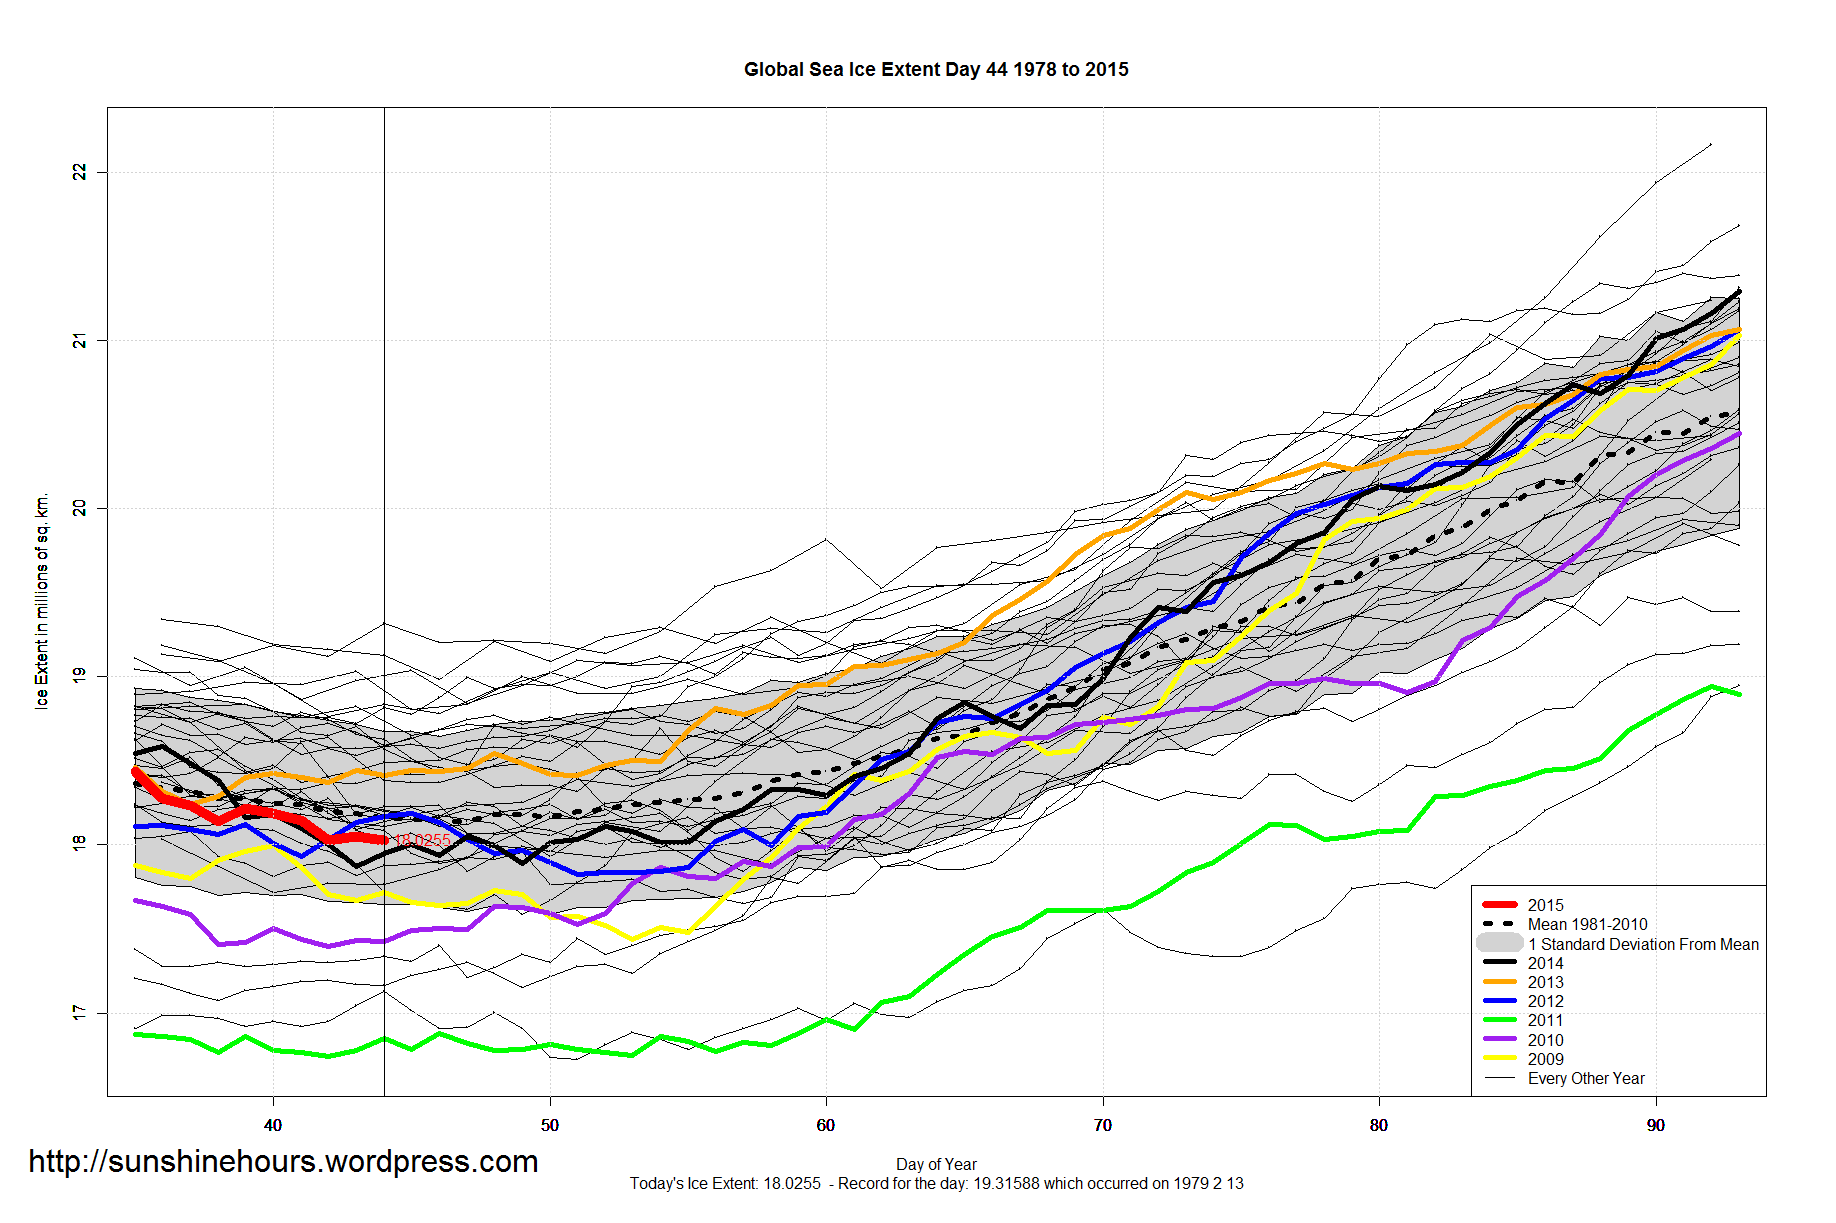
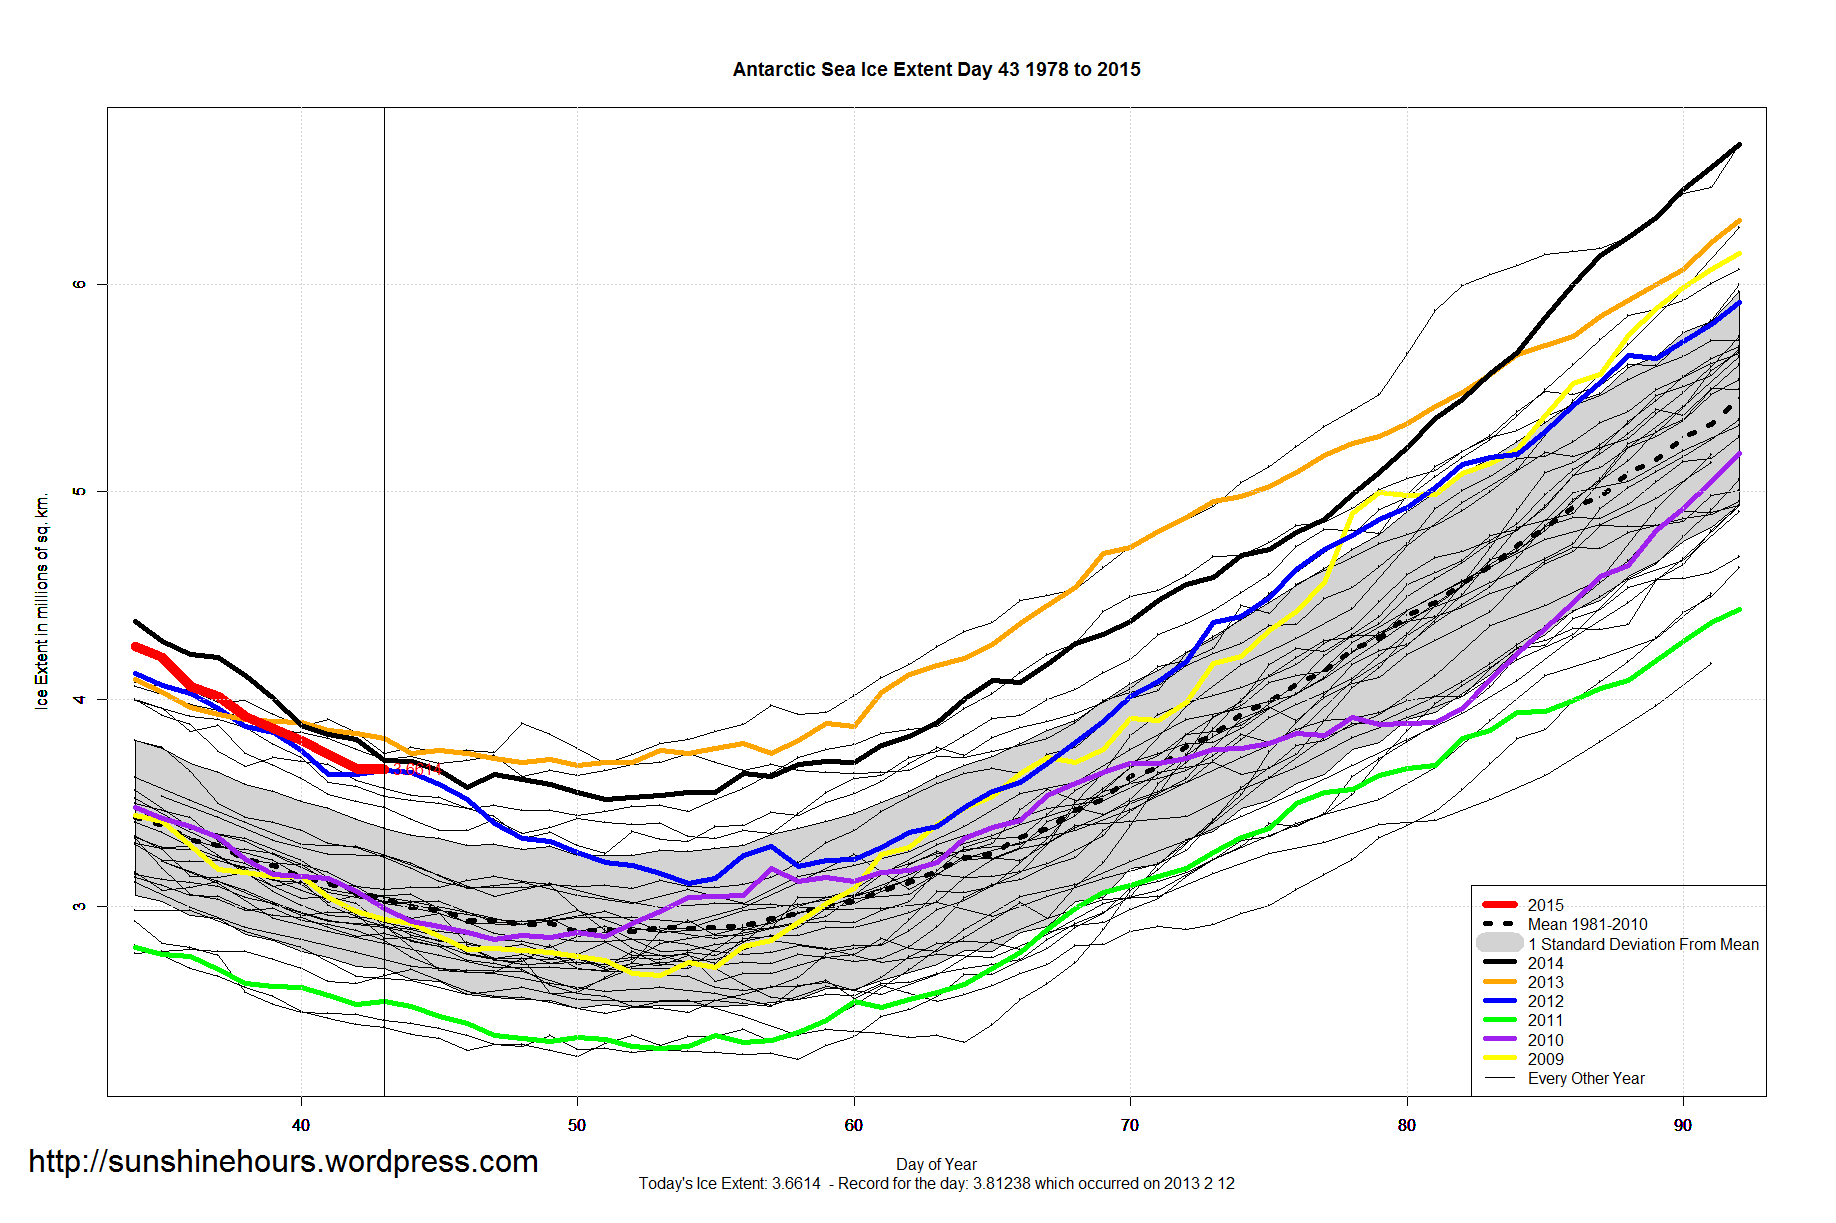
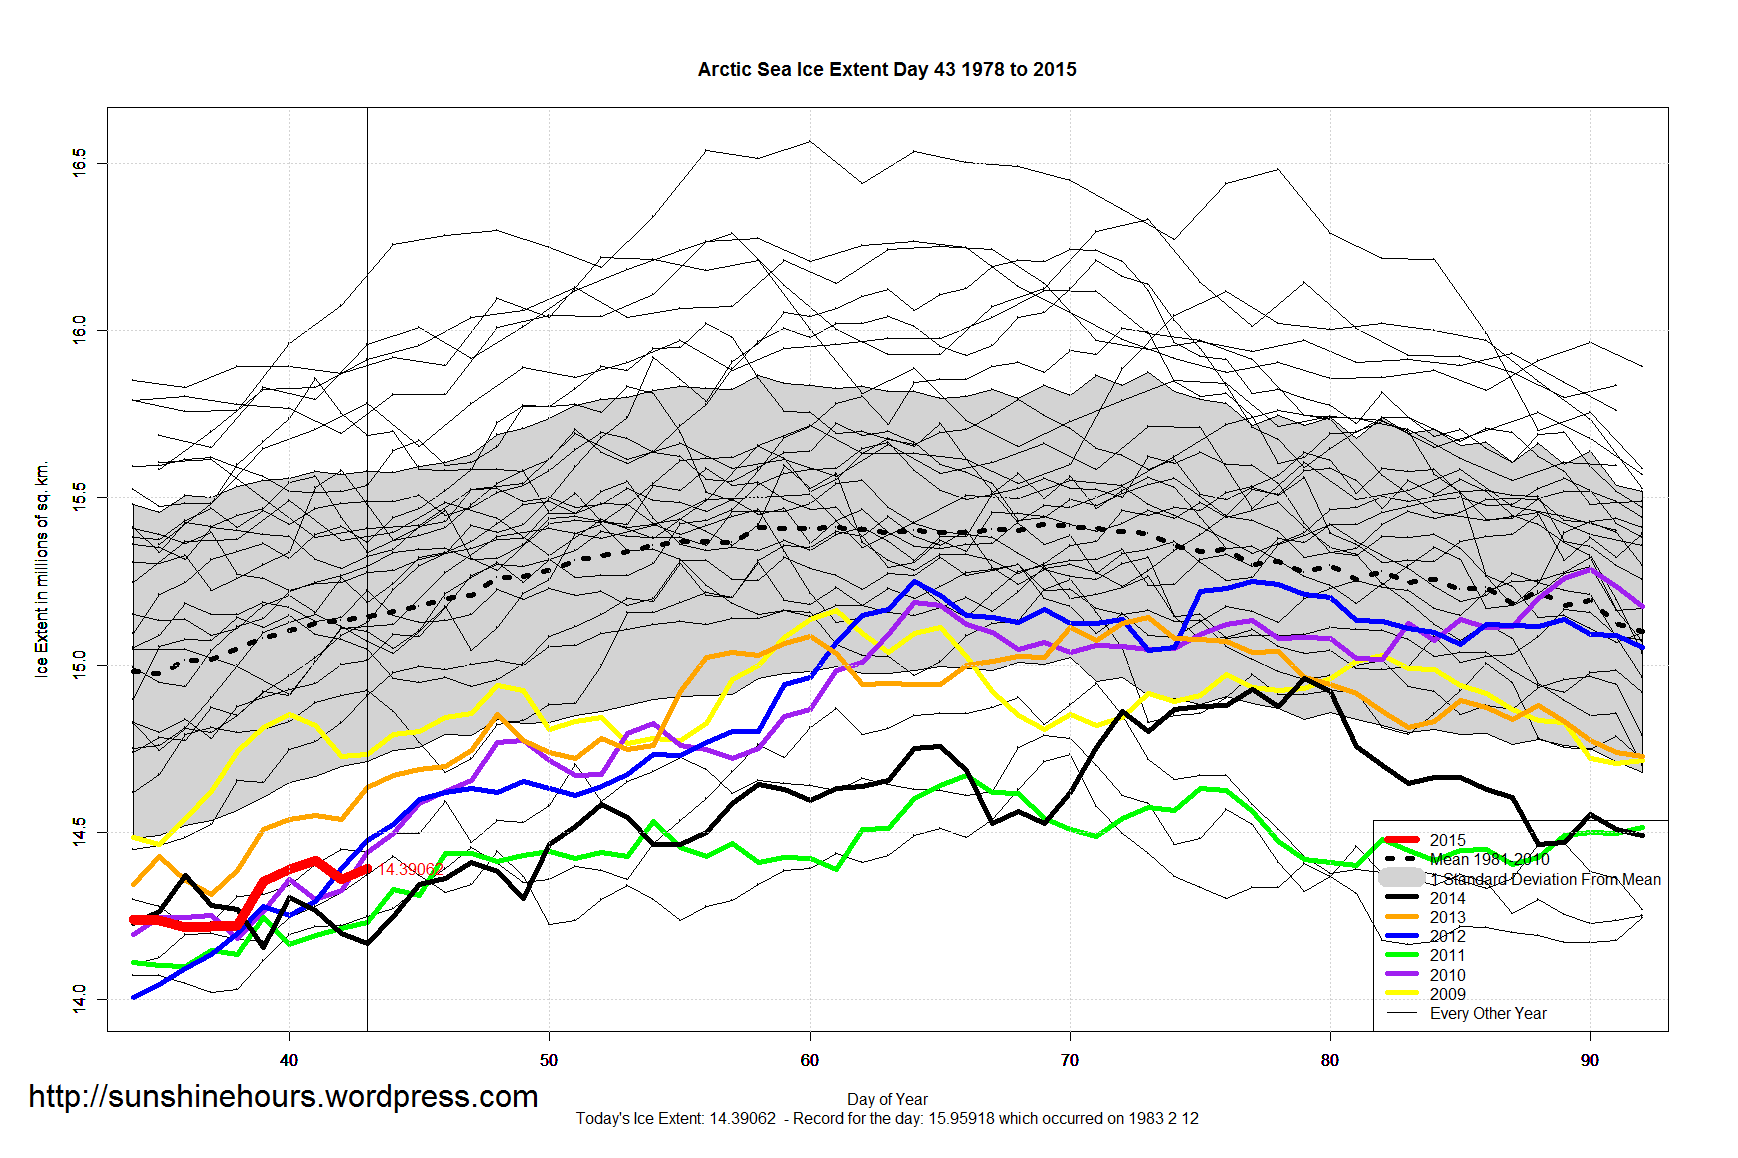
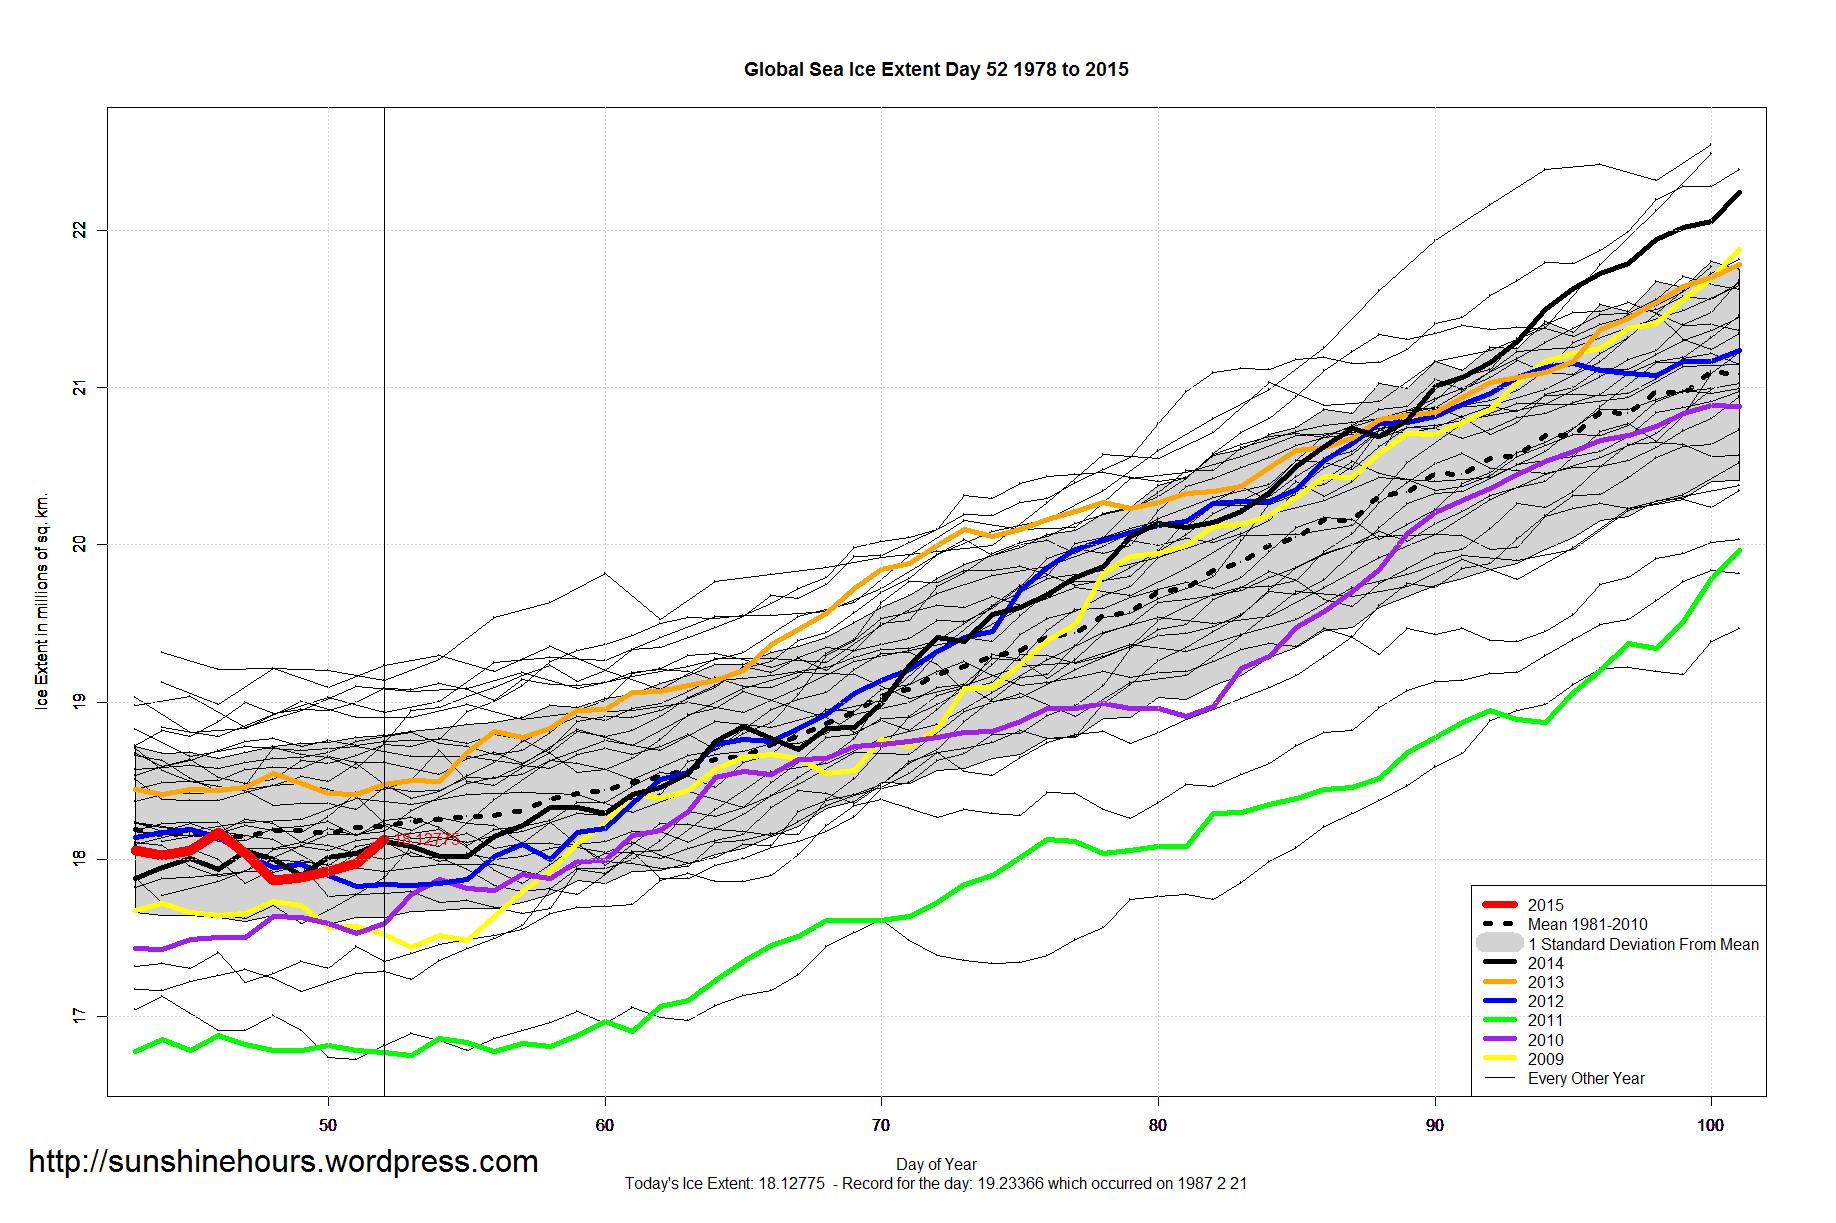
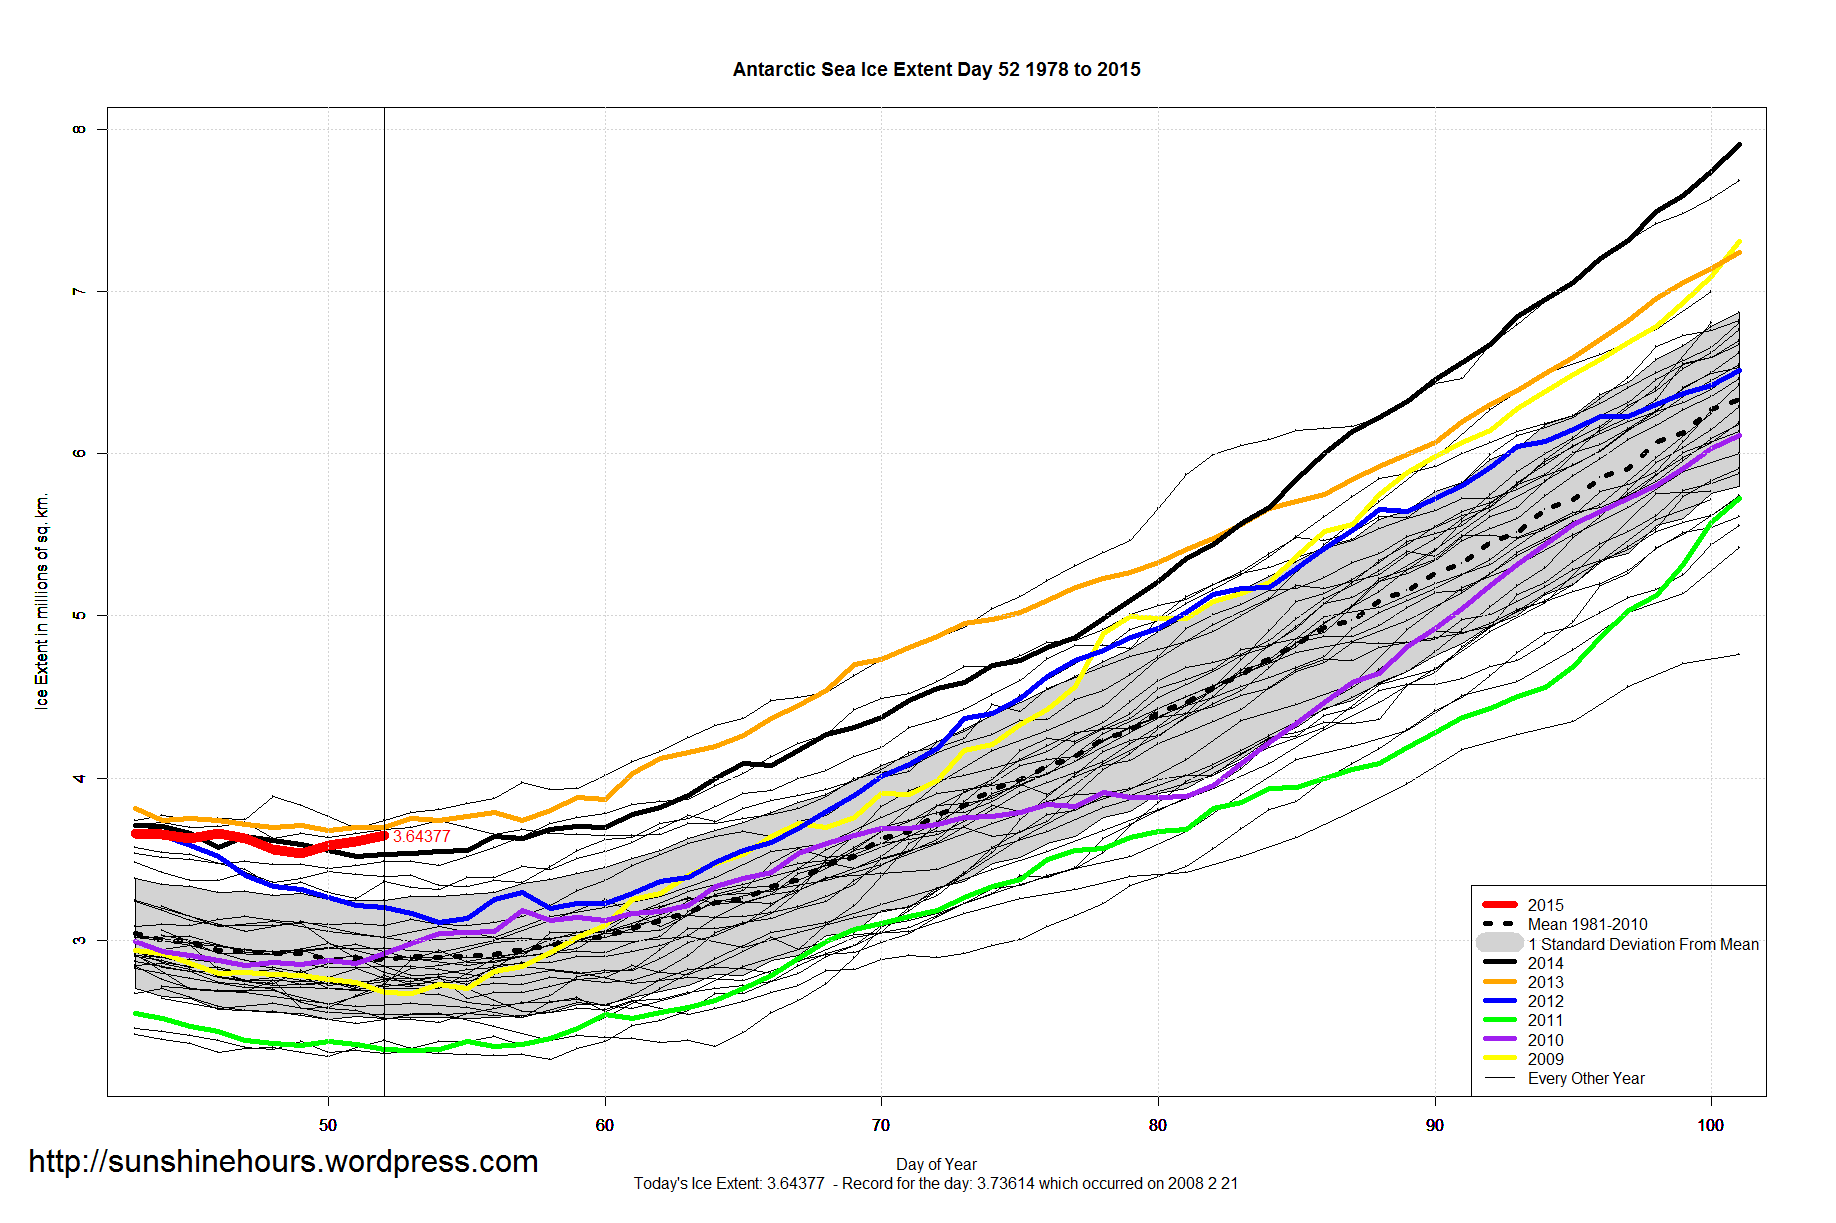
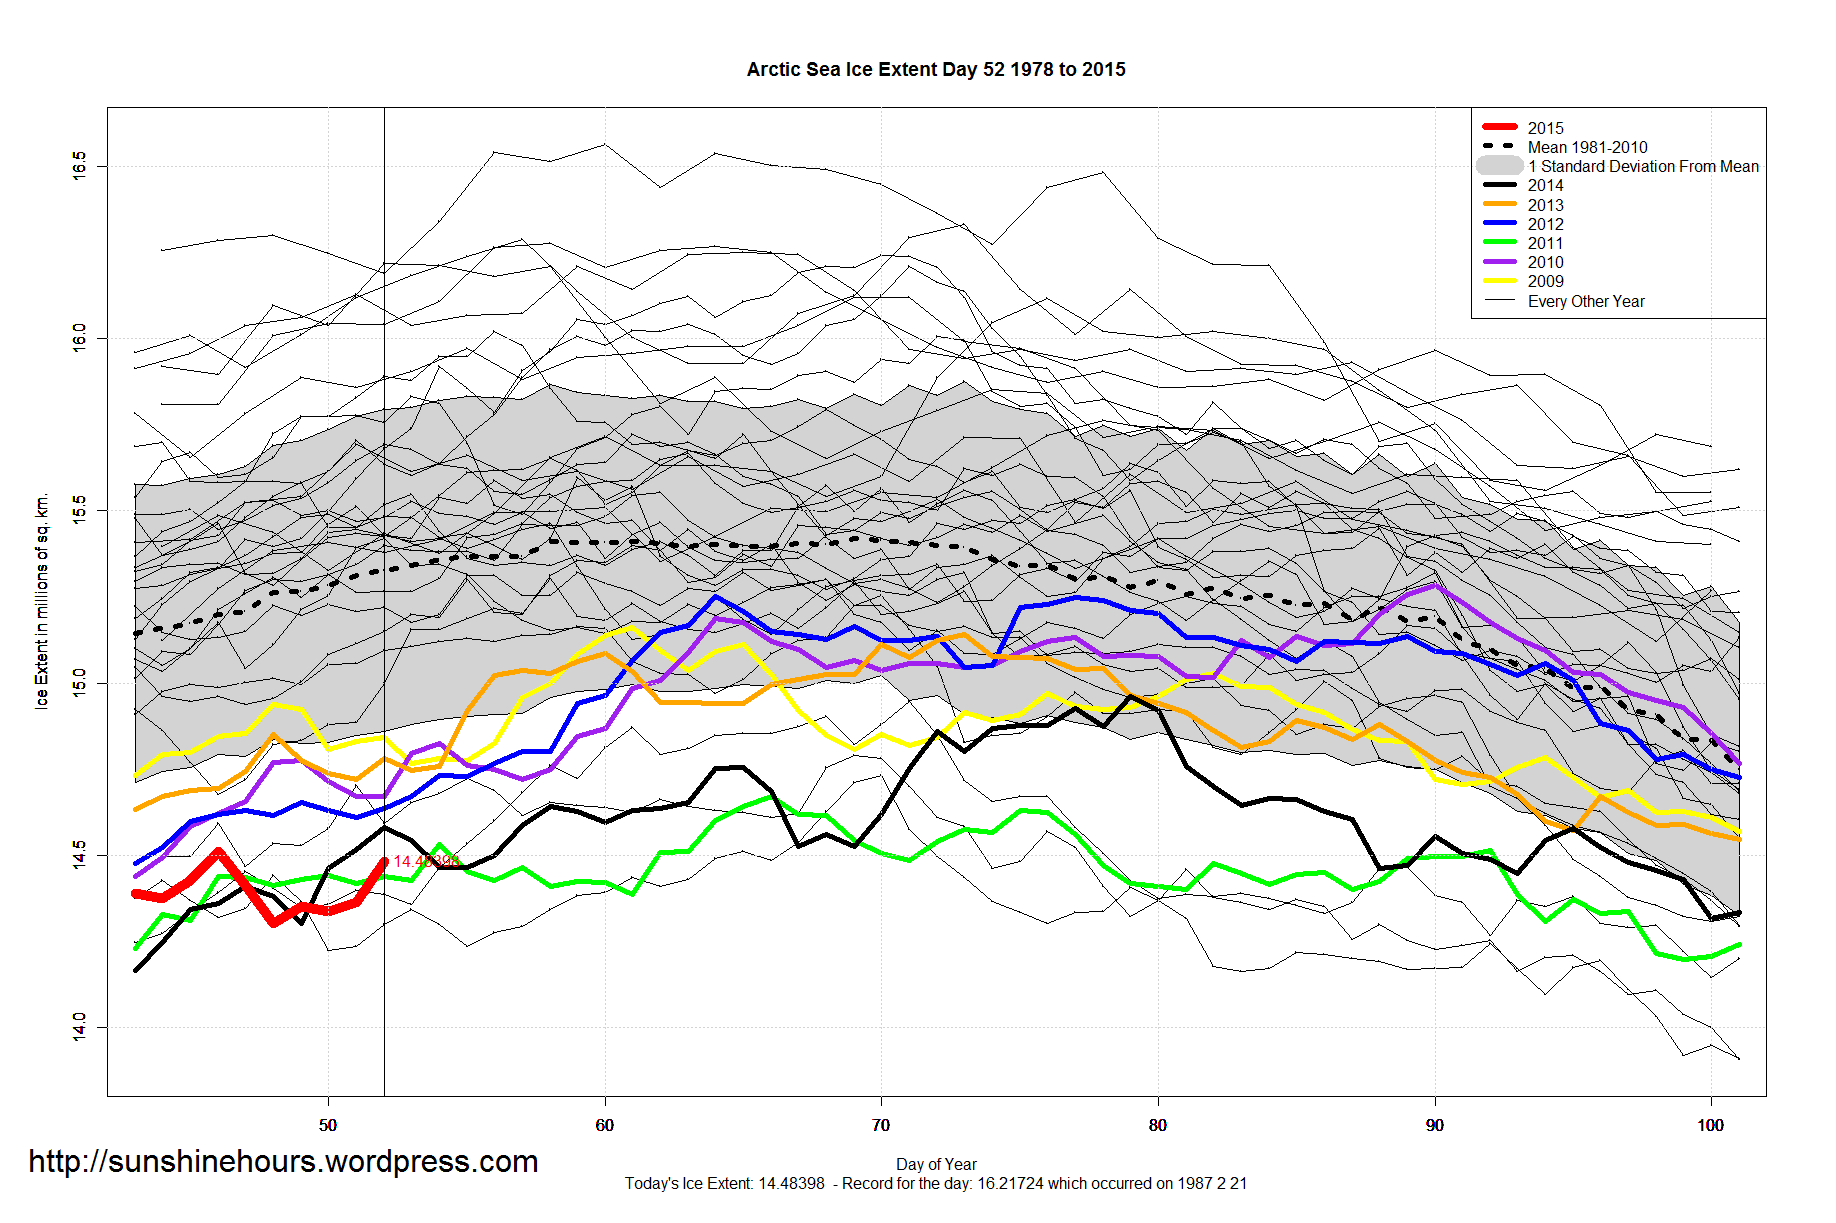
Both the Arctic and Antarctic sea ice fluctuated by large amounts every few years around this day.
Not so much the last few years.
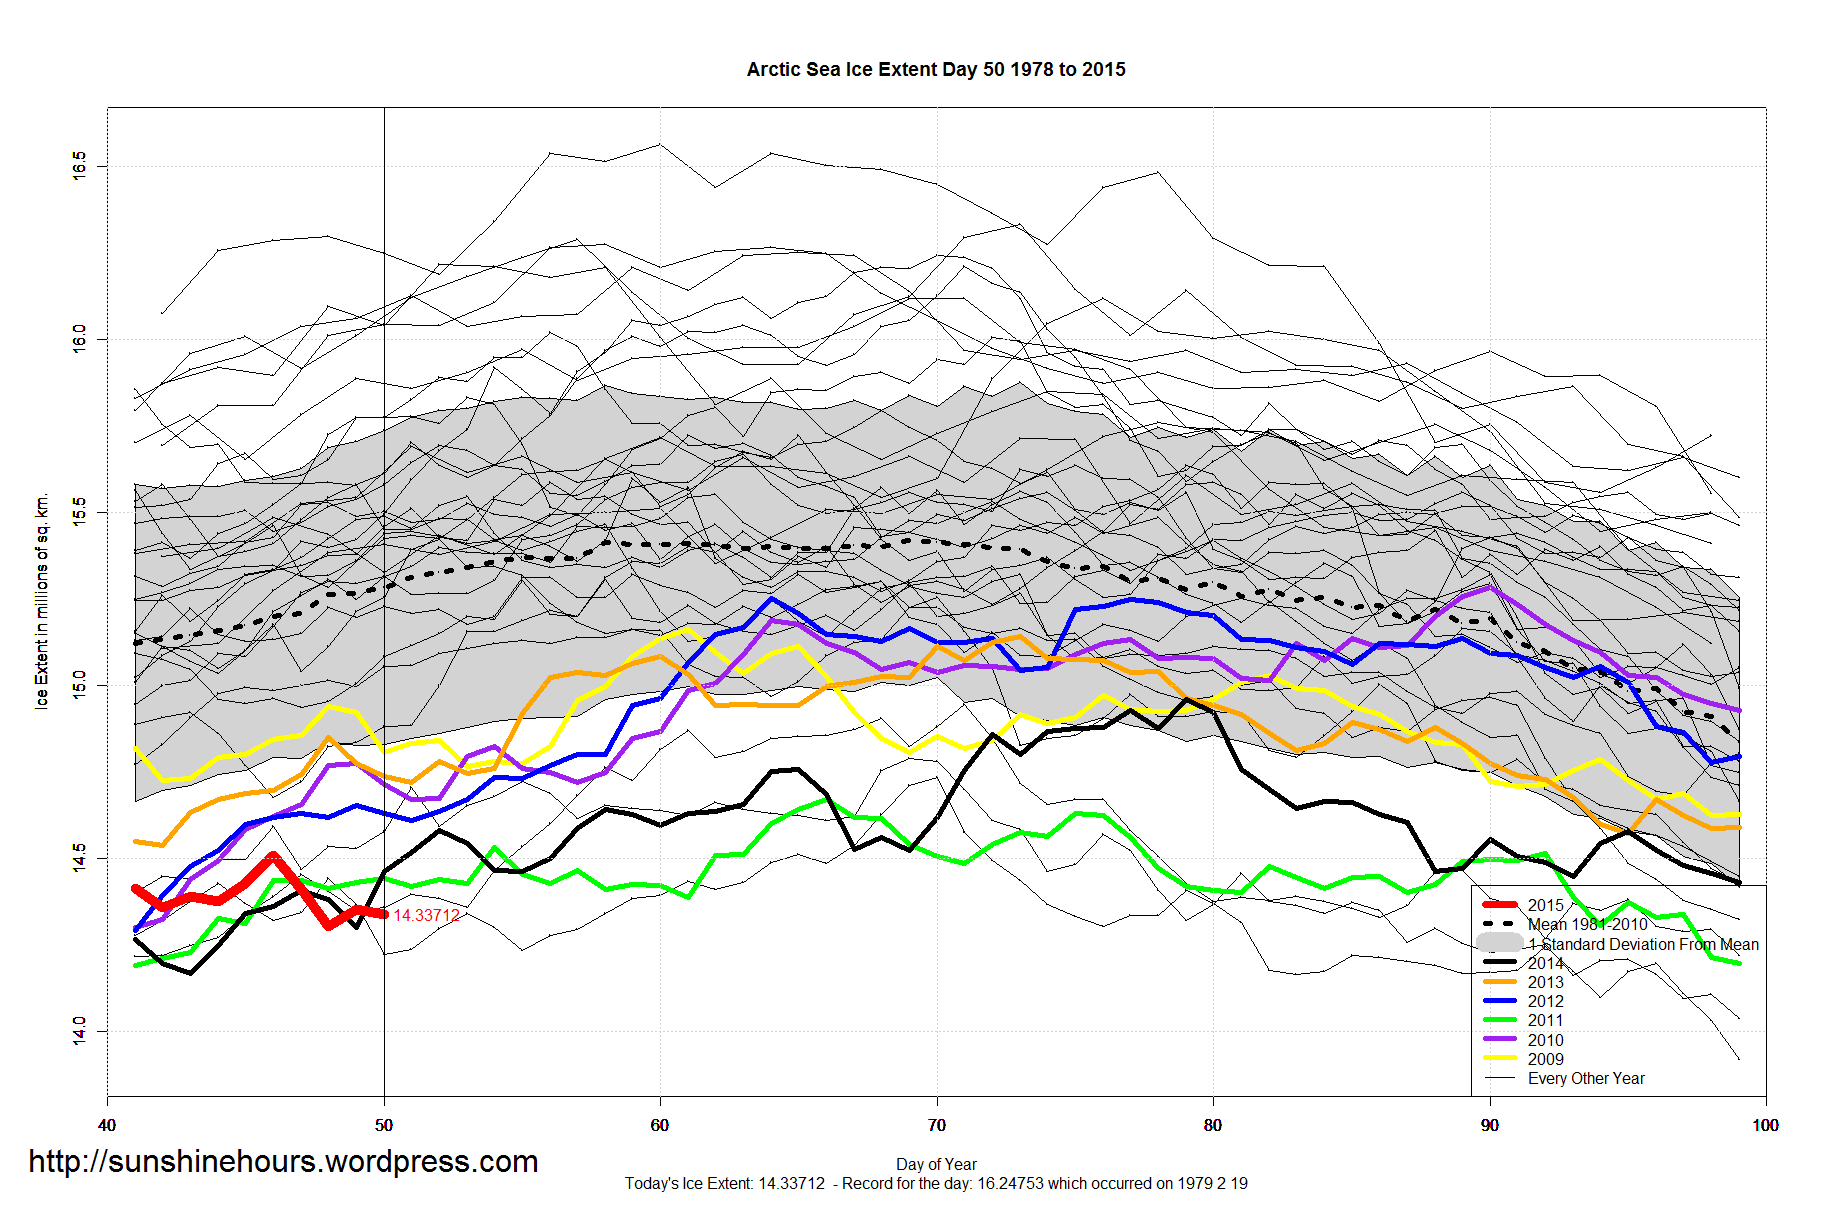
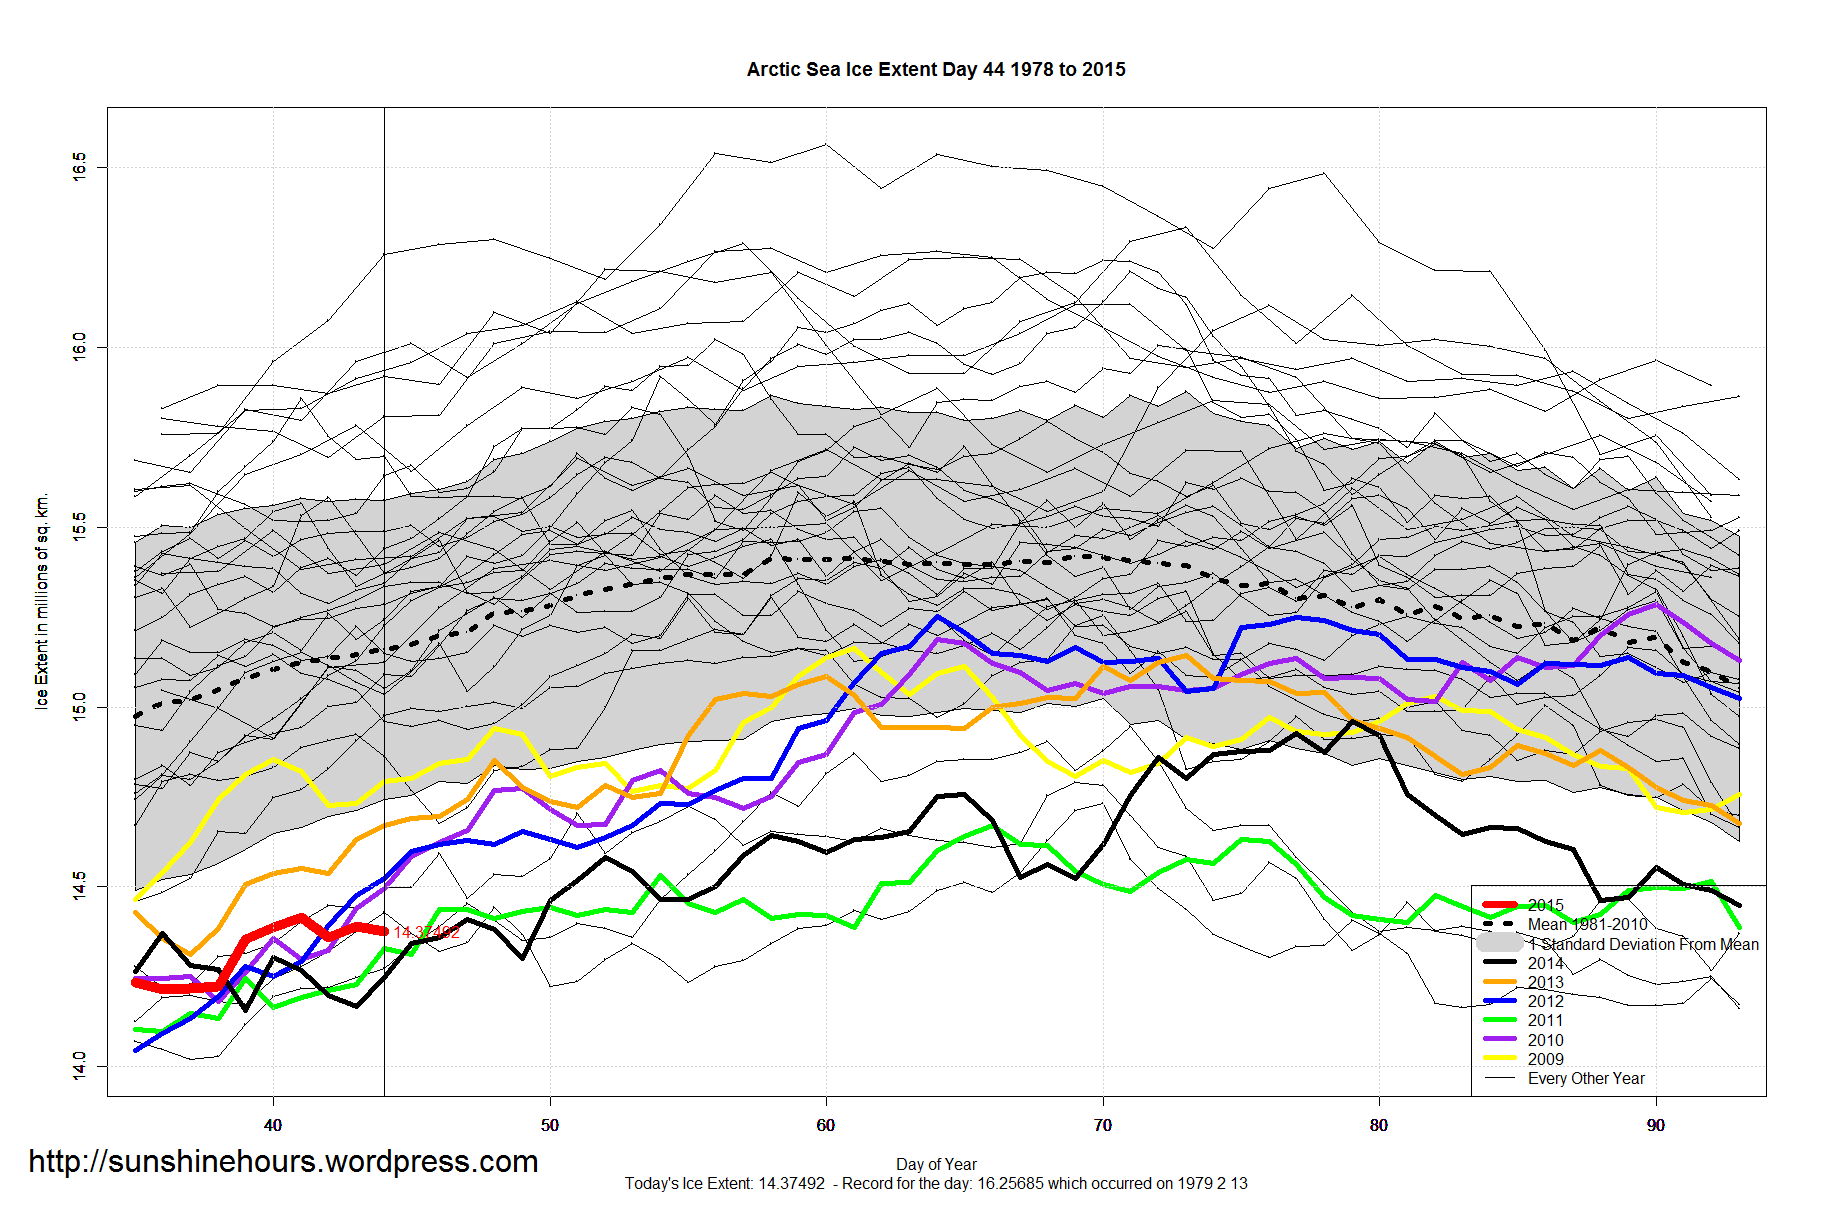
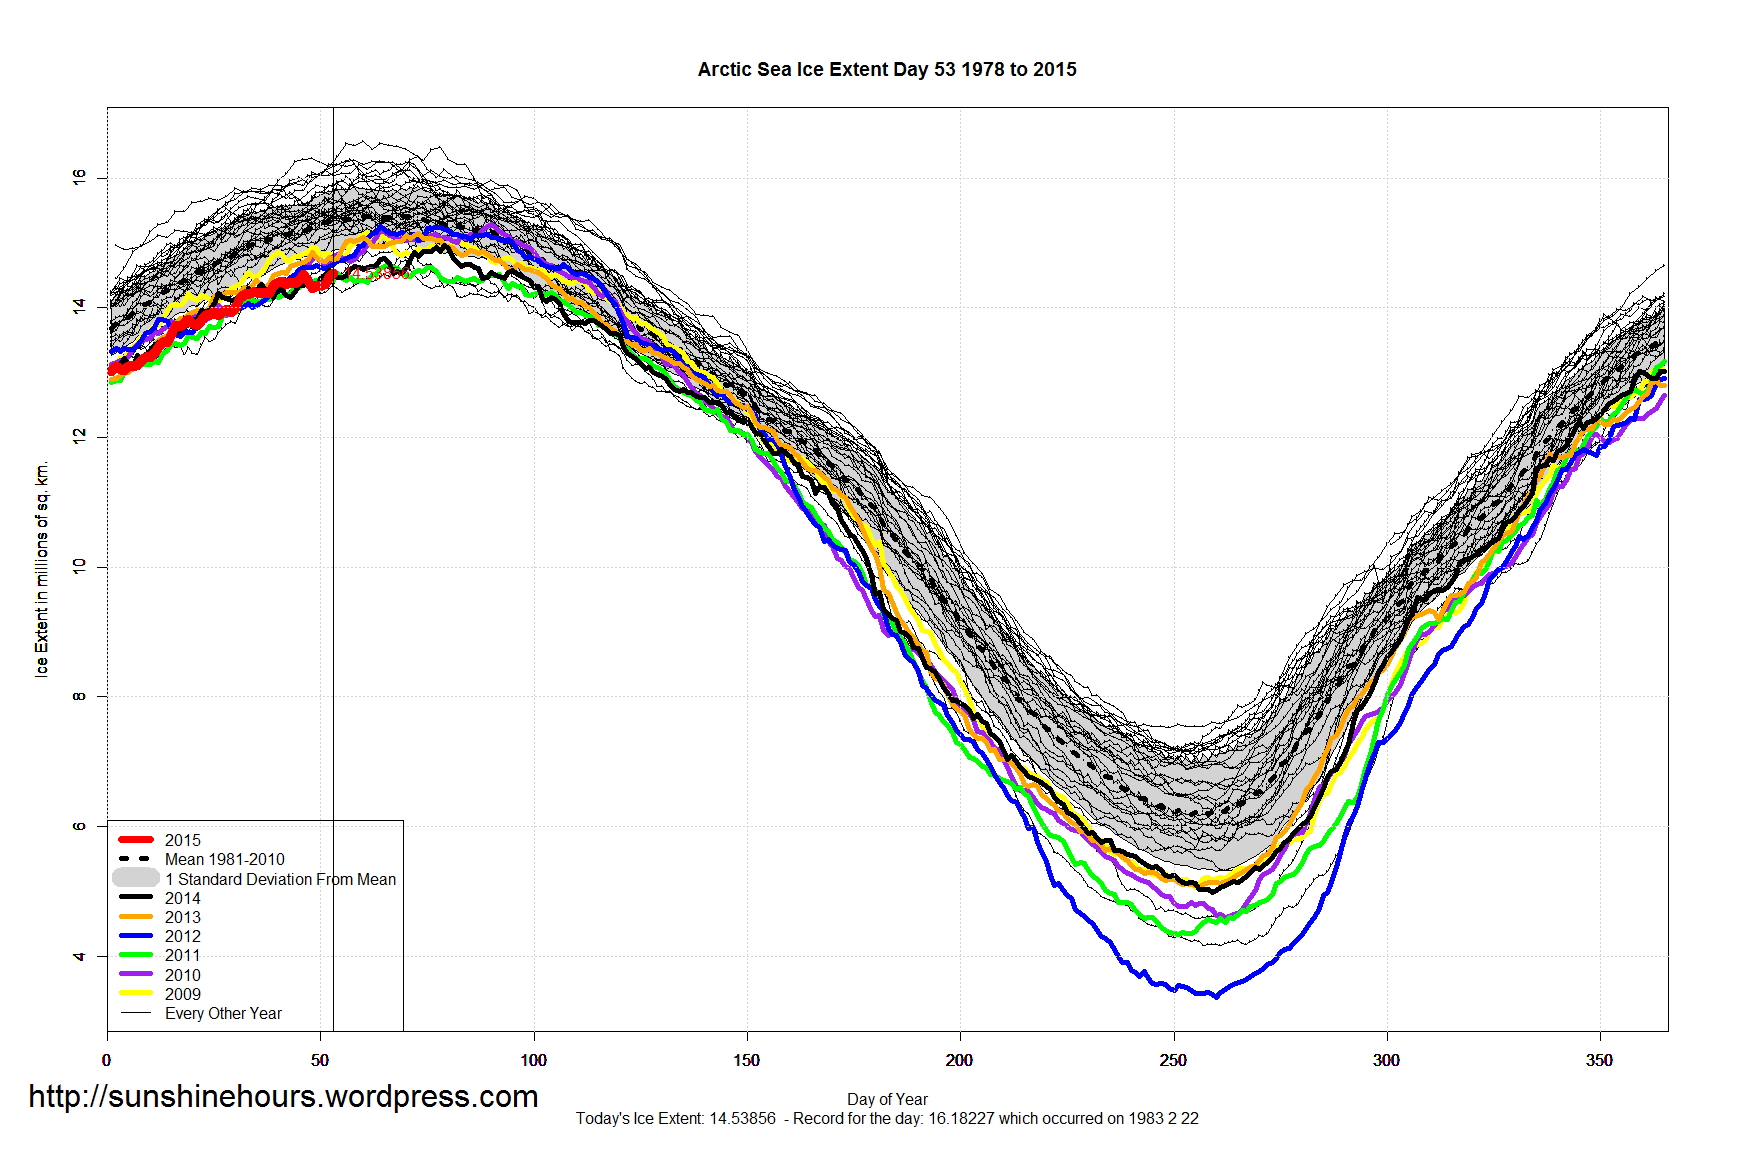
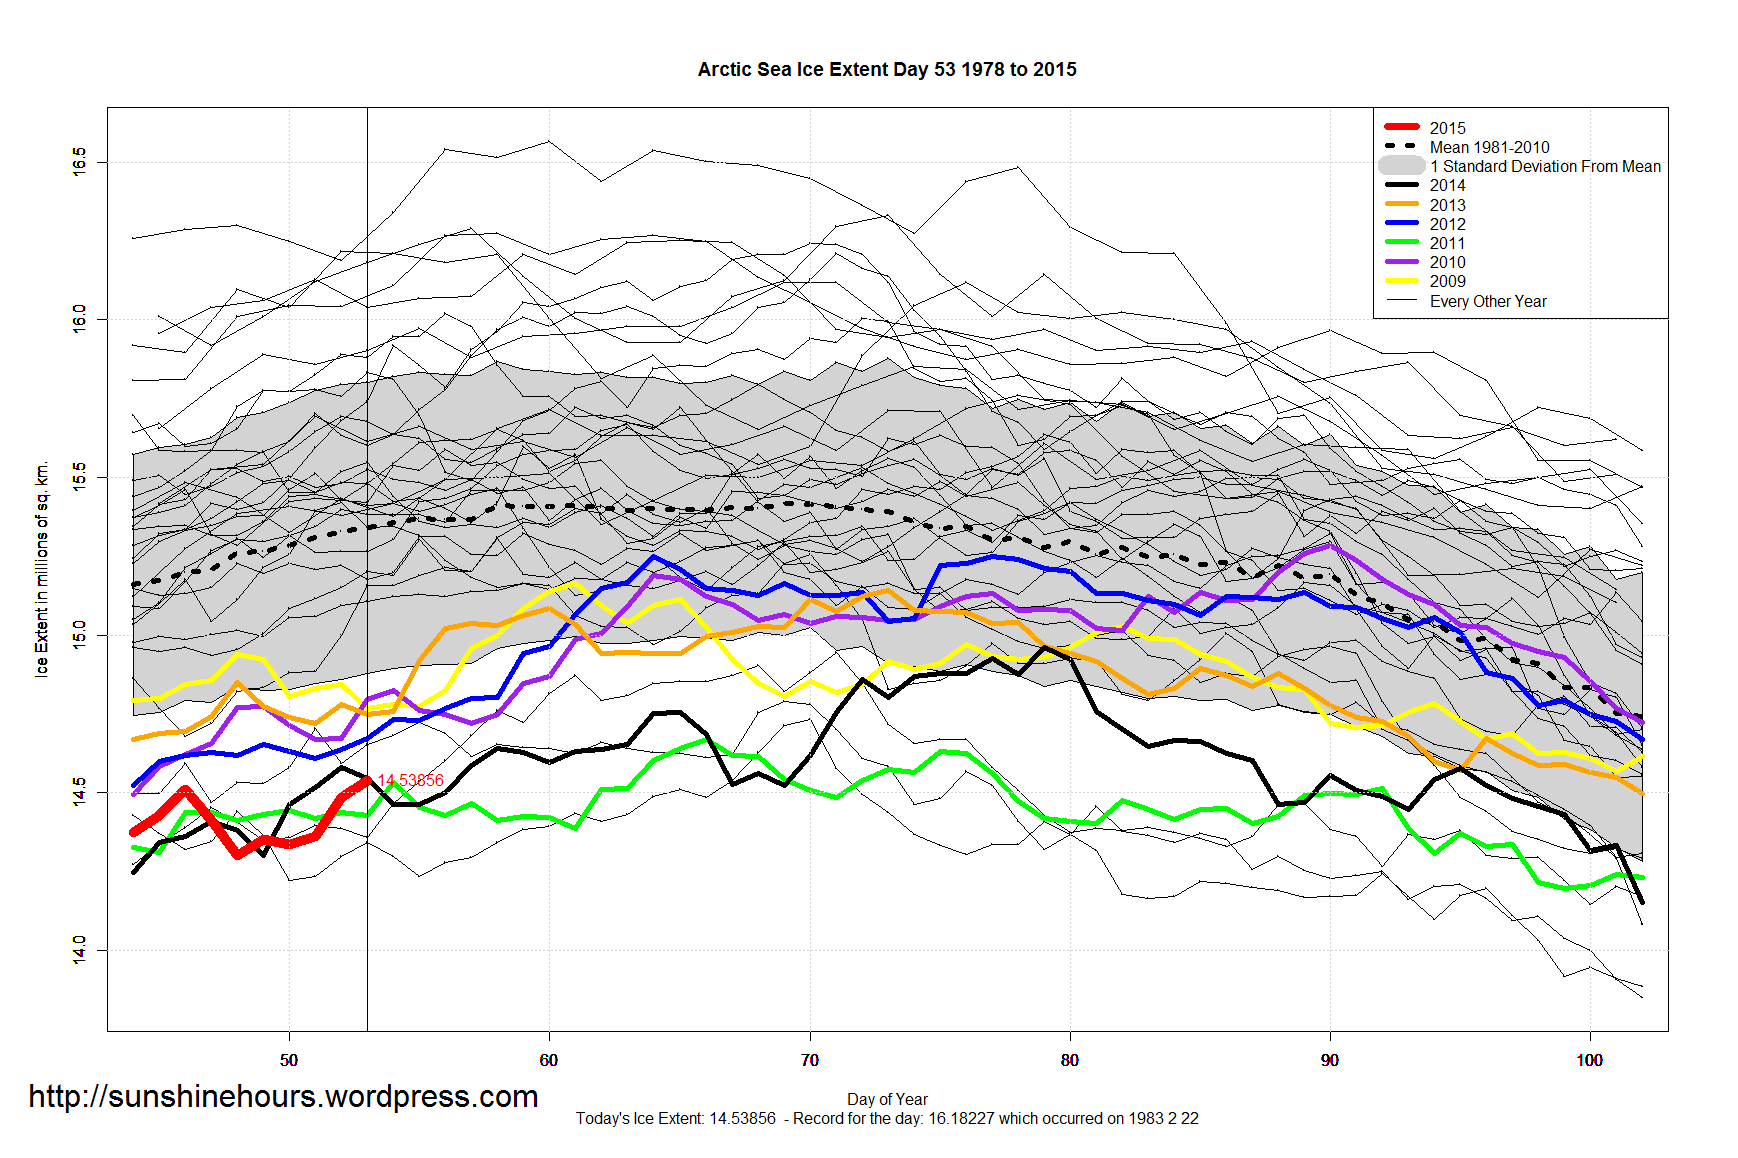
The Arctic would go up and down by 700,000 or 800,000 …. and now it is only going up and down by 300,000 and the bottom stays the same at 14.2 million sq km.
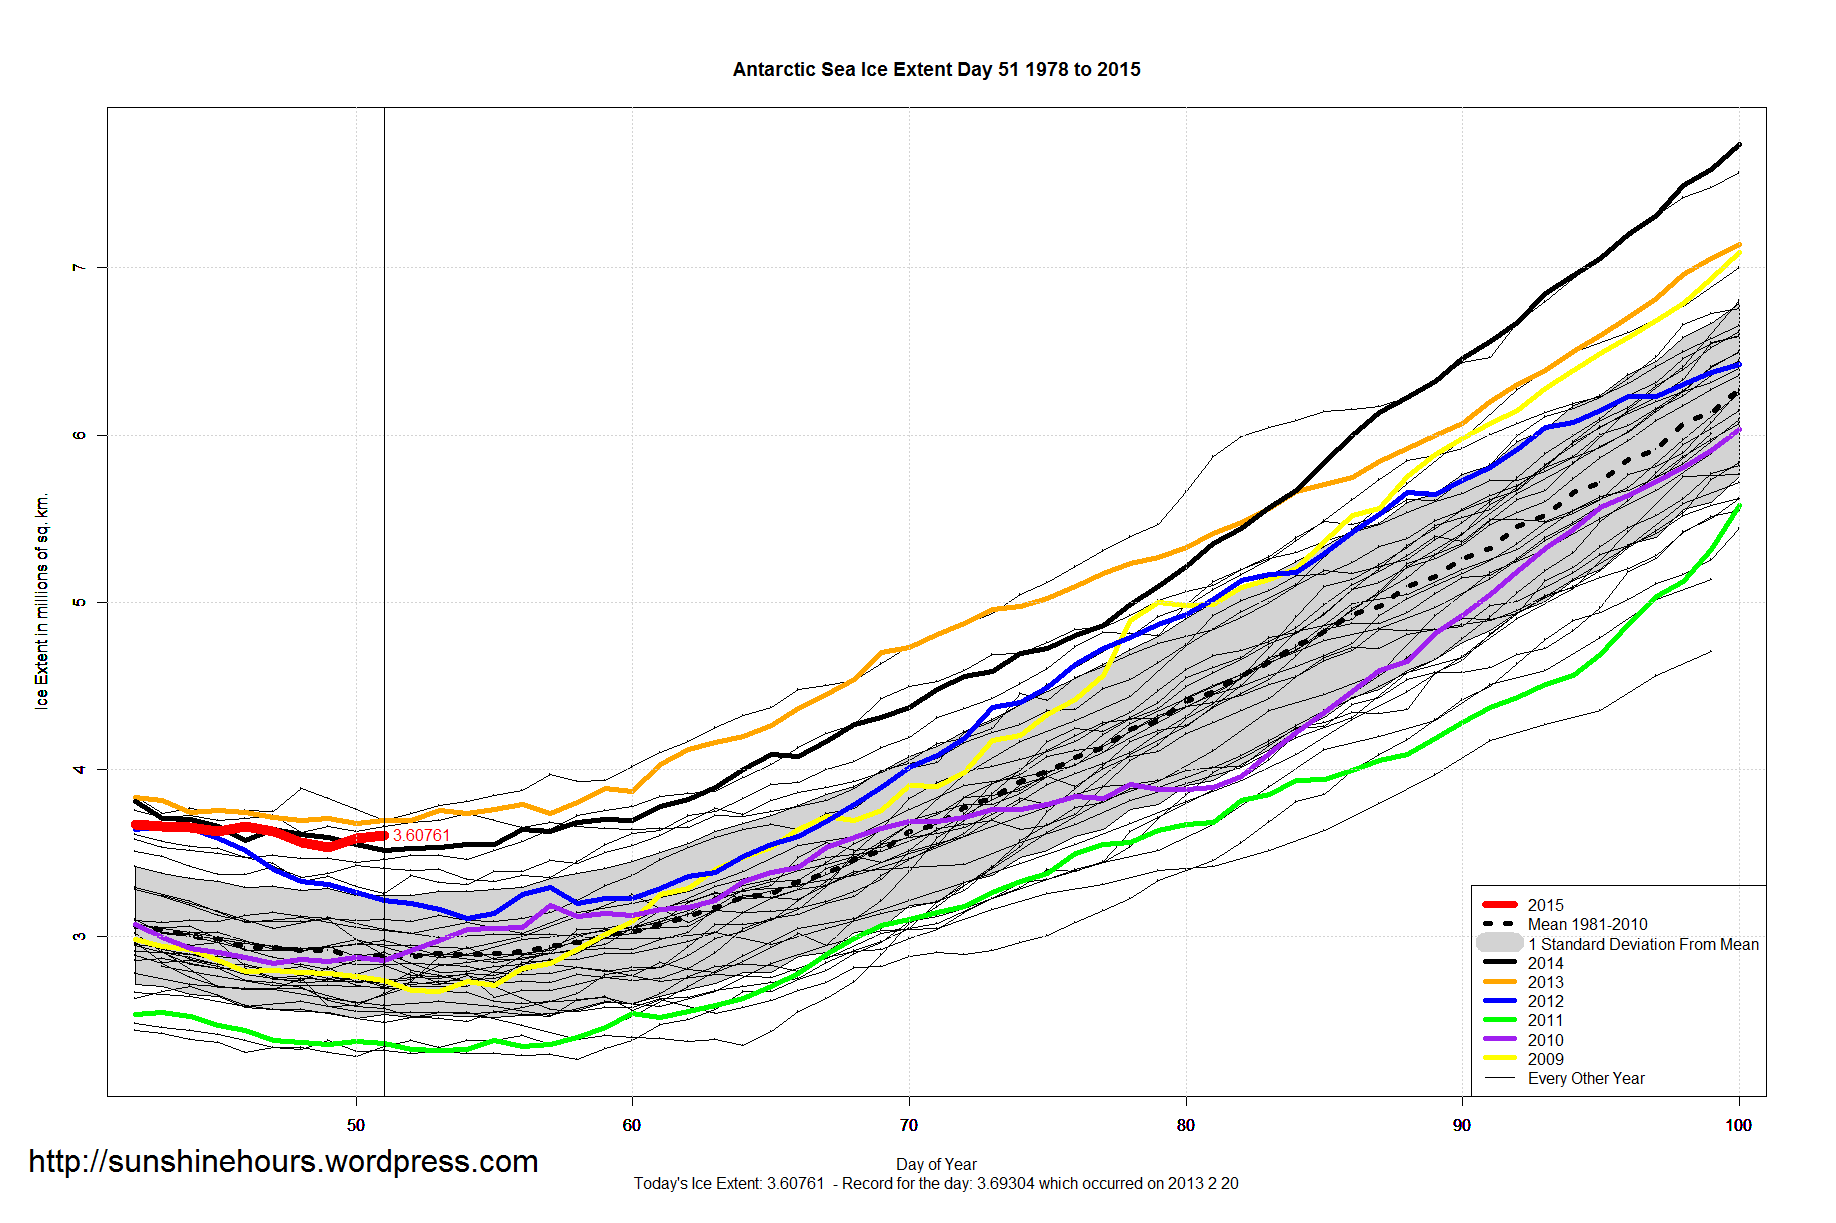
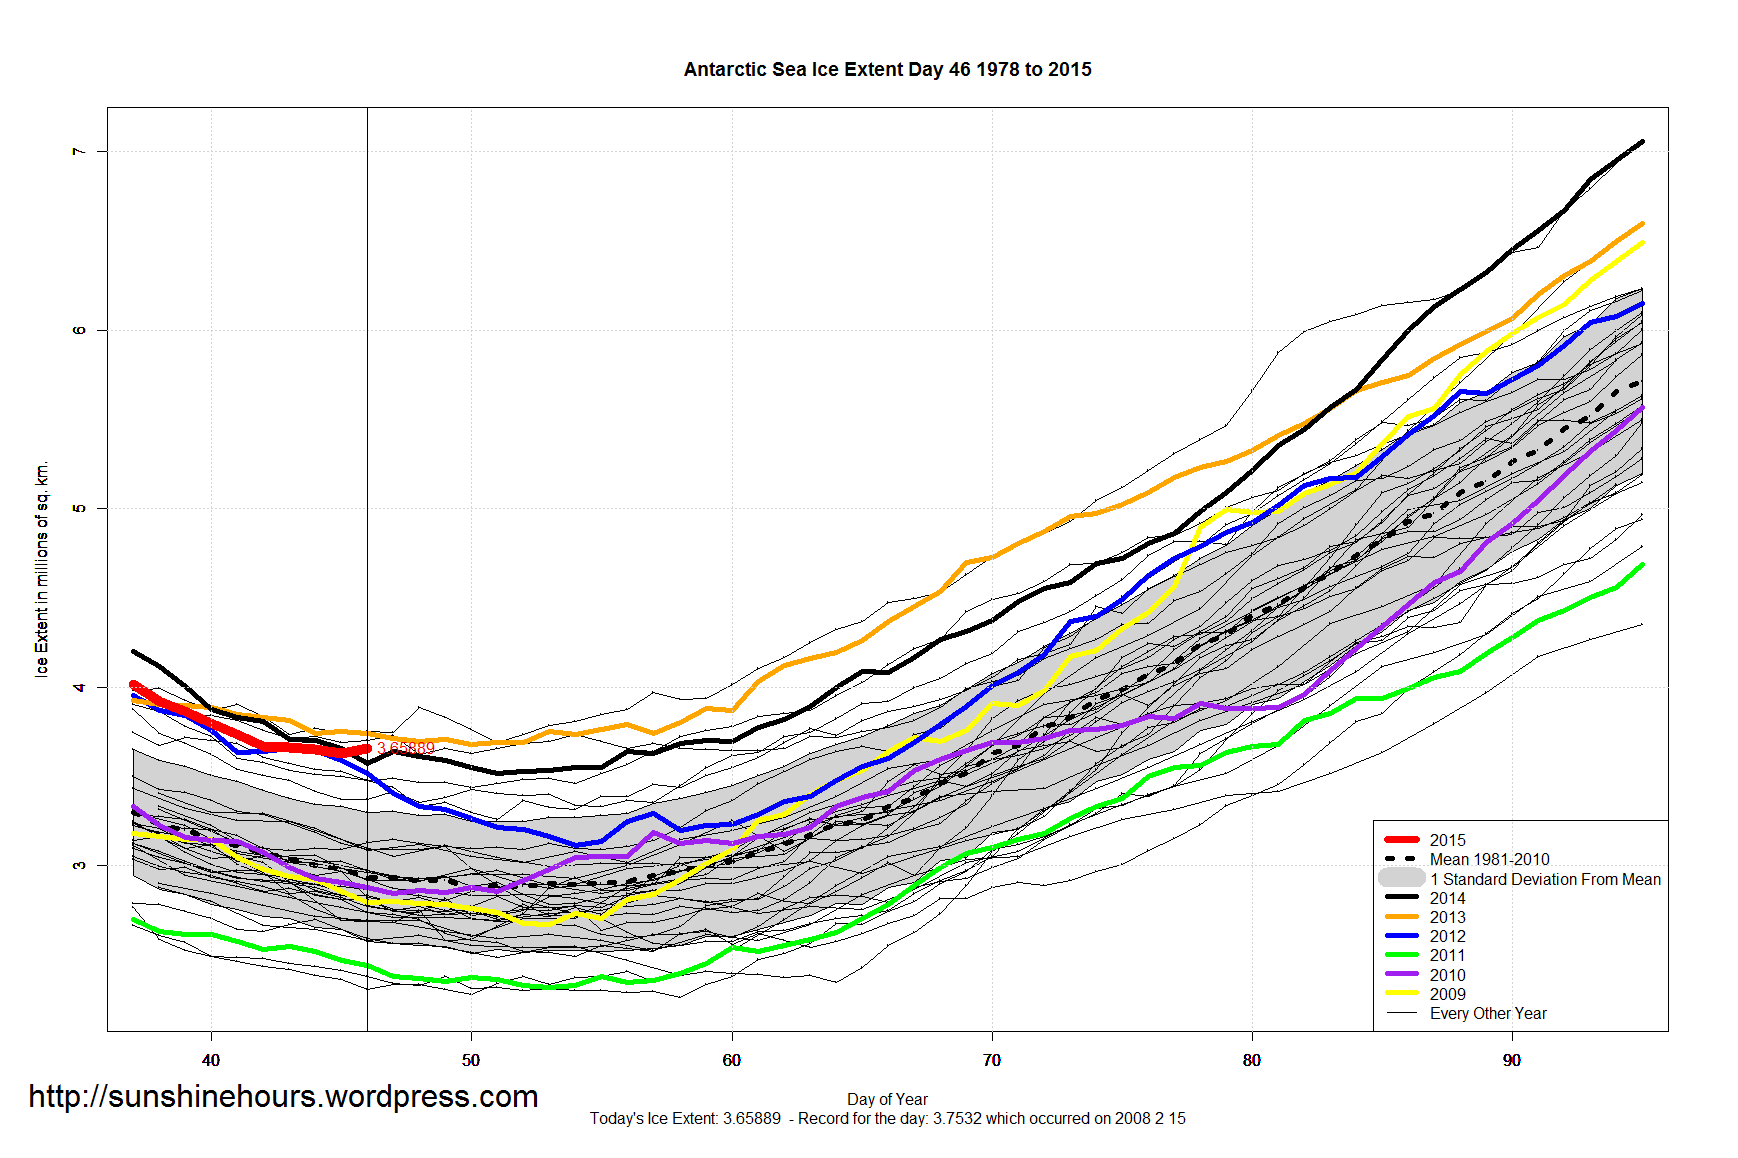
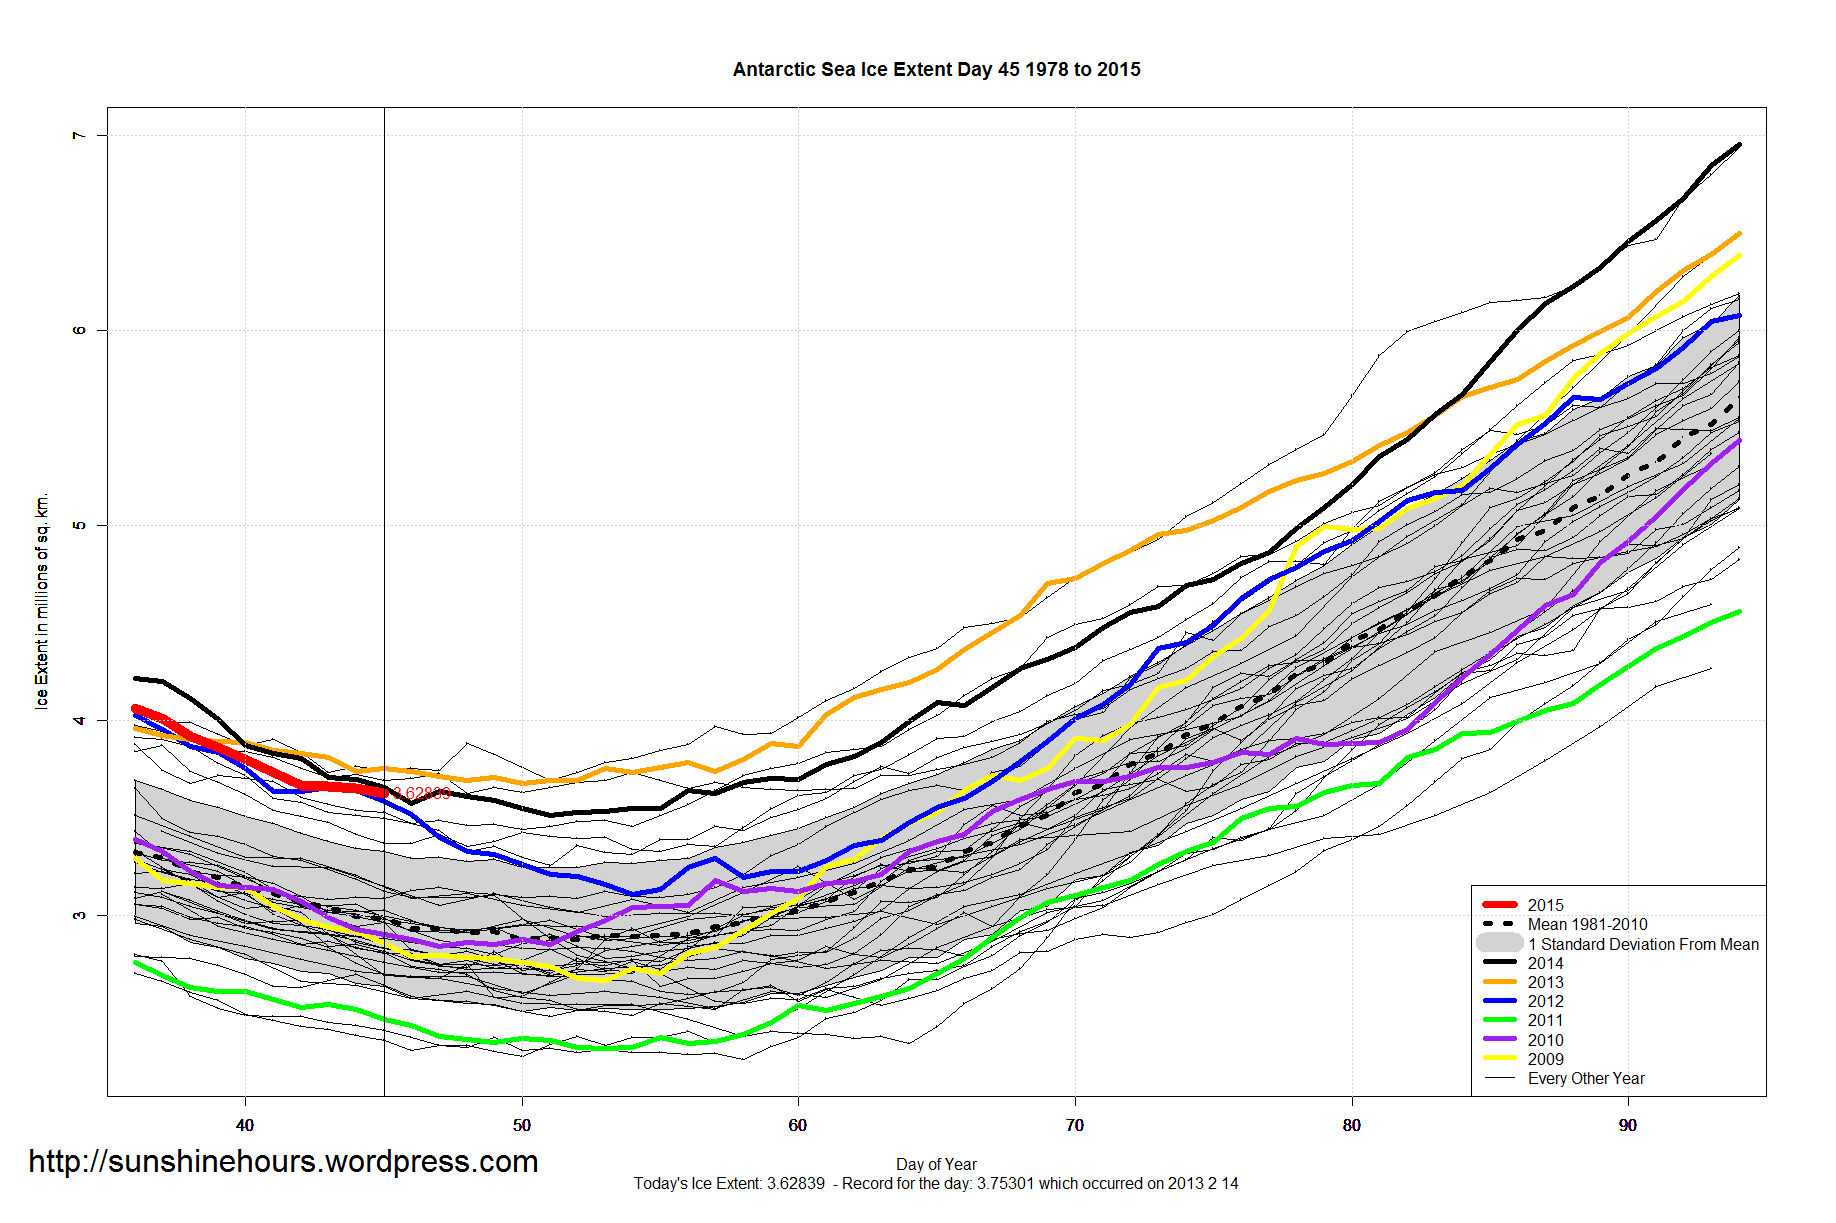
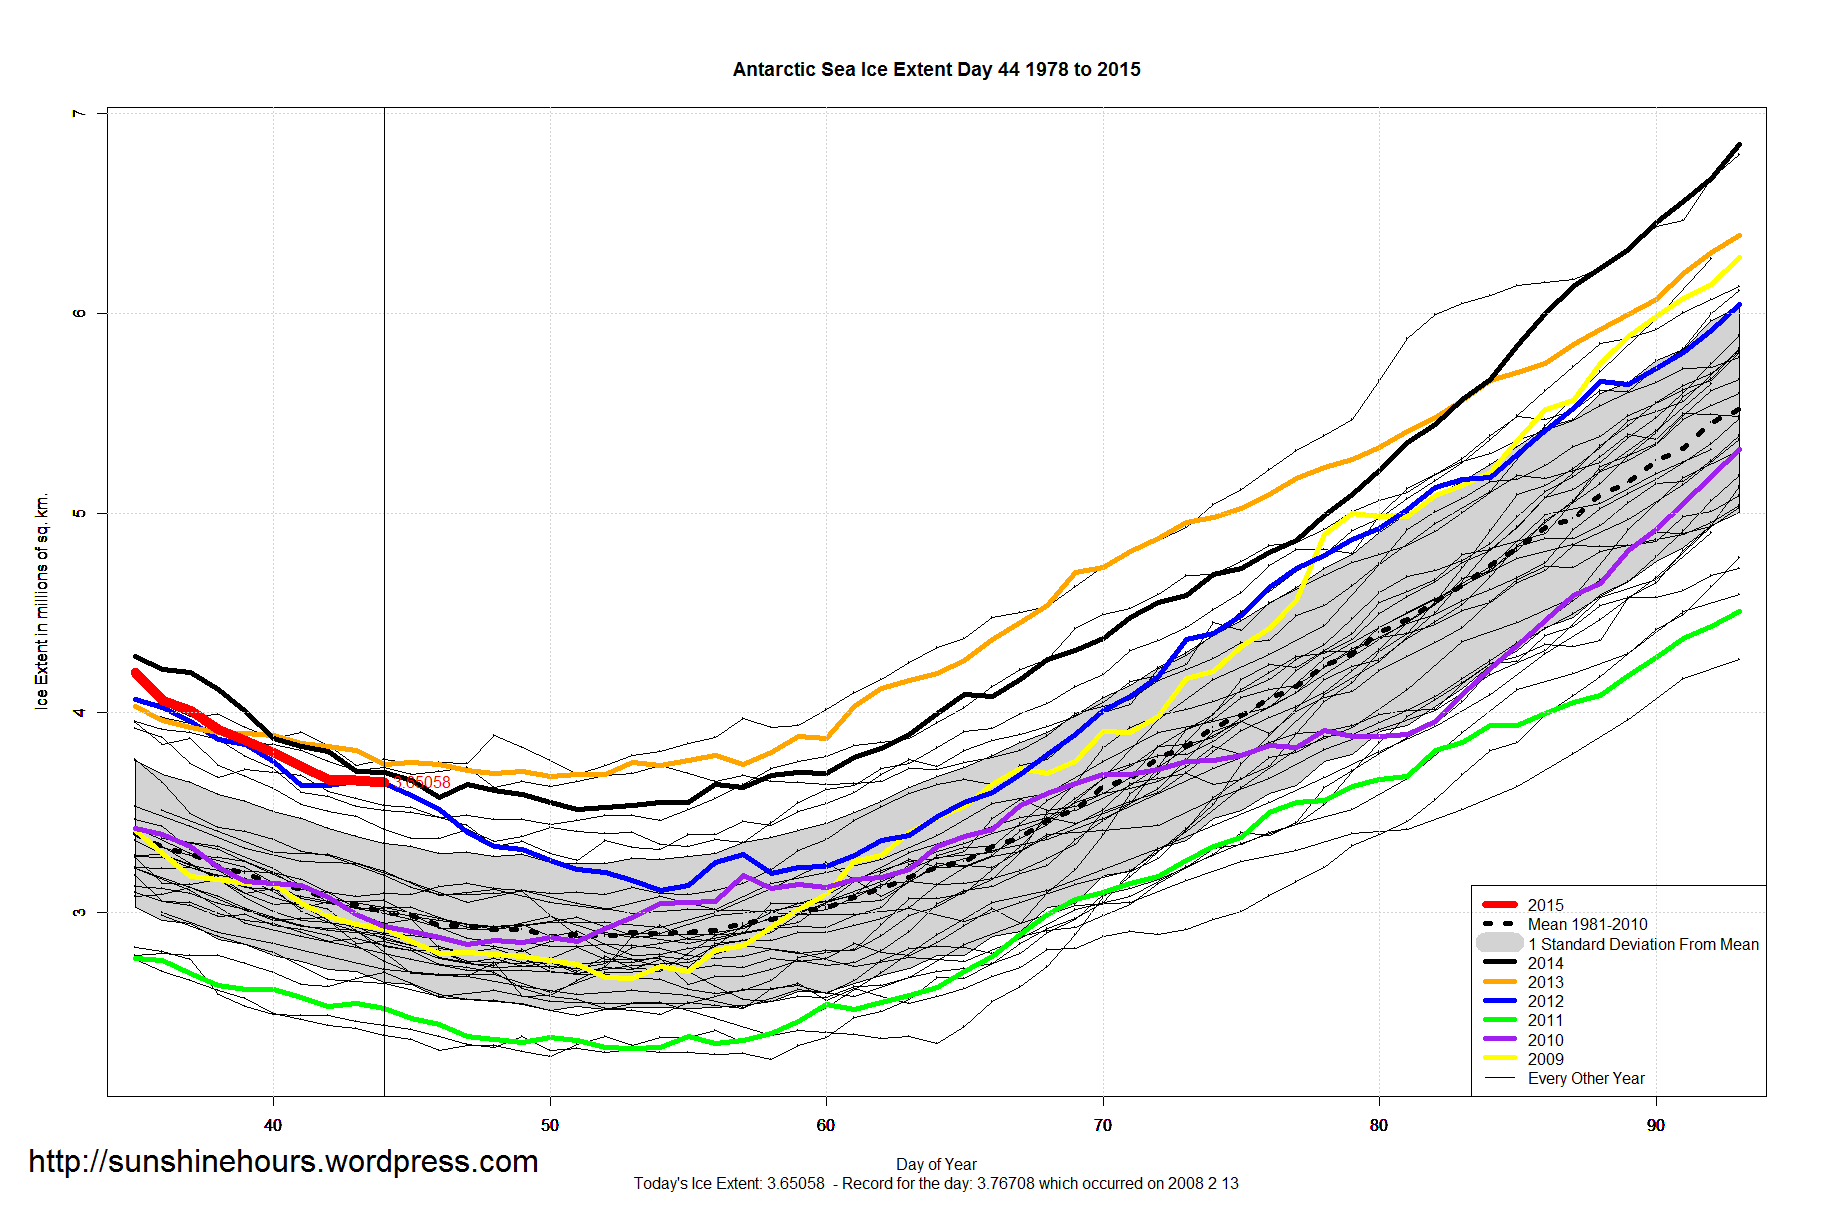
The Antarctic would fluctuate by over 1,000,000 sq km . The last 4 years have seen very small changes from year to year.
It could be a portent of stability or just a pause before the process reverses itself.
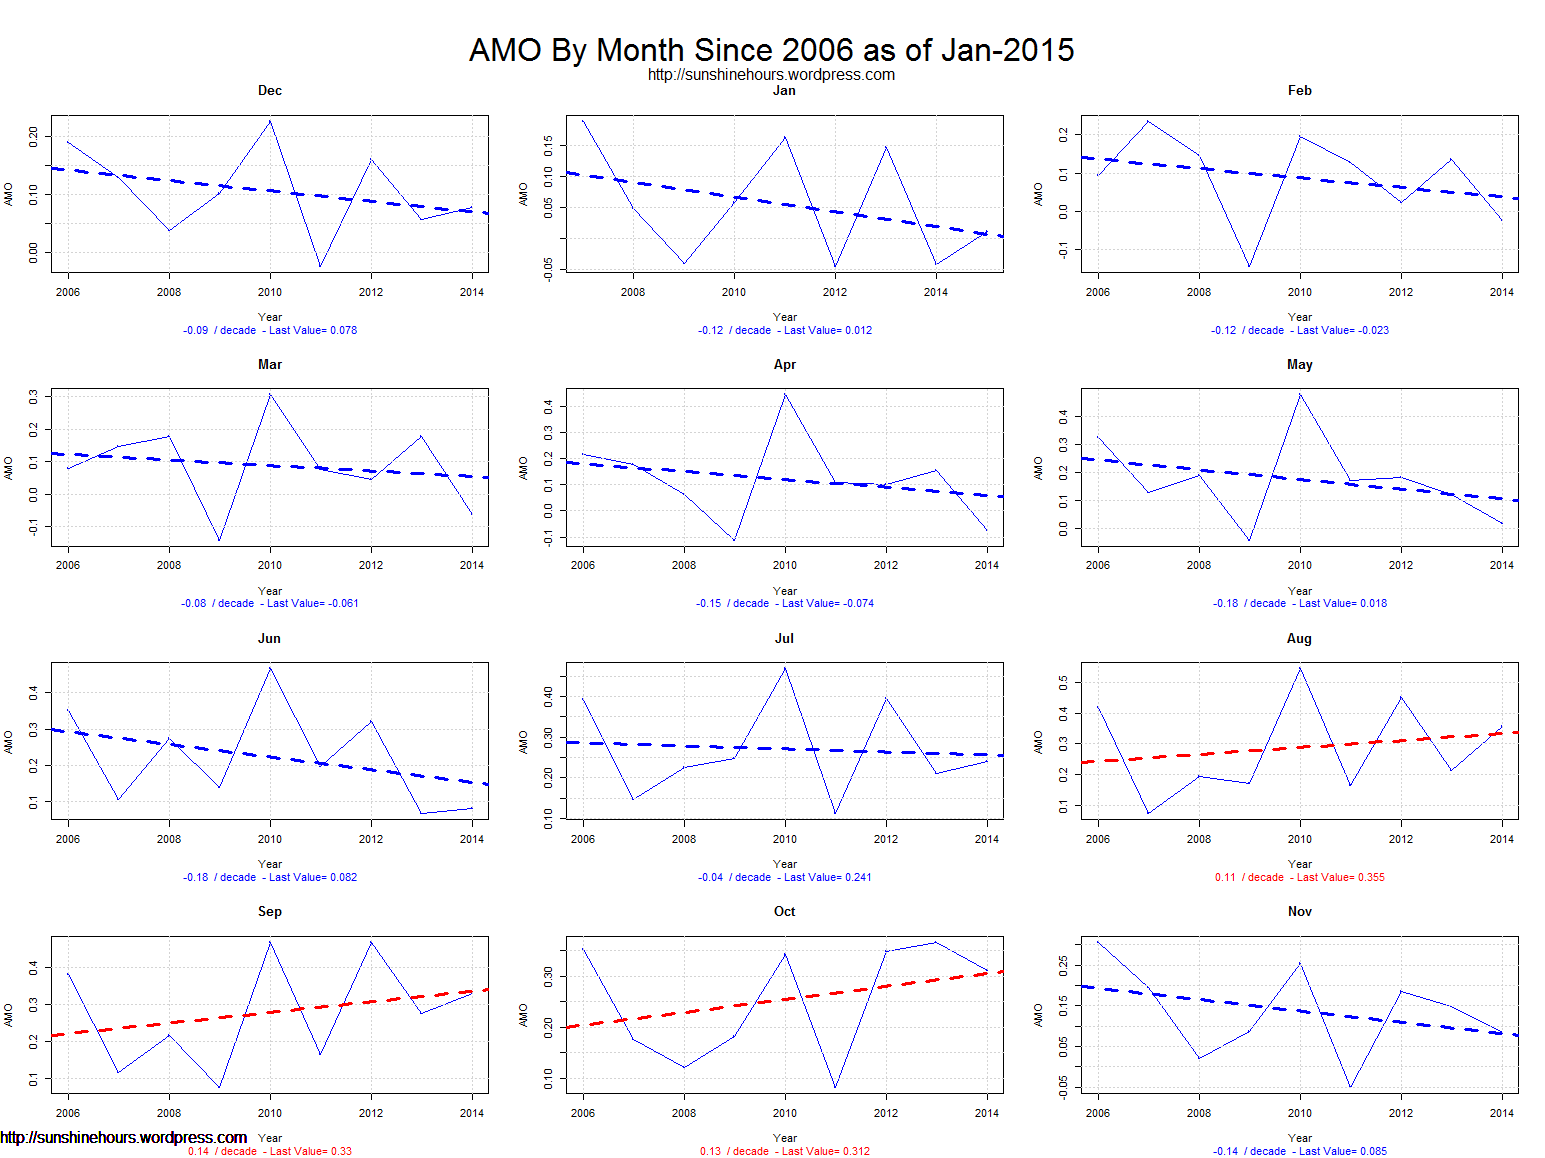
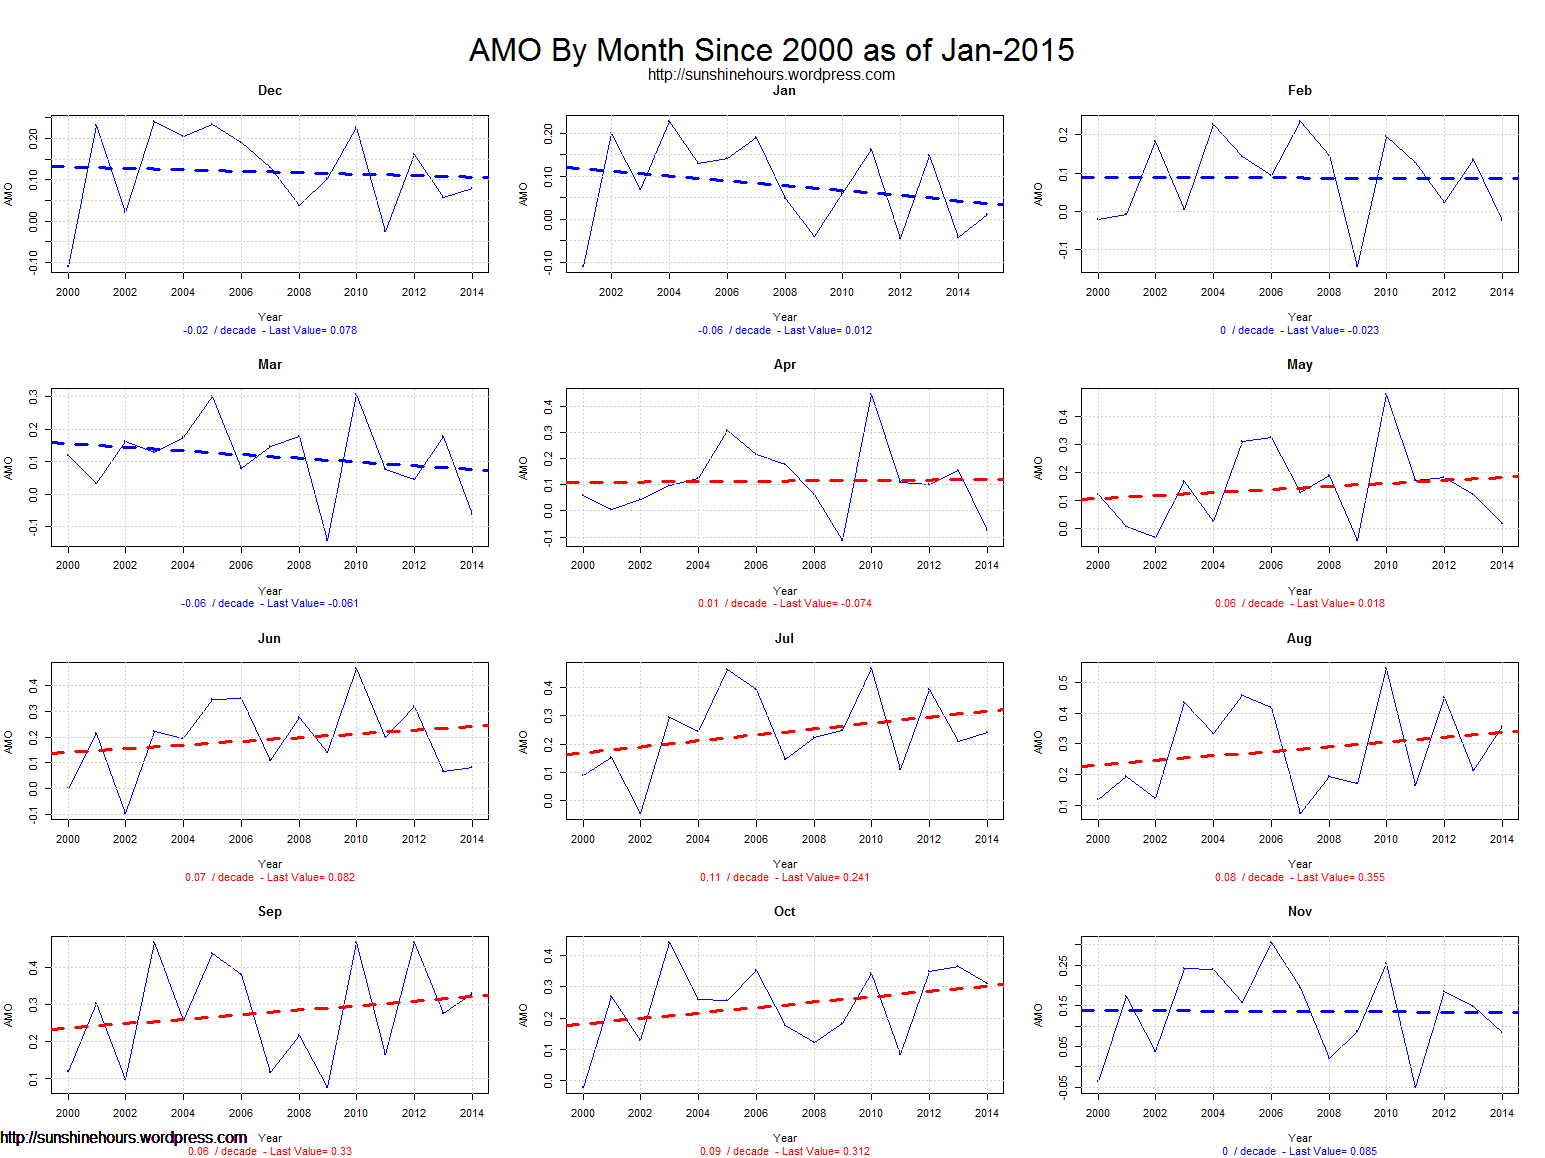
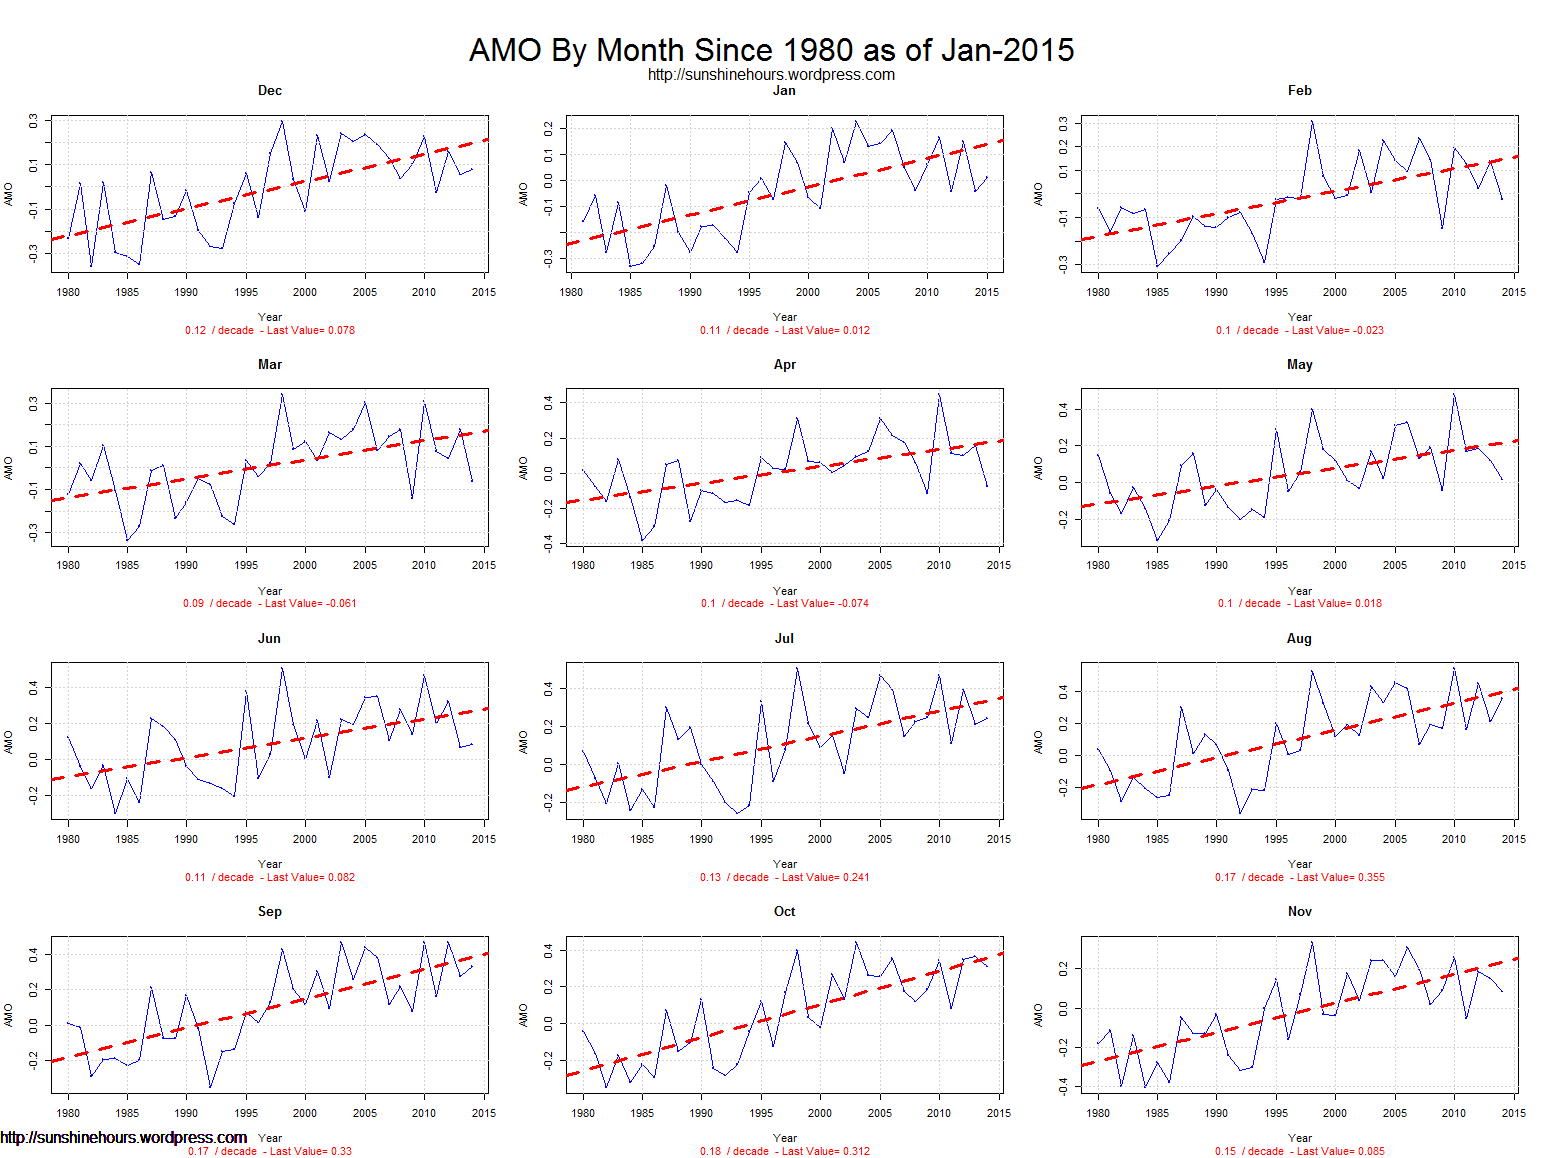
The AMO is getting ready for the big plunge (see bottom graph’s) and is only staying high in just a few months – Aug/Sep/Oct.
It may take decades for the AMO to hit bottom.
And I suspect the Arctic will refreeze and the Antarctic will melt some. And climate “scientists” will claim they predicted it all along.