
Tag: Global Sea Ice Extent
Sea Ice Extent – Day 41


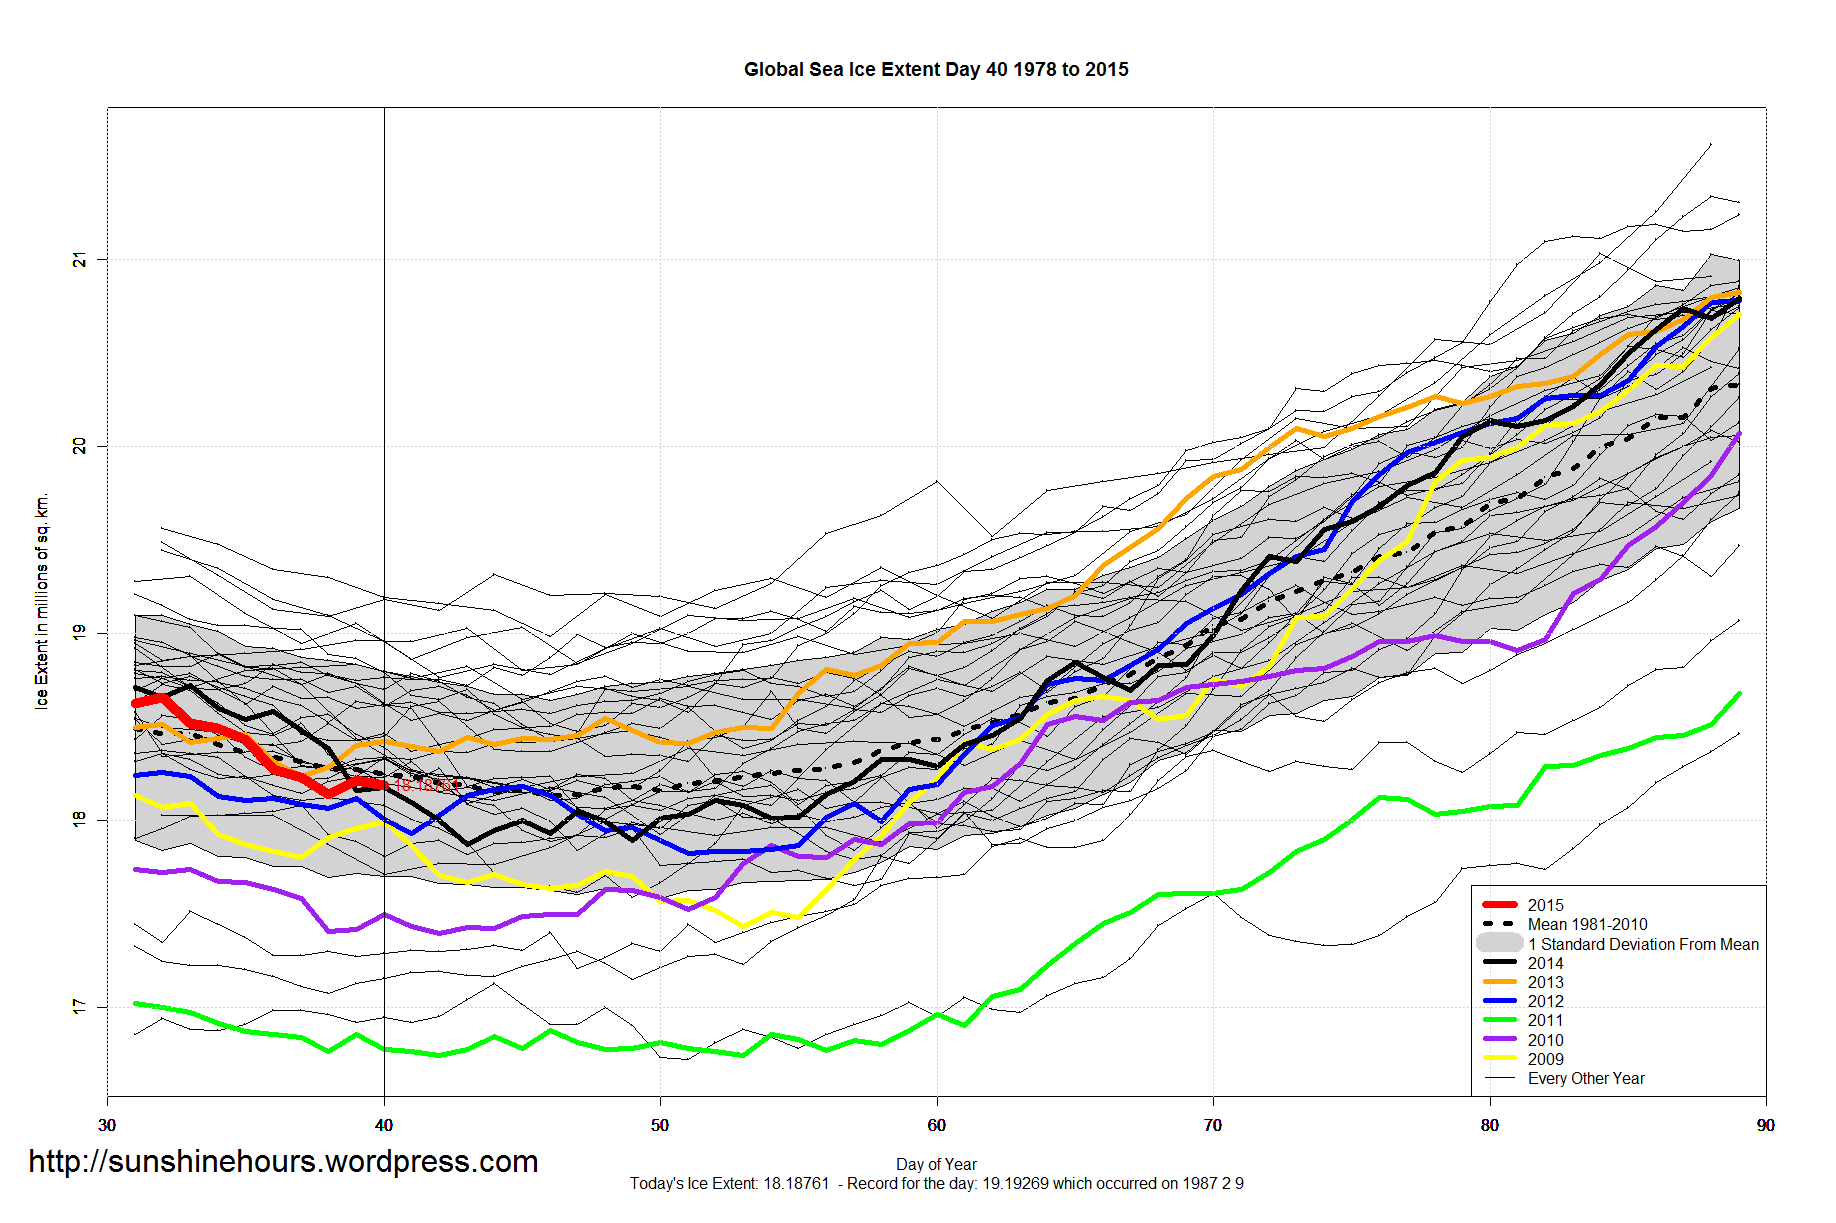
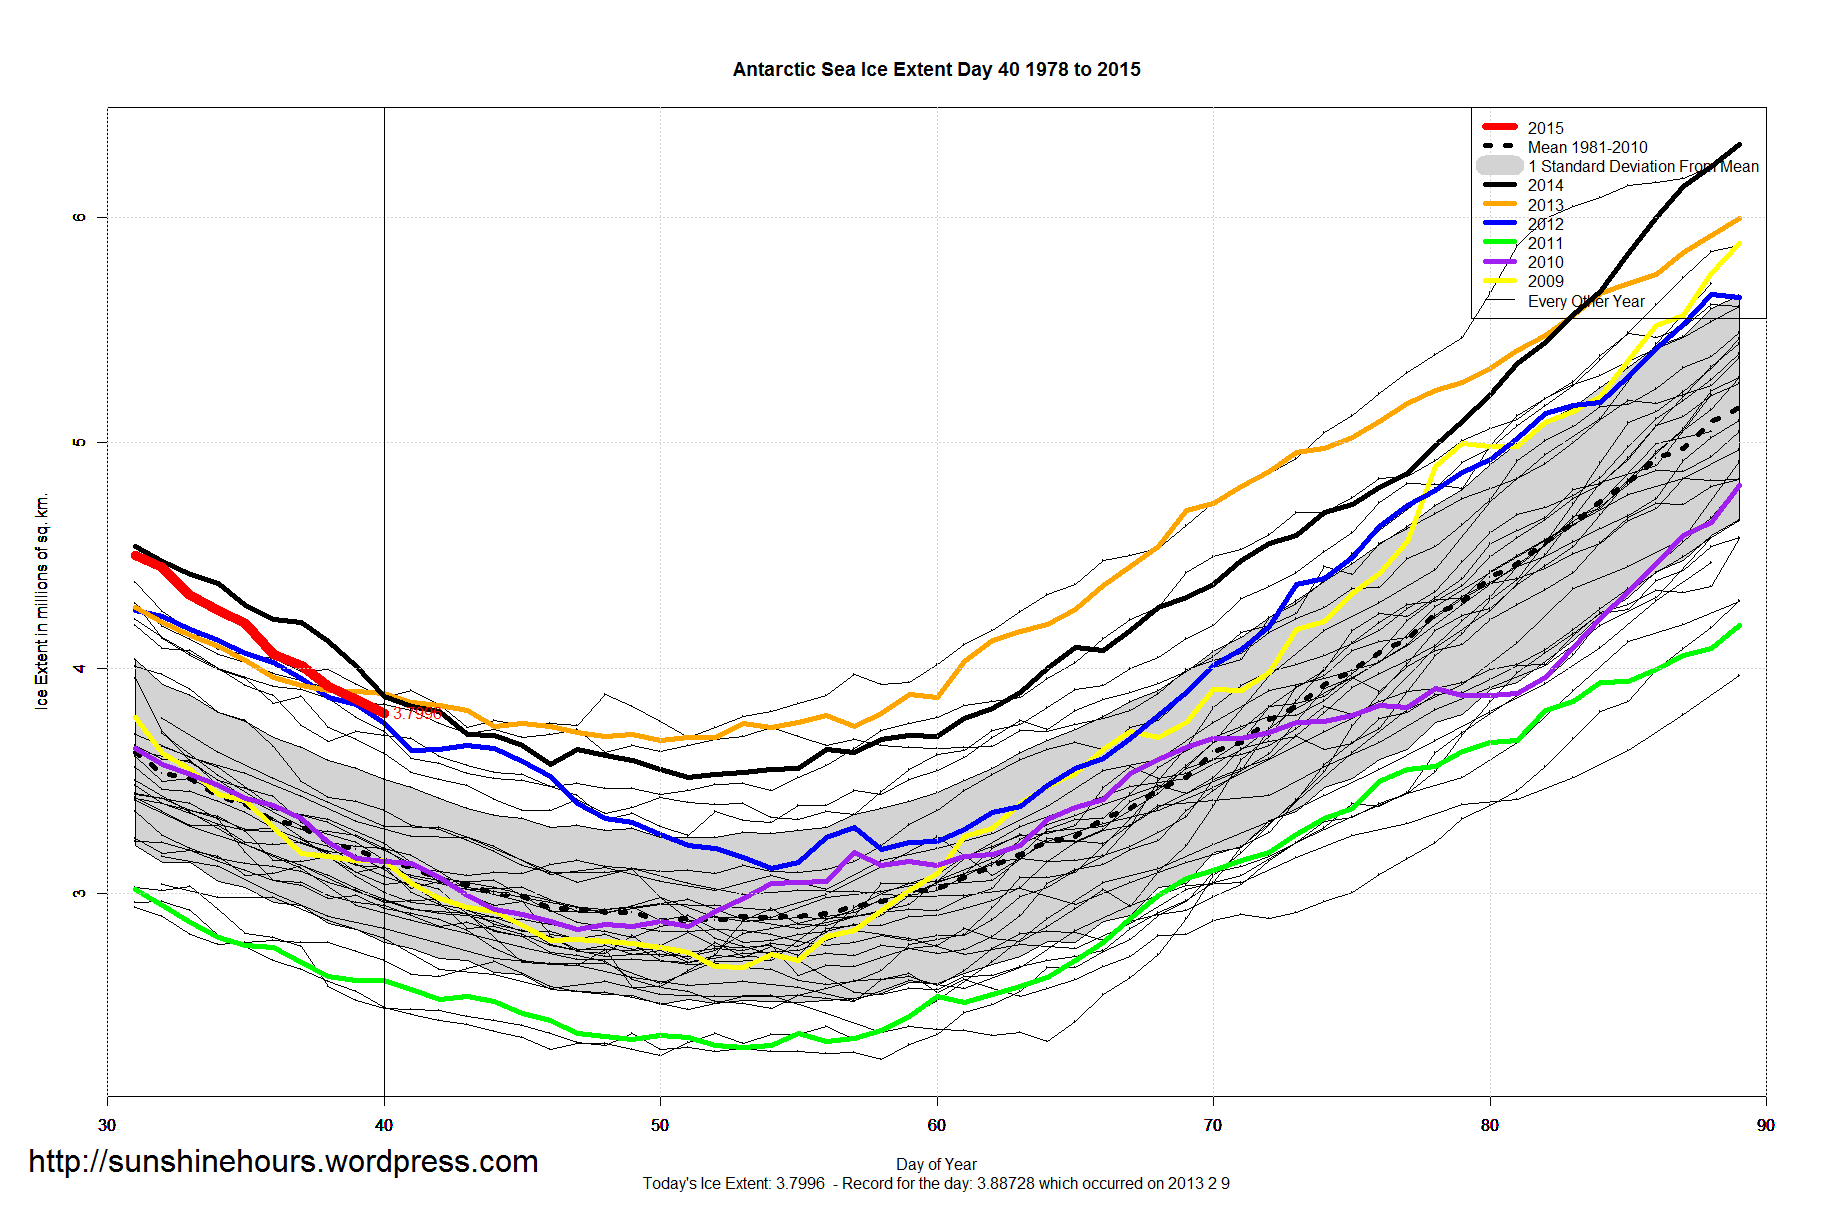
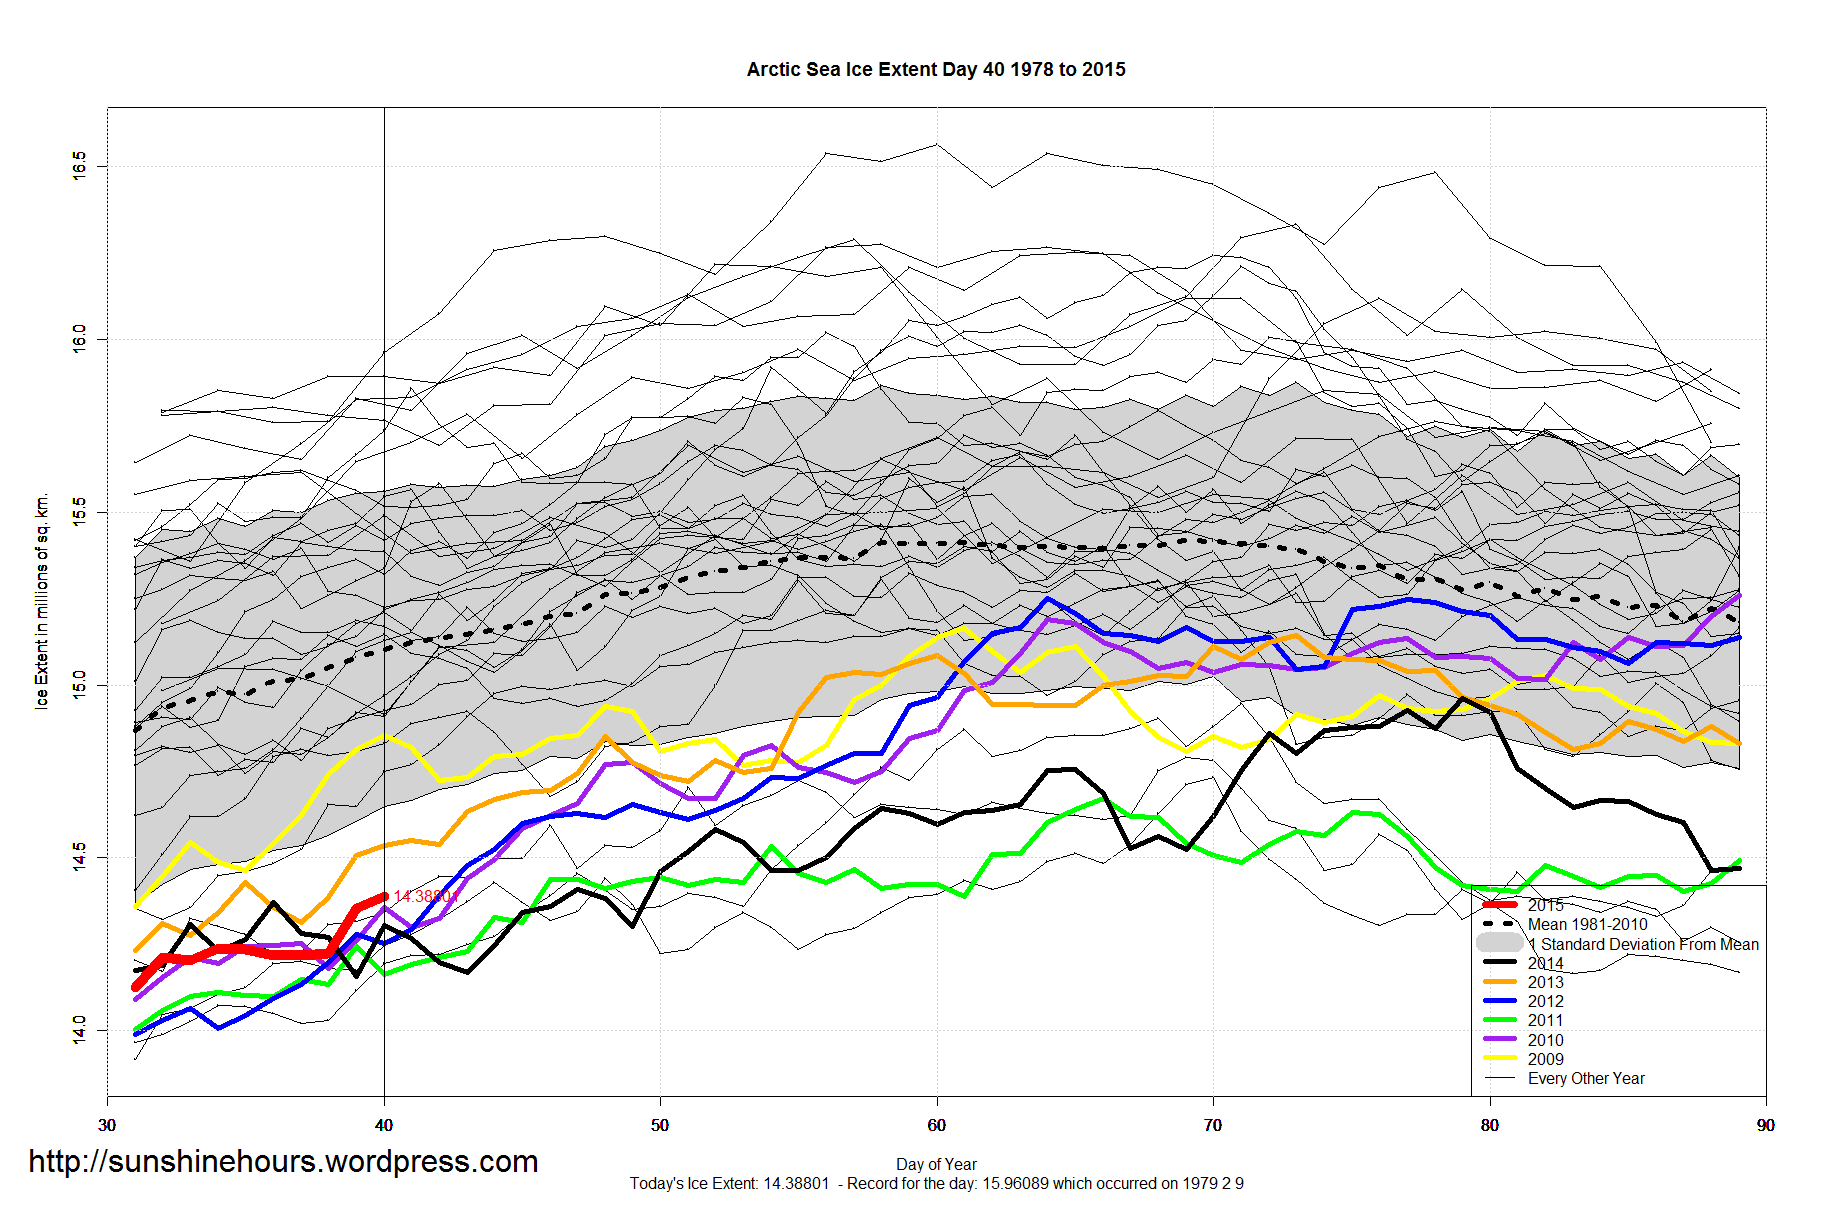
Sea Ice Extent – Day 40
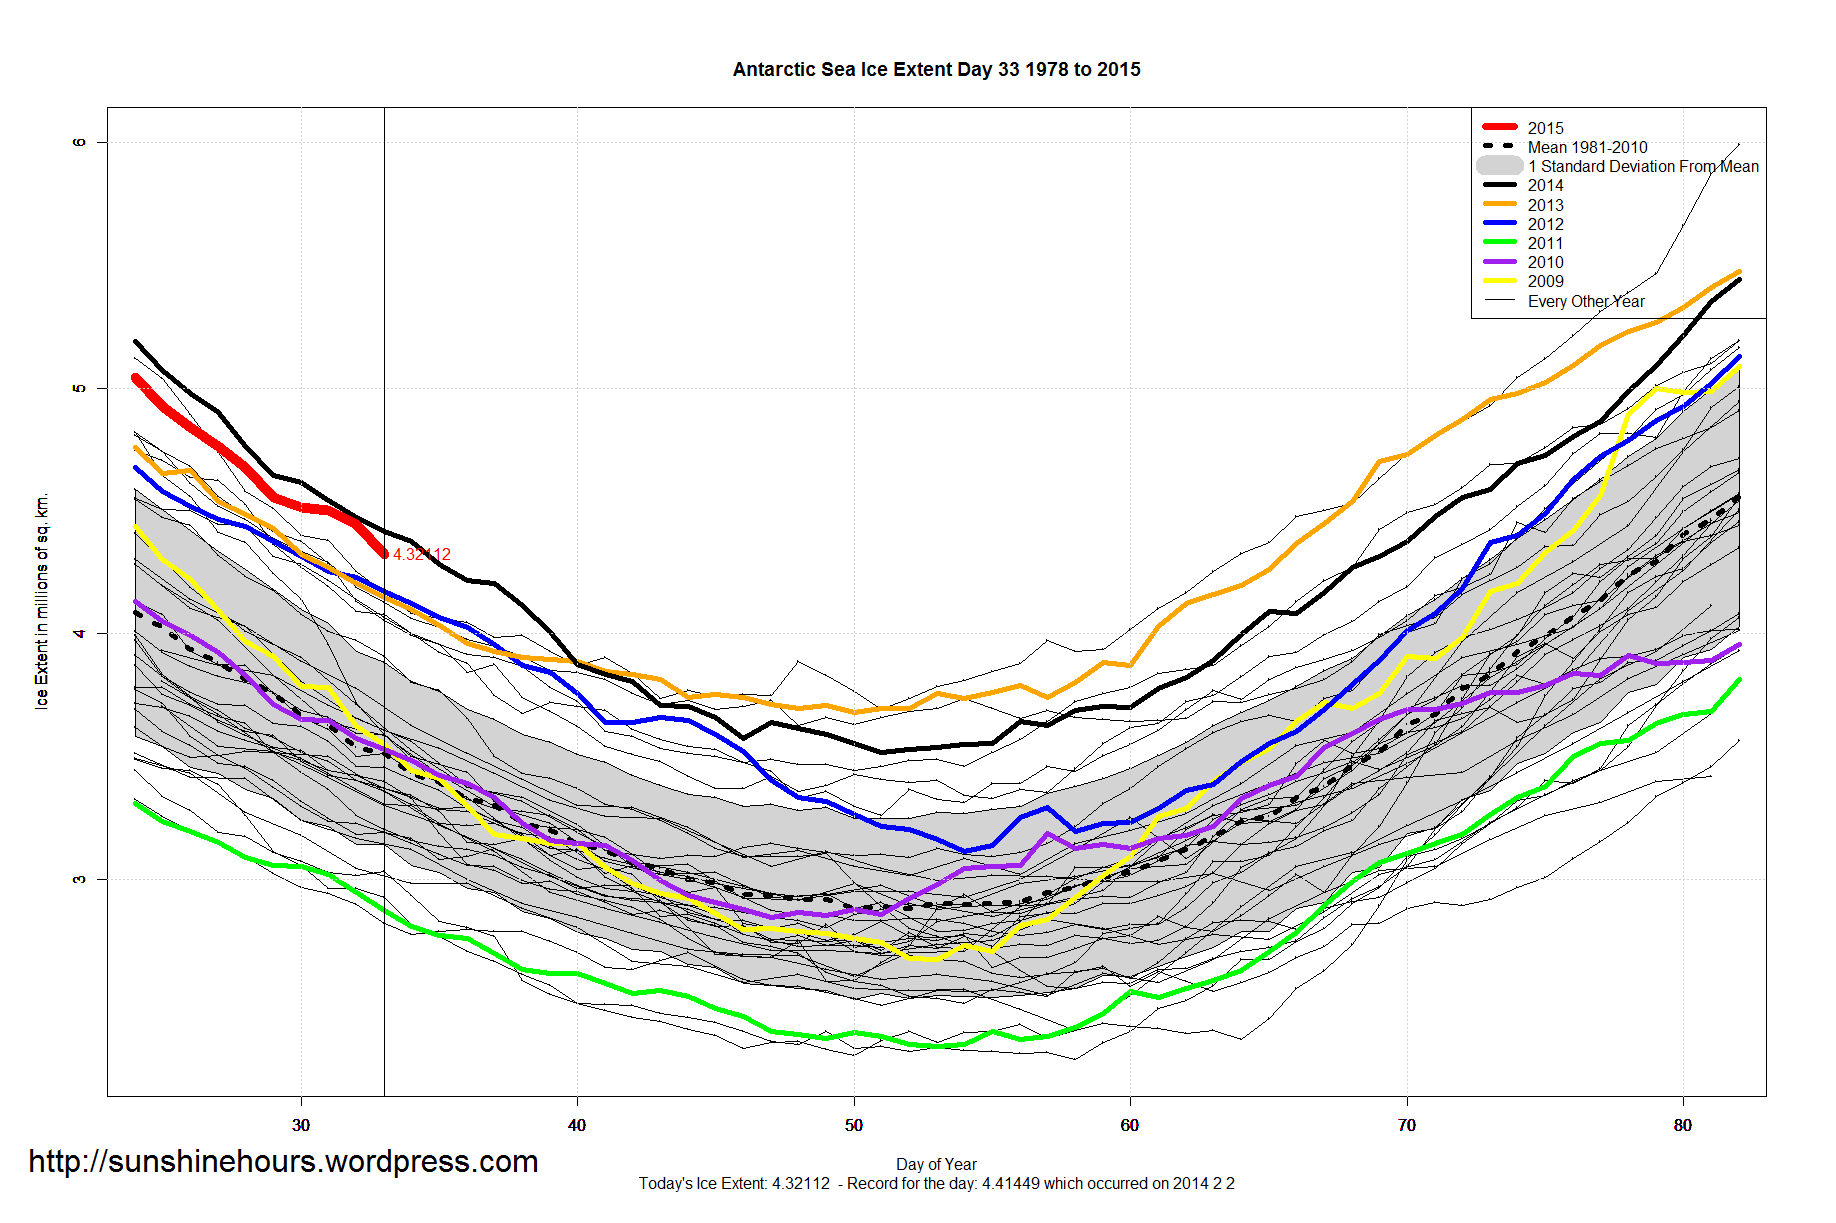
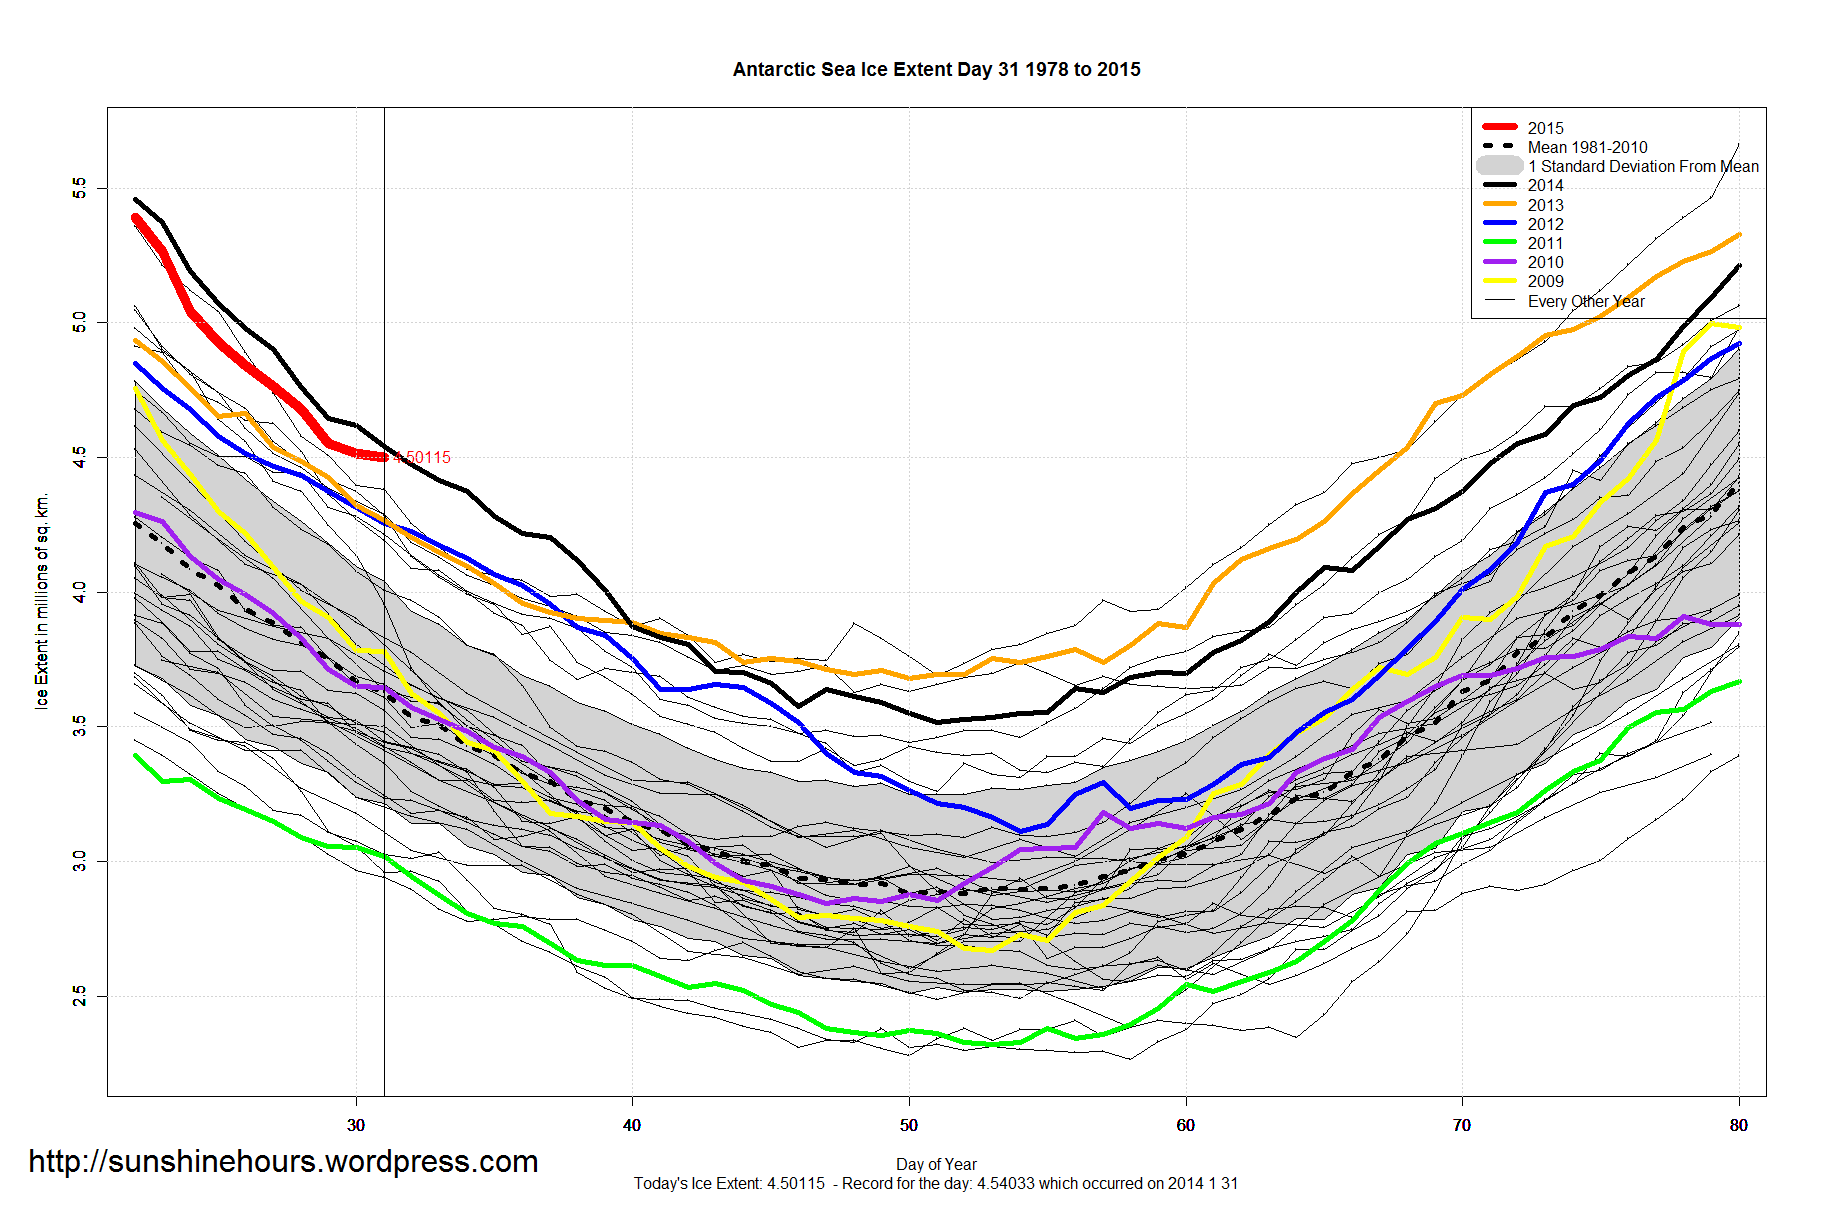
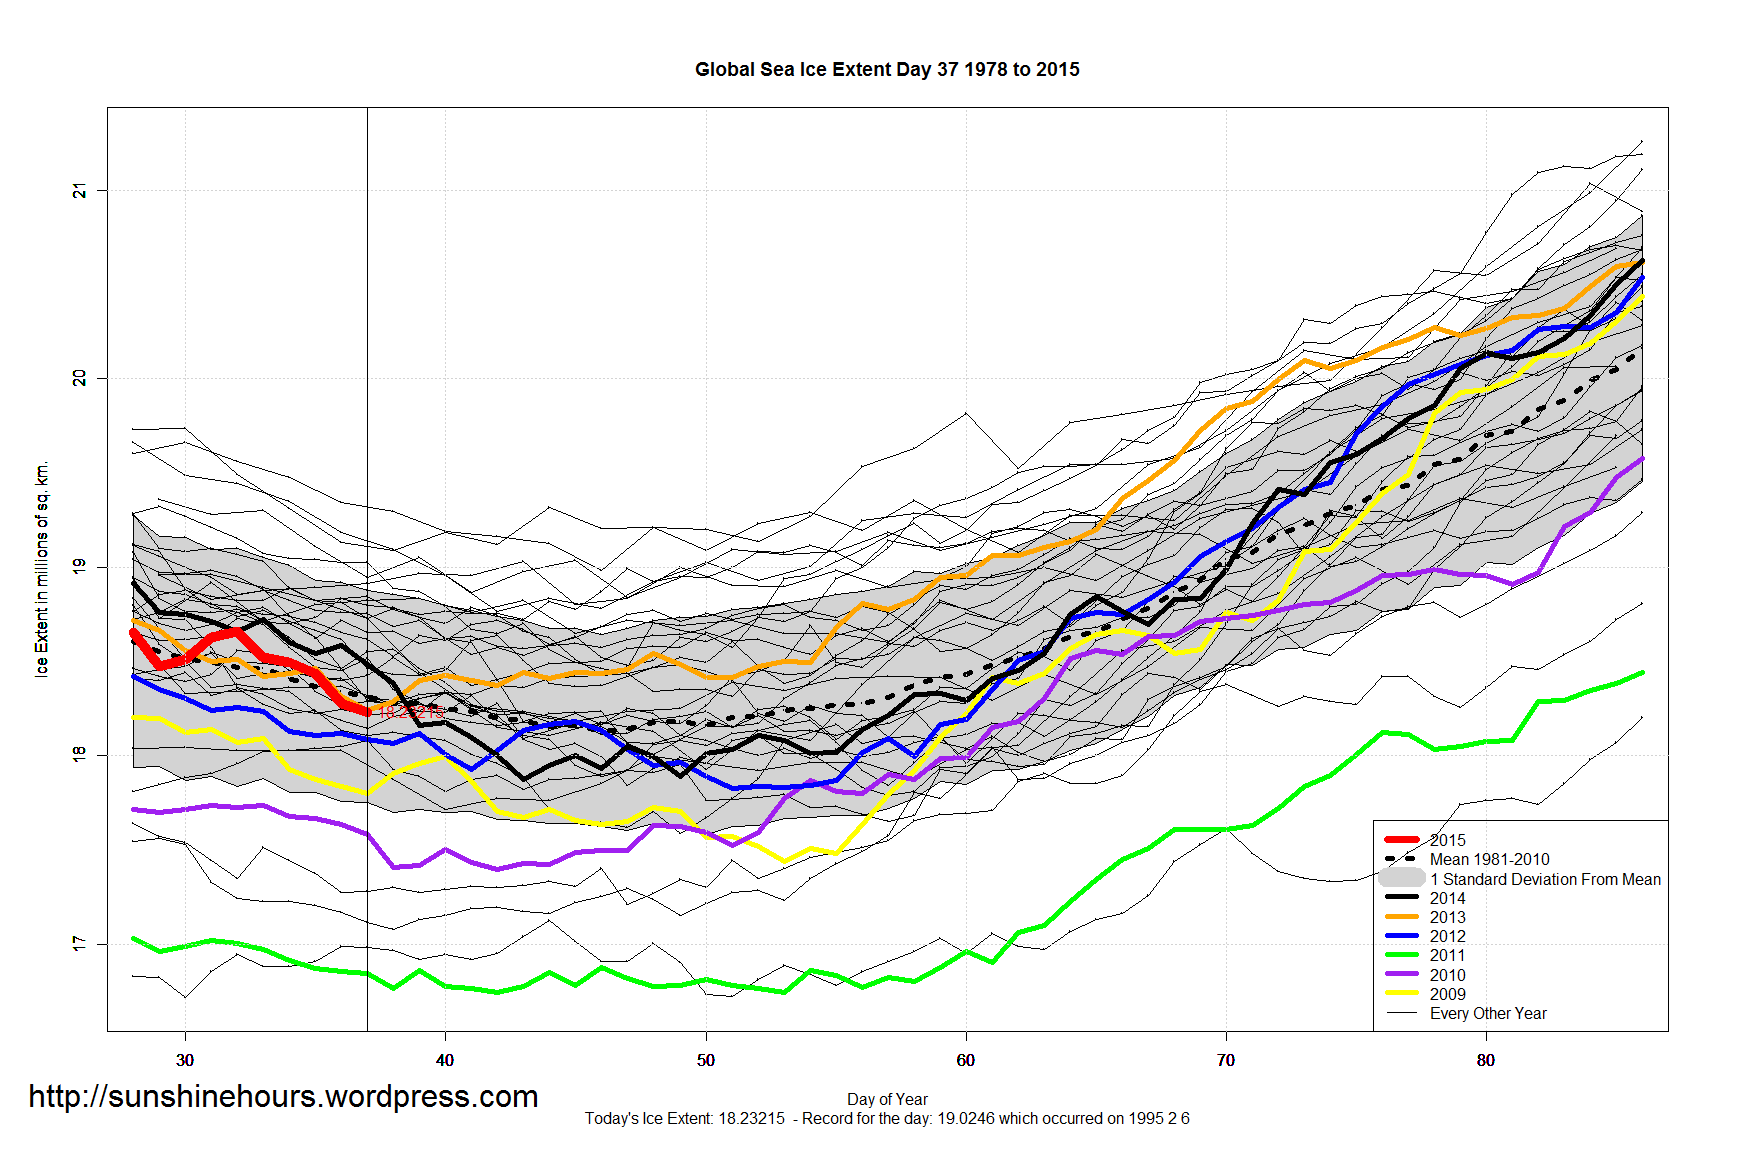
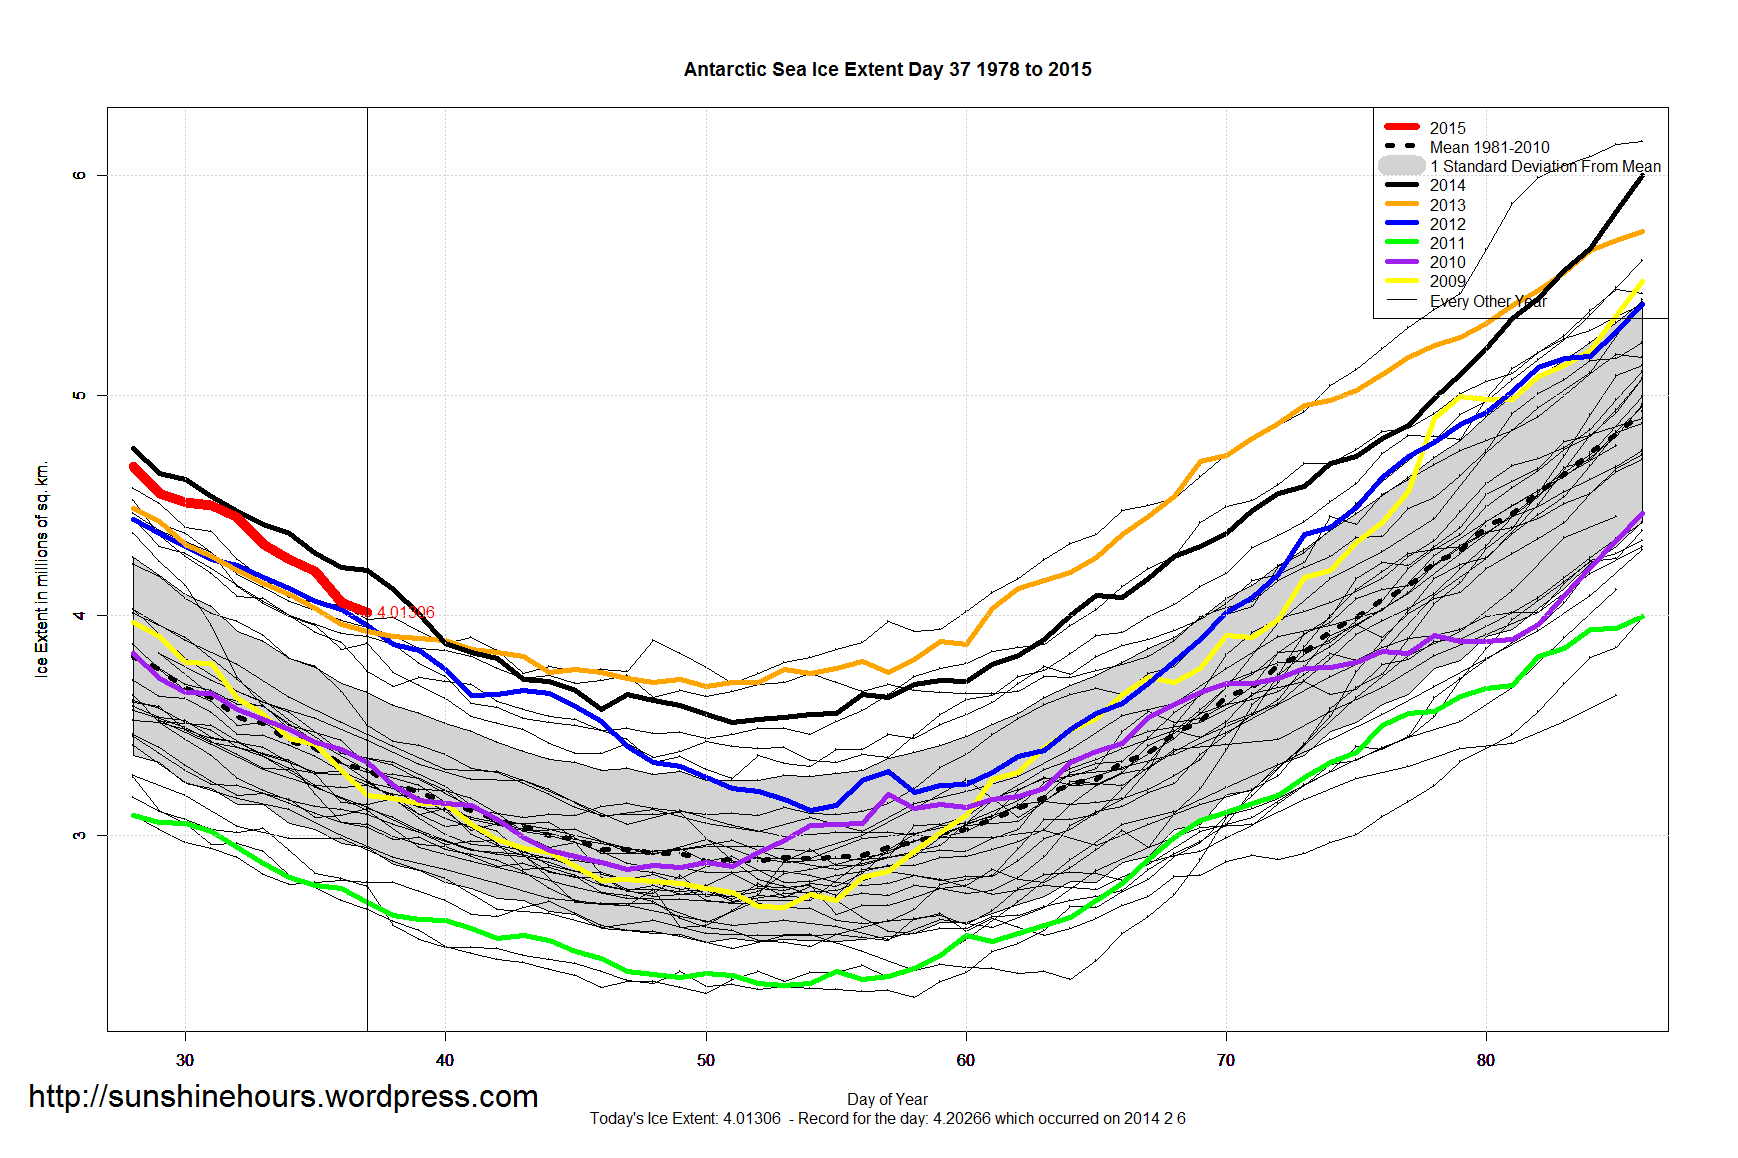
Sea Ice Extent – Day 37 – Antarctica 700,000 sq km Above Mean
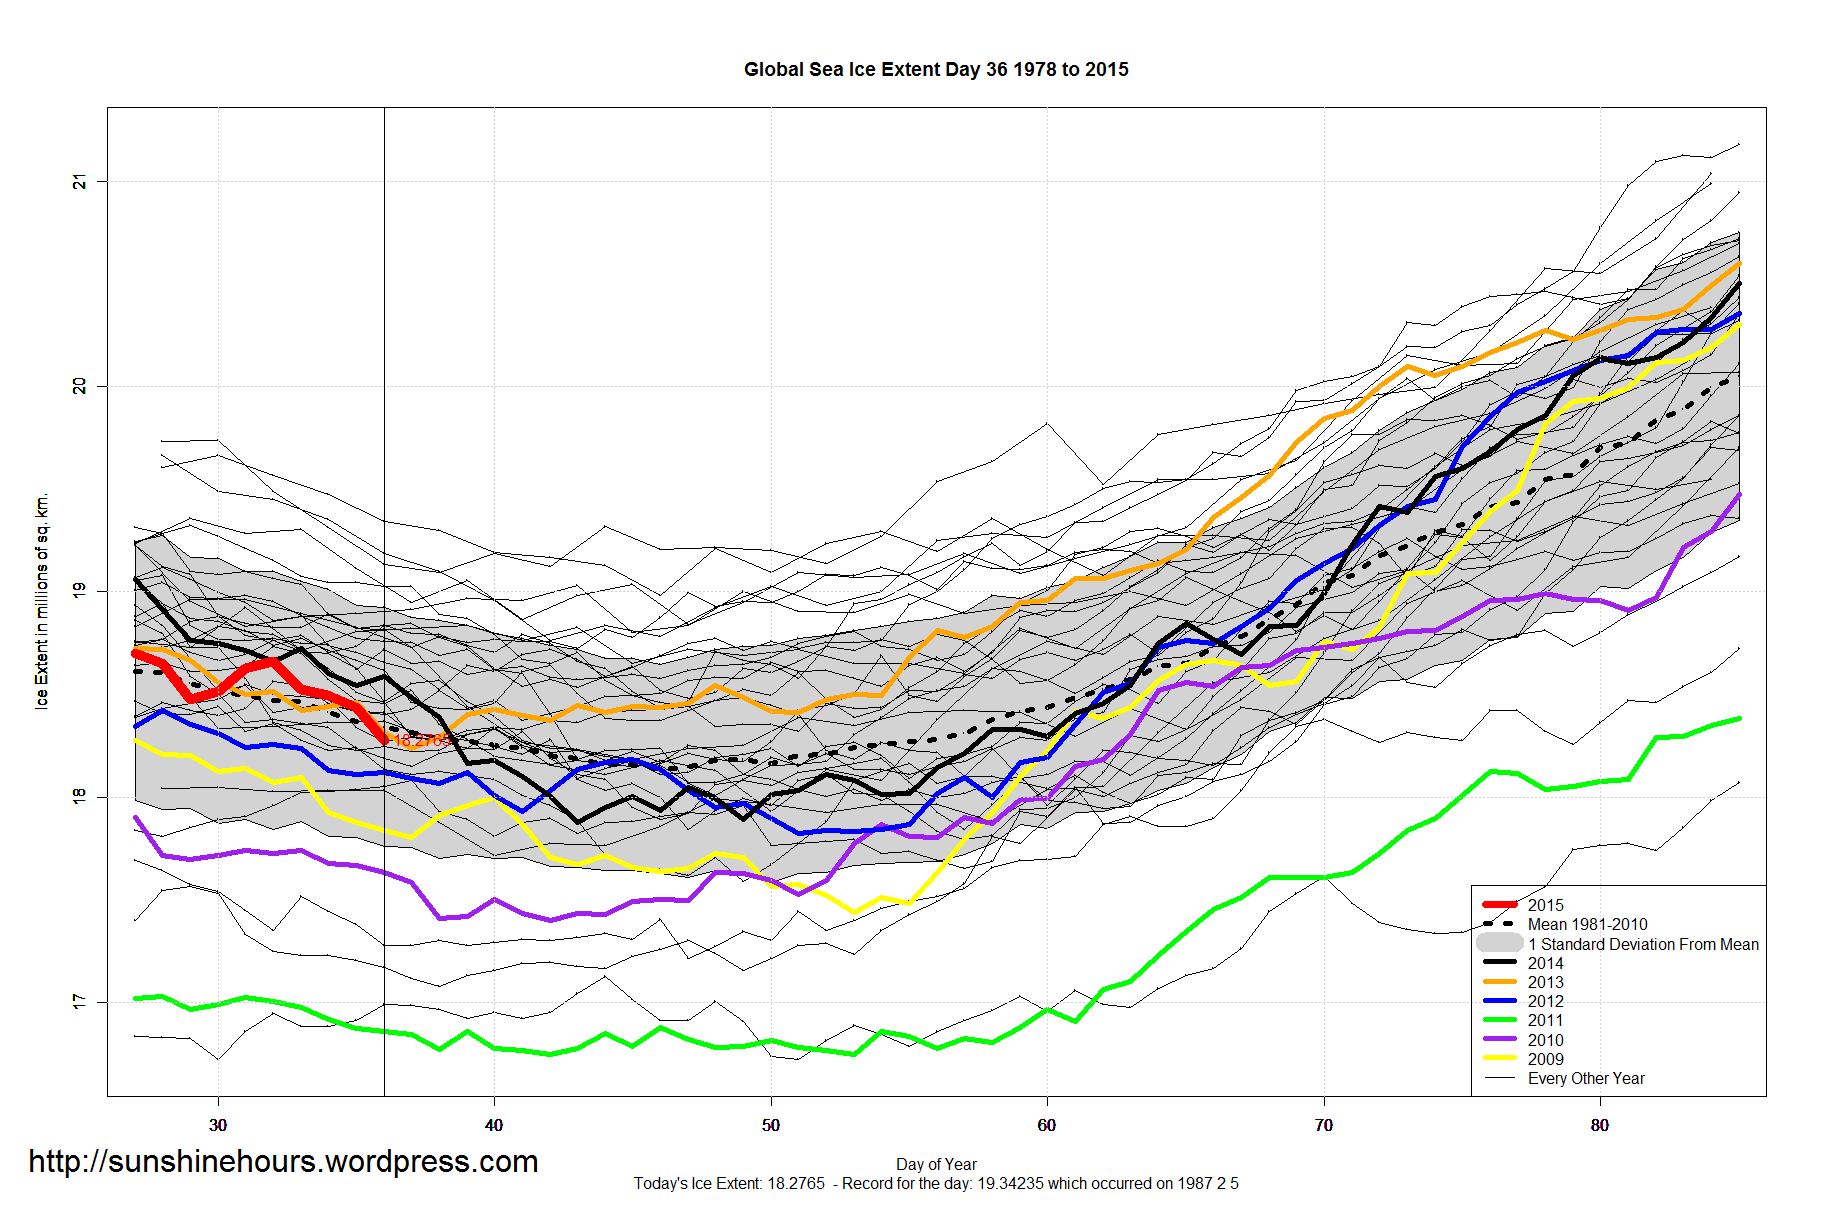
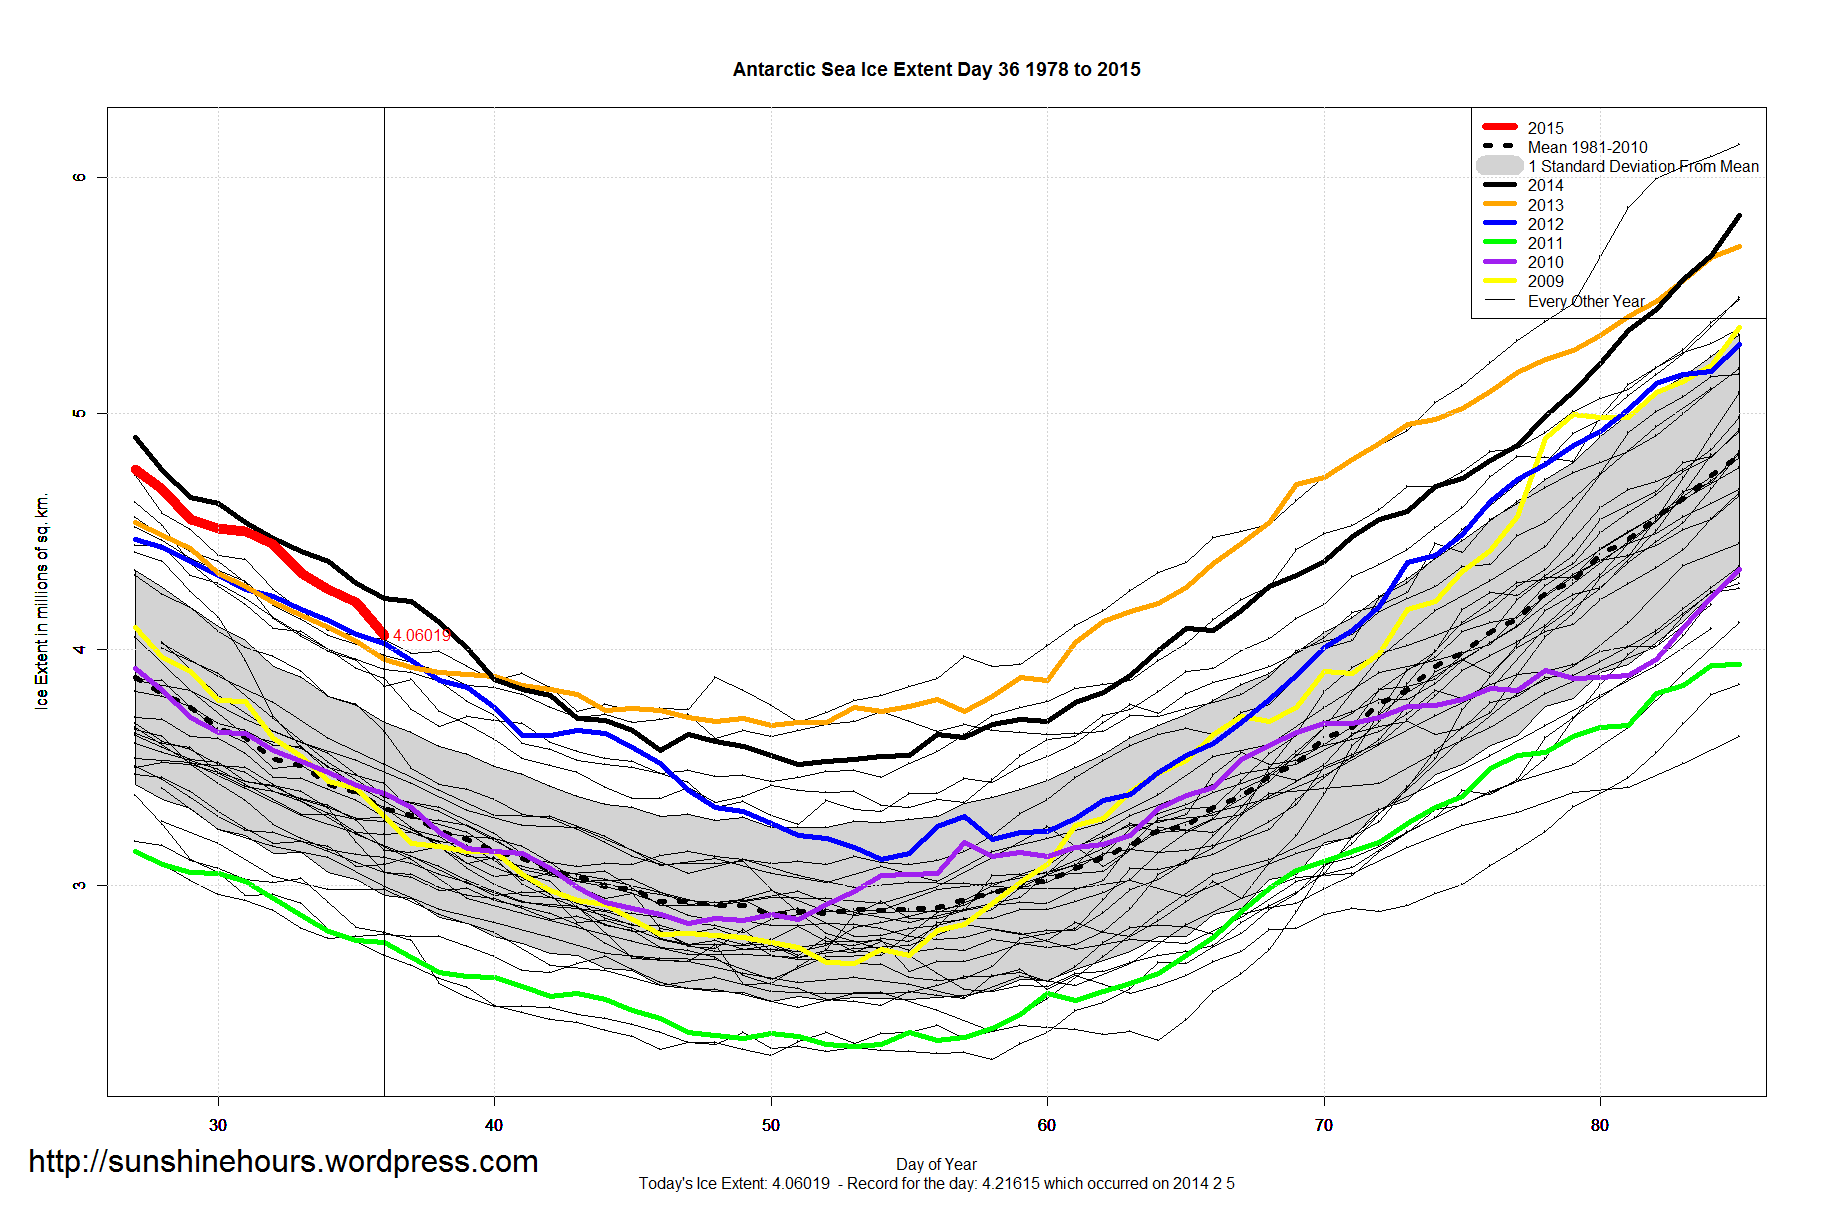
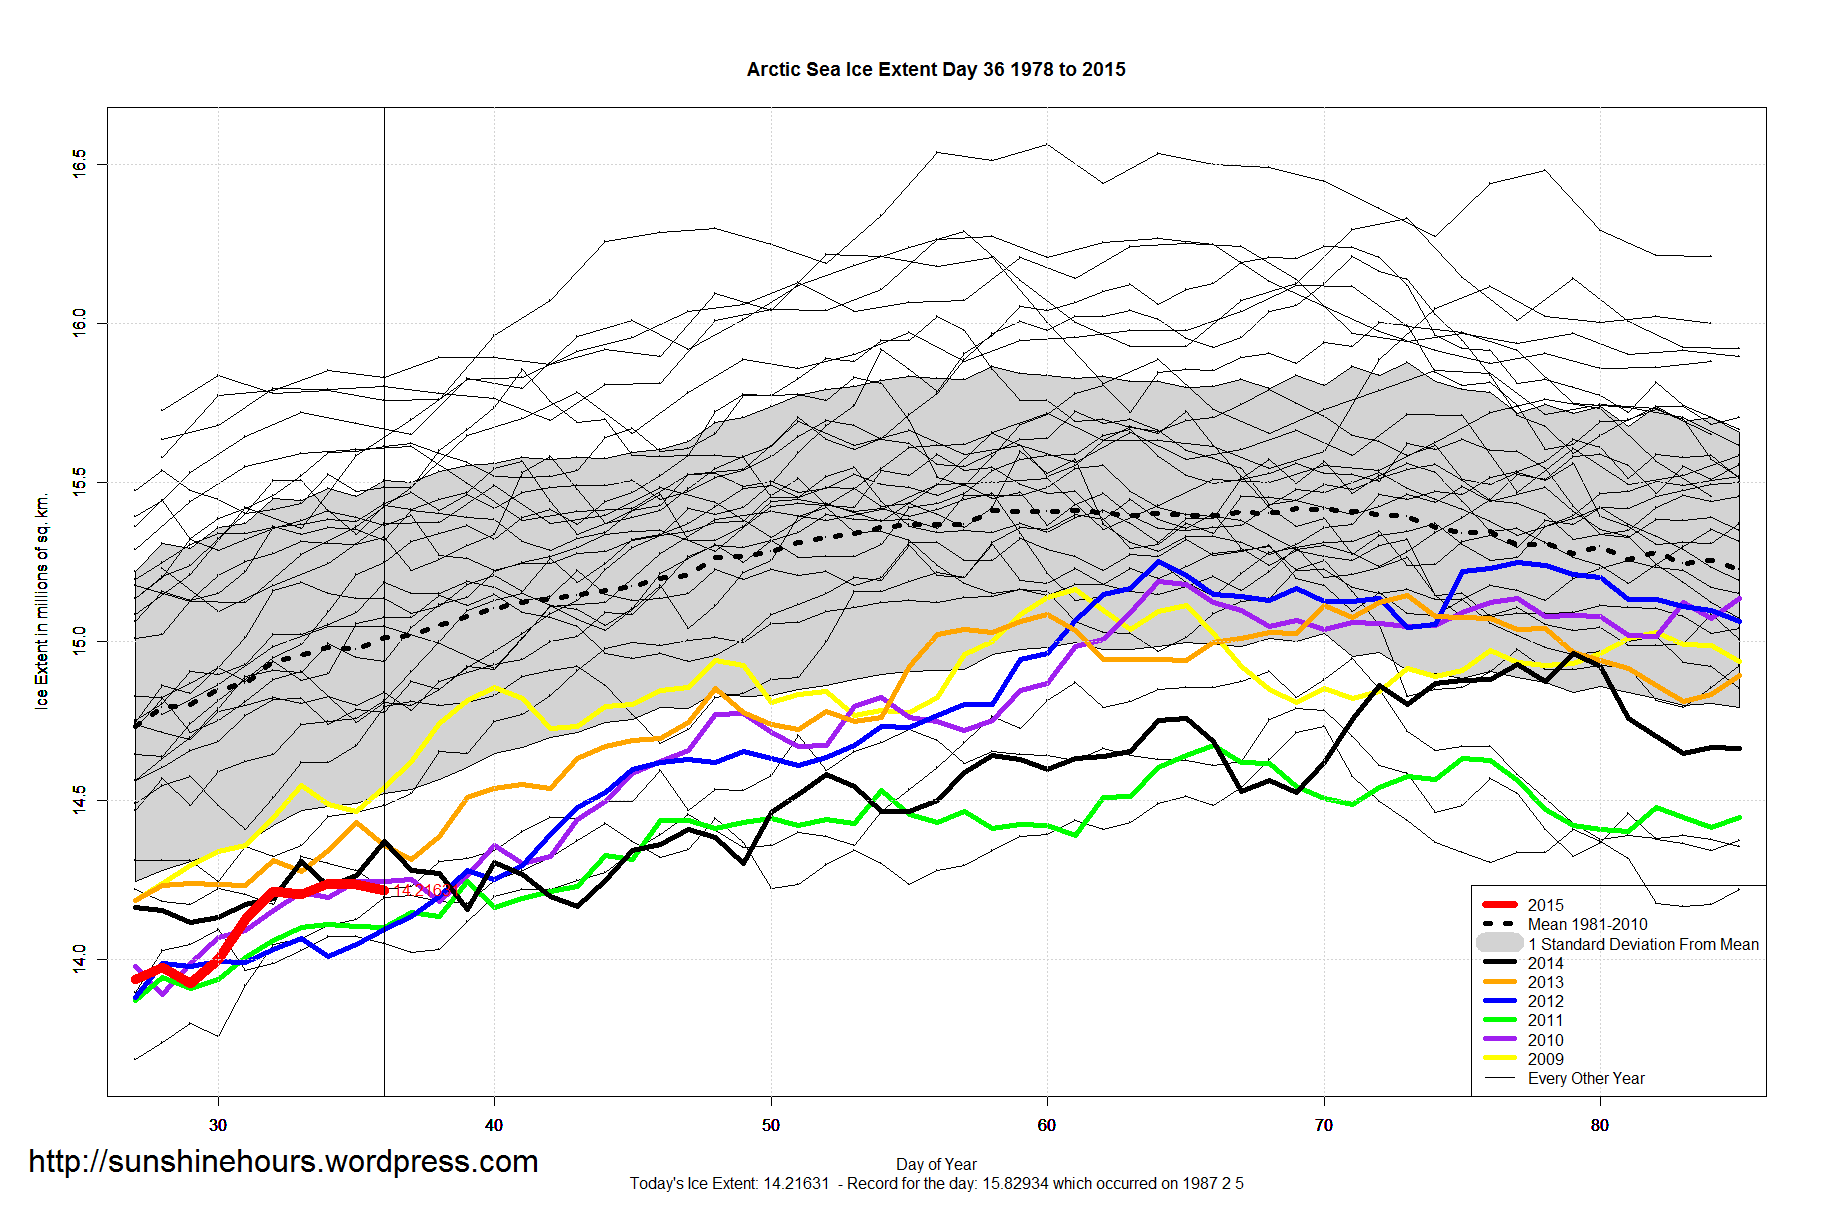
Sea Ice Extent – Day 36
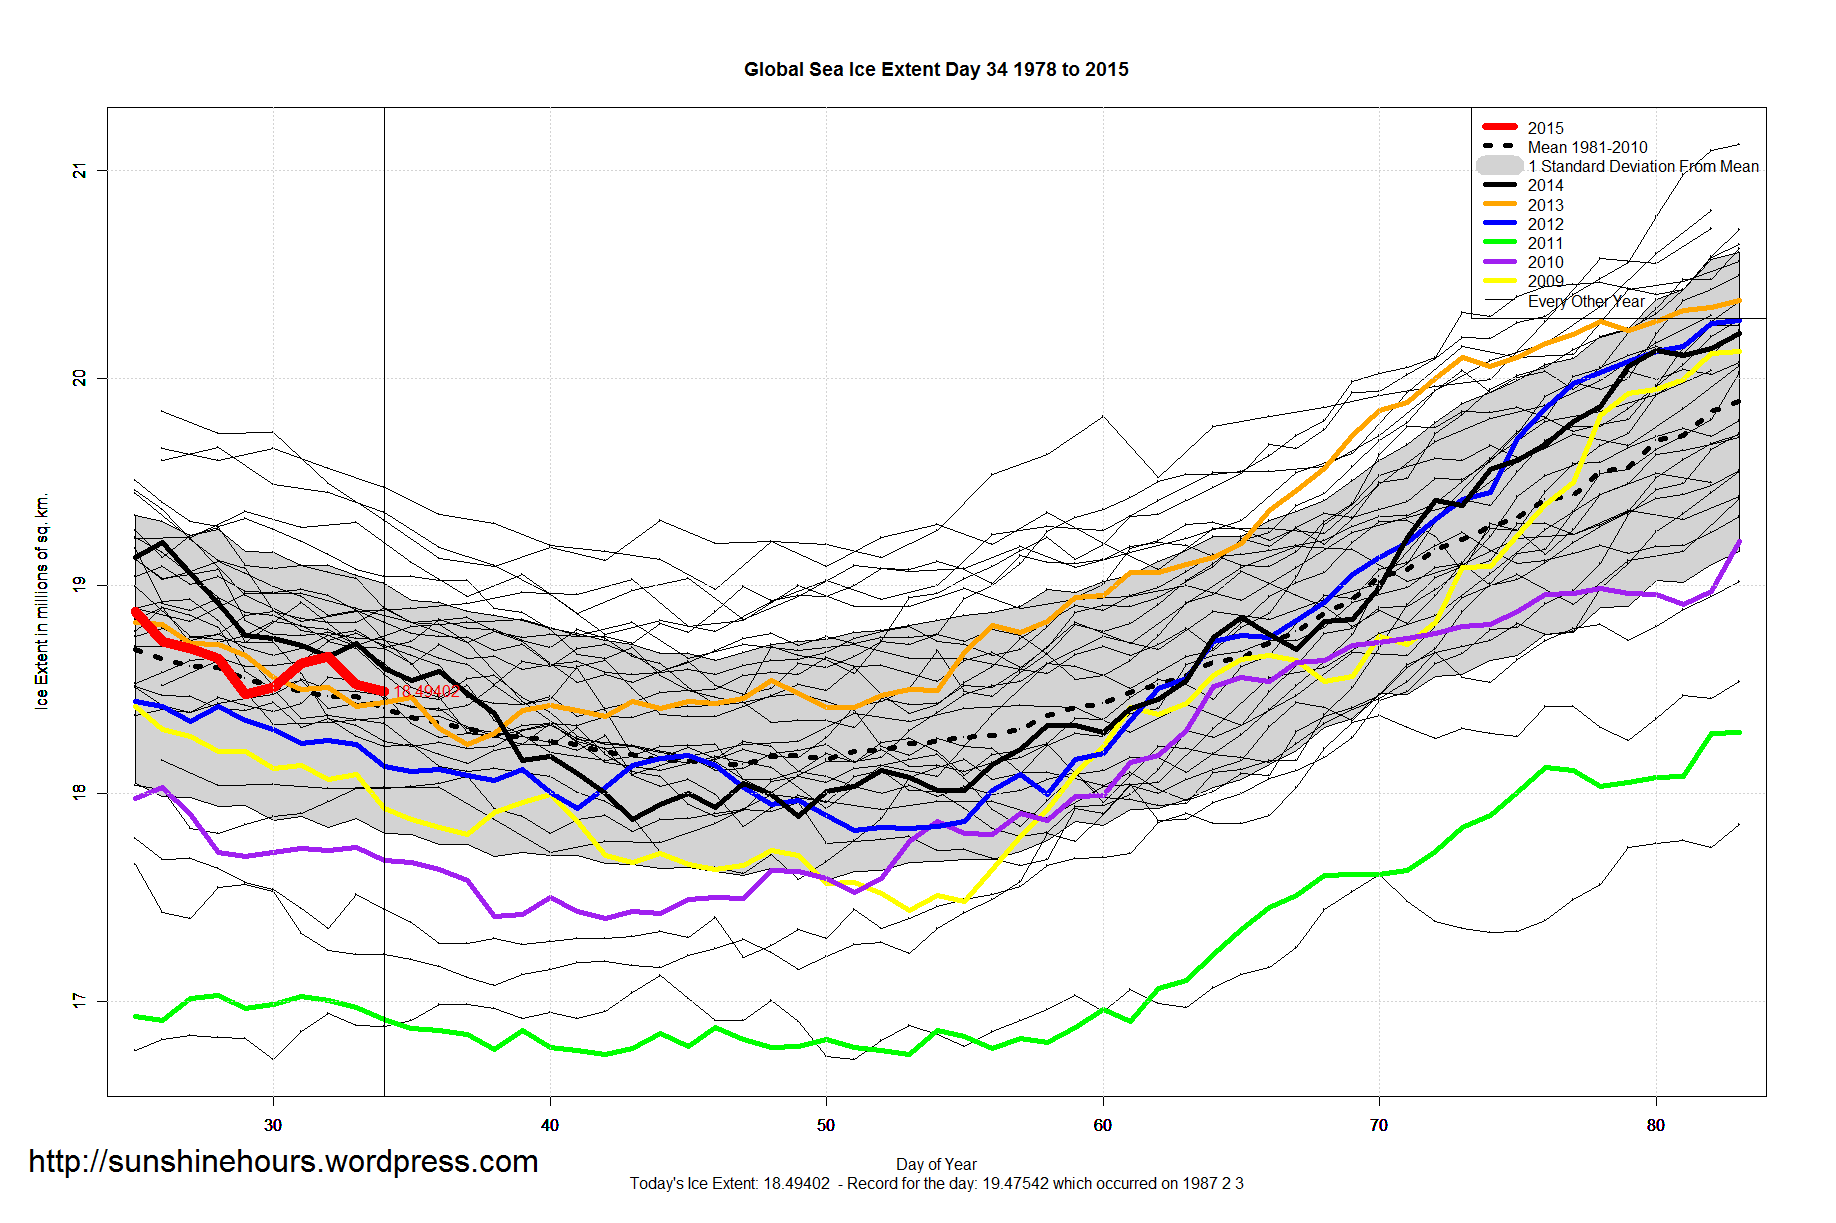
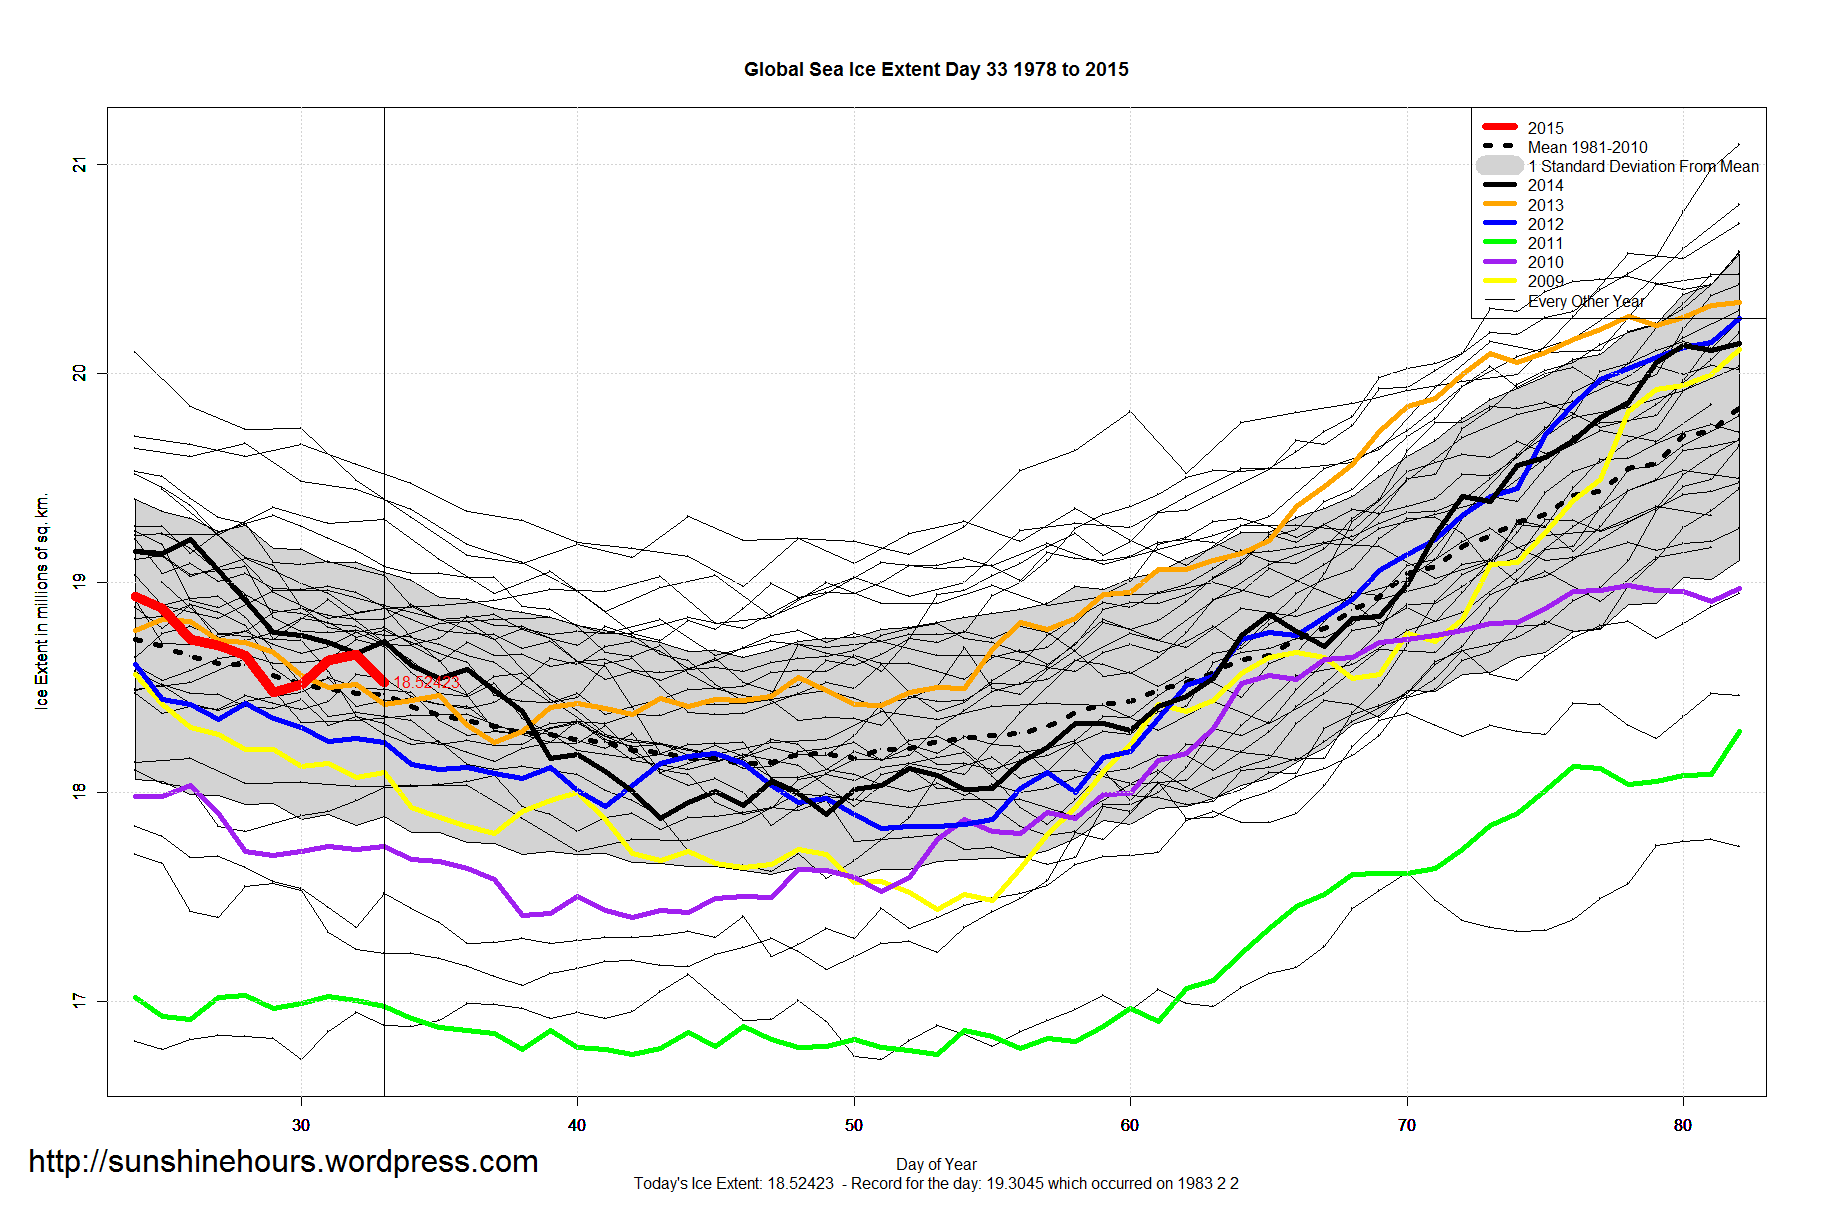
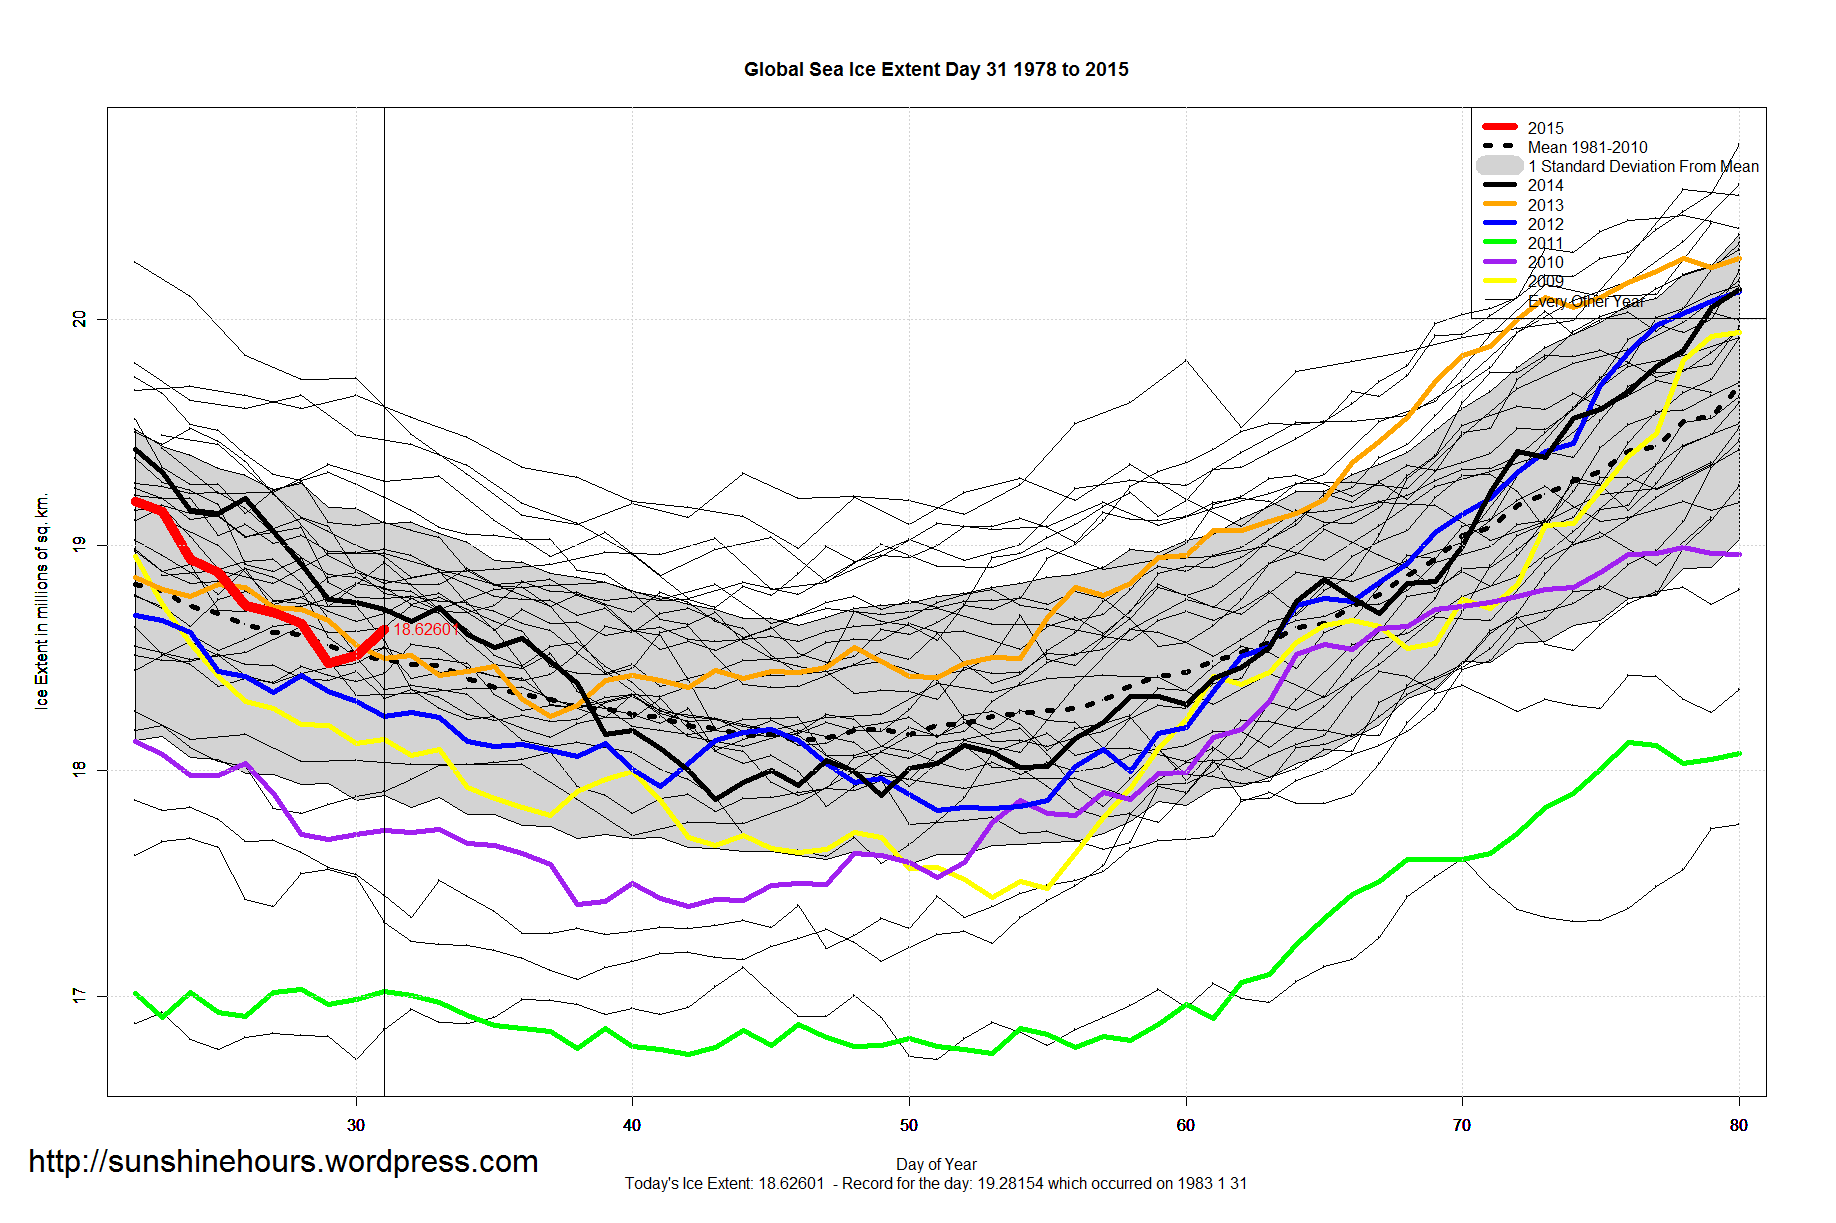
Sea Ice Extent – Day 34 – Global Sea Ice Above Mean (And 1984 1985 1993 1996 1997 1999 2000 2002 2004 2005 2006 2007 2009 2010 2011 2012)


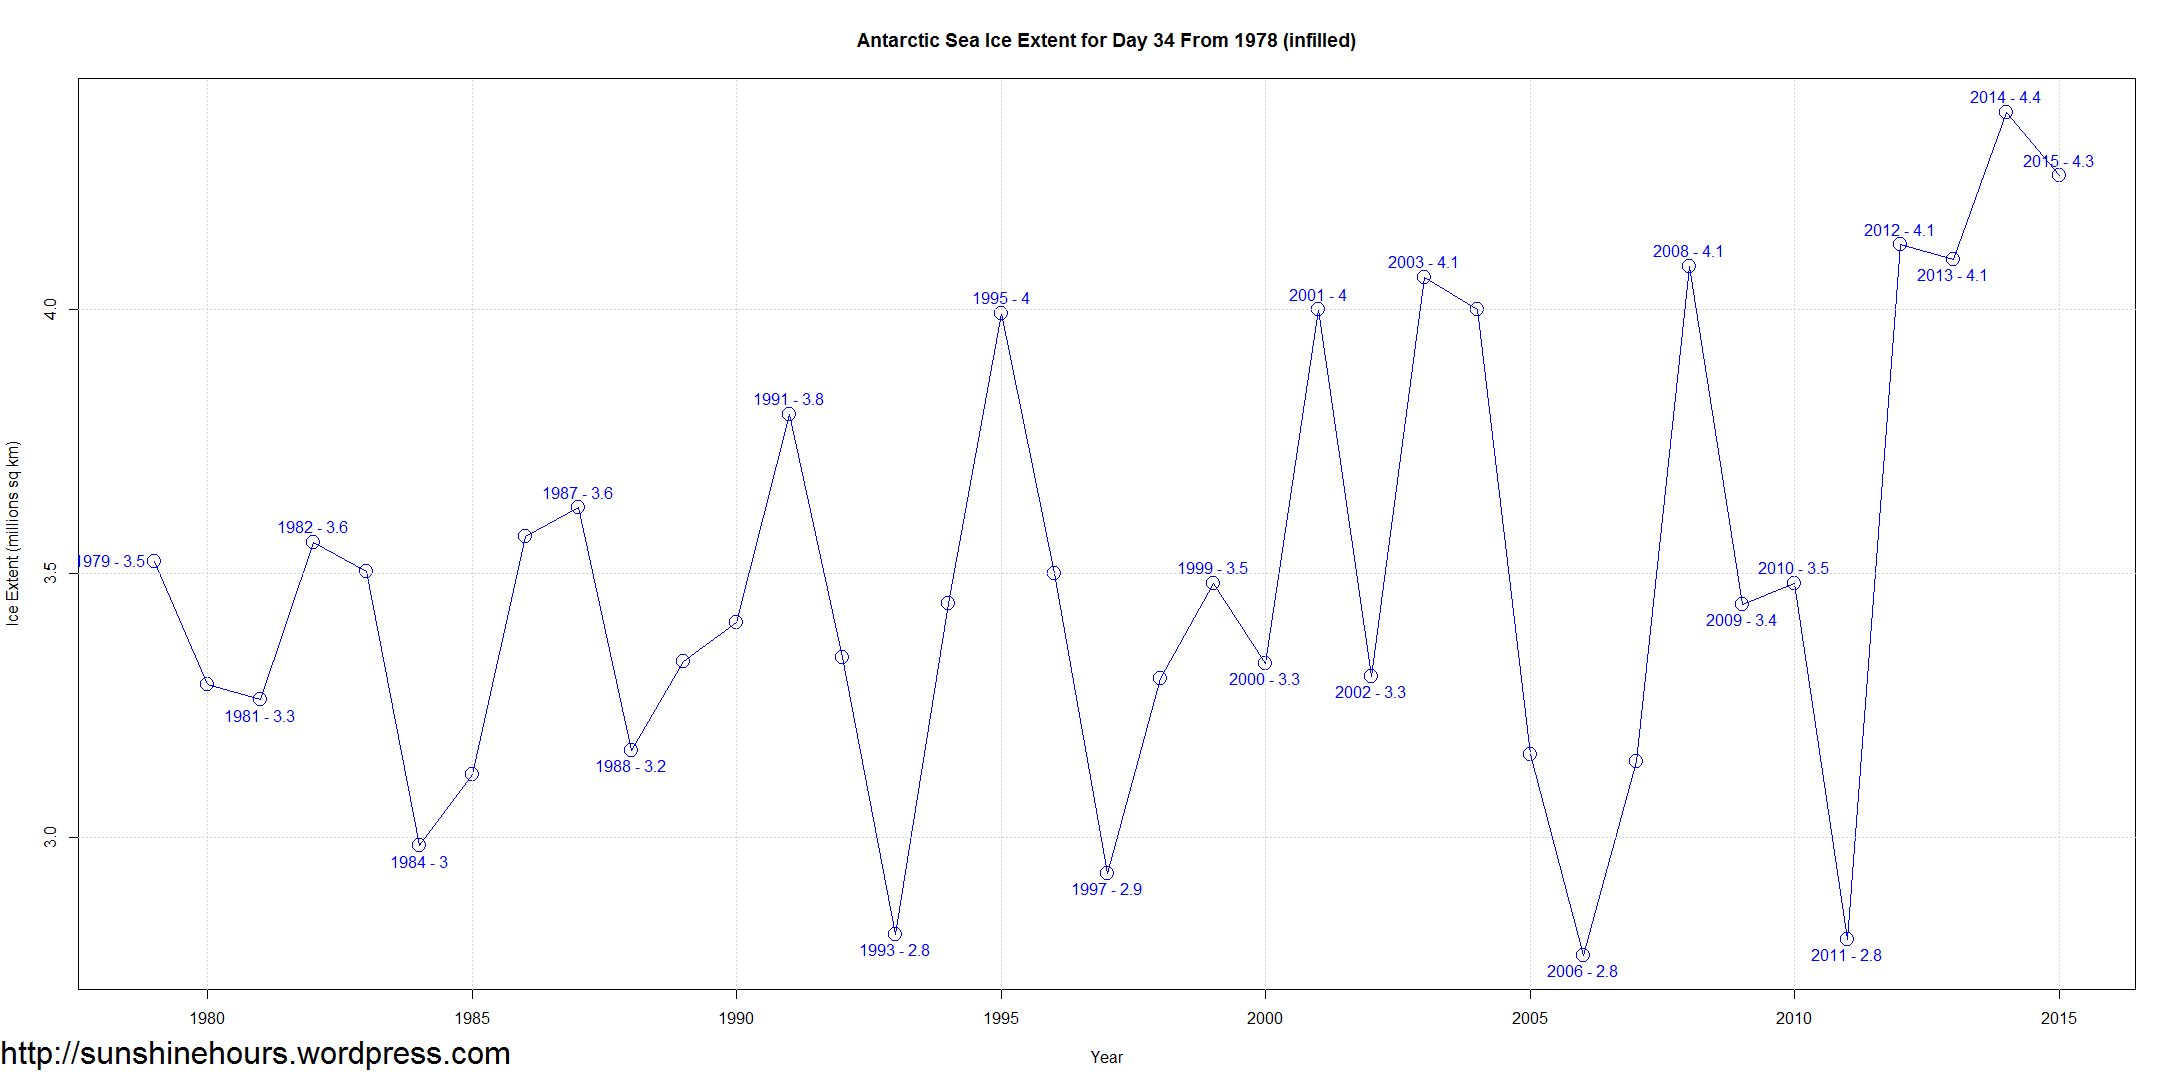
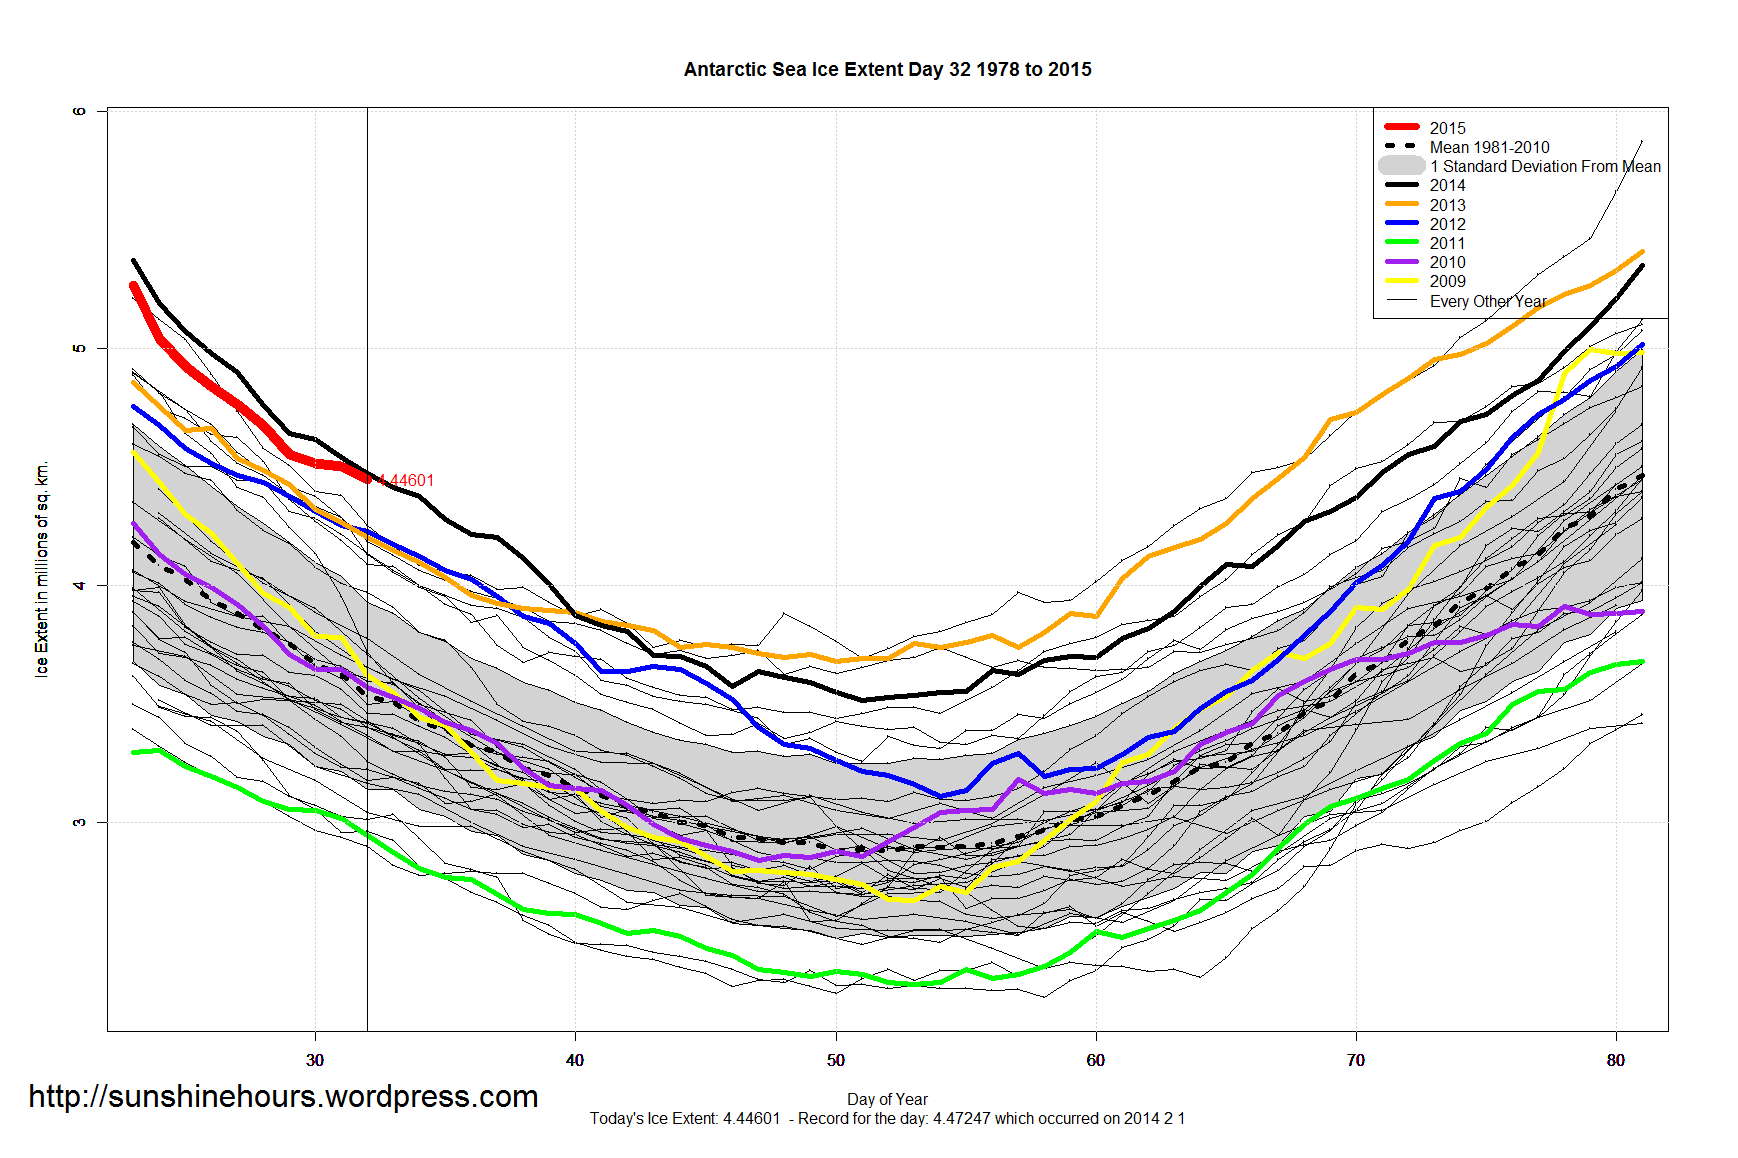
Sea Ice Extent – Day 34 – Antarctic Sawtooth
Normally (as you can see from the graph below) at this time of year Antarctic Sea Ice is high one or two years and then drops as much as 1.3 million sq km to a low (even a new) low and then repeats.
From 2012 the big drop in the sawtooth pattern stopped. From 2012 every value is above every value before 2012 (with a little license for the tiny dip from 2012 to 2013).