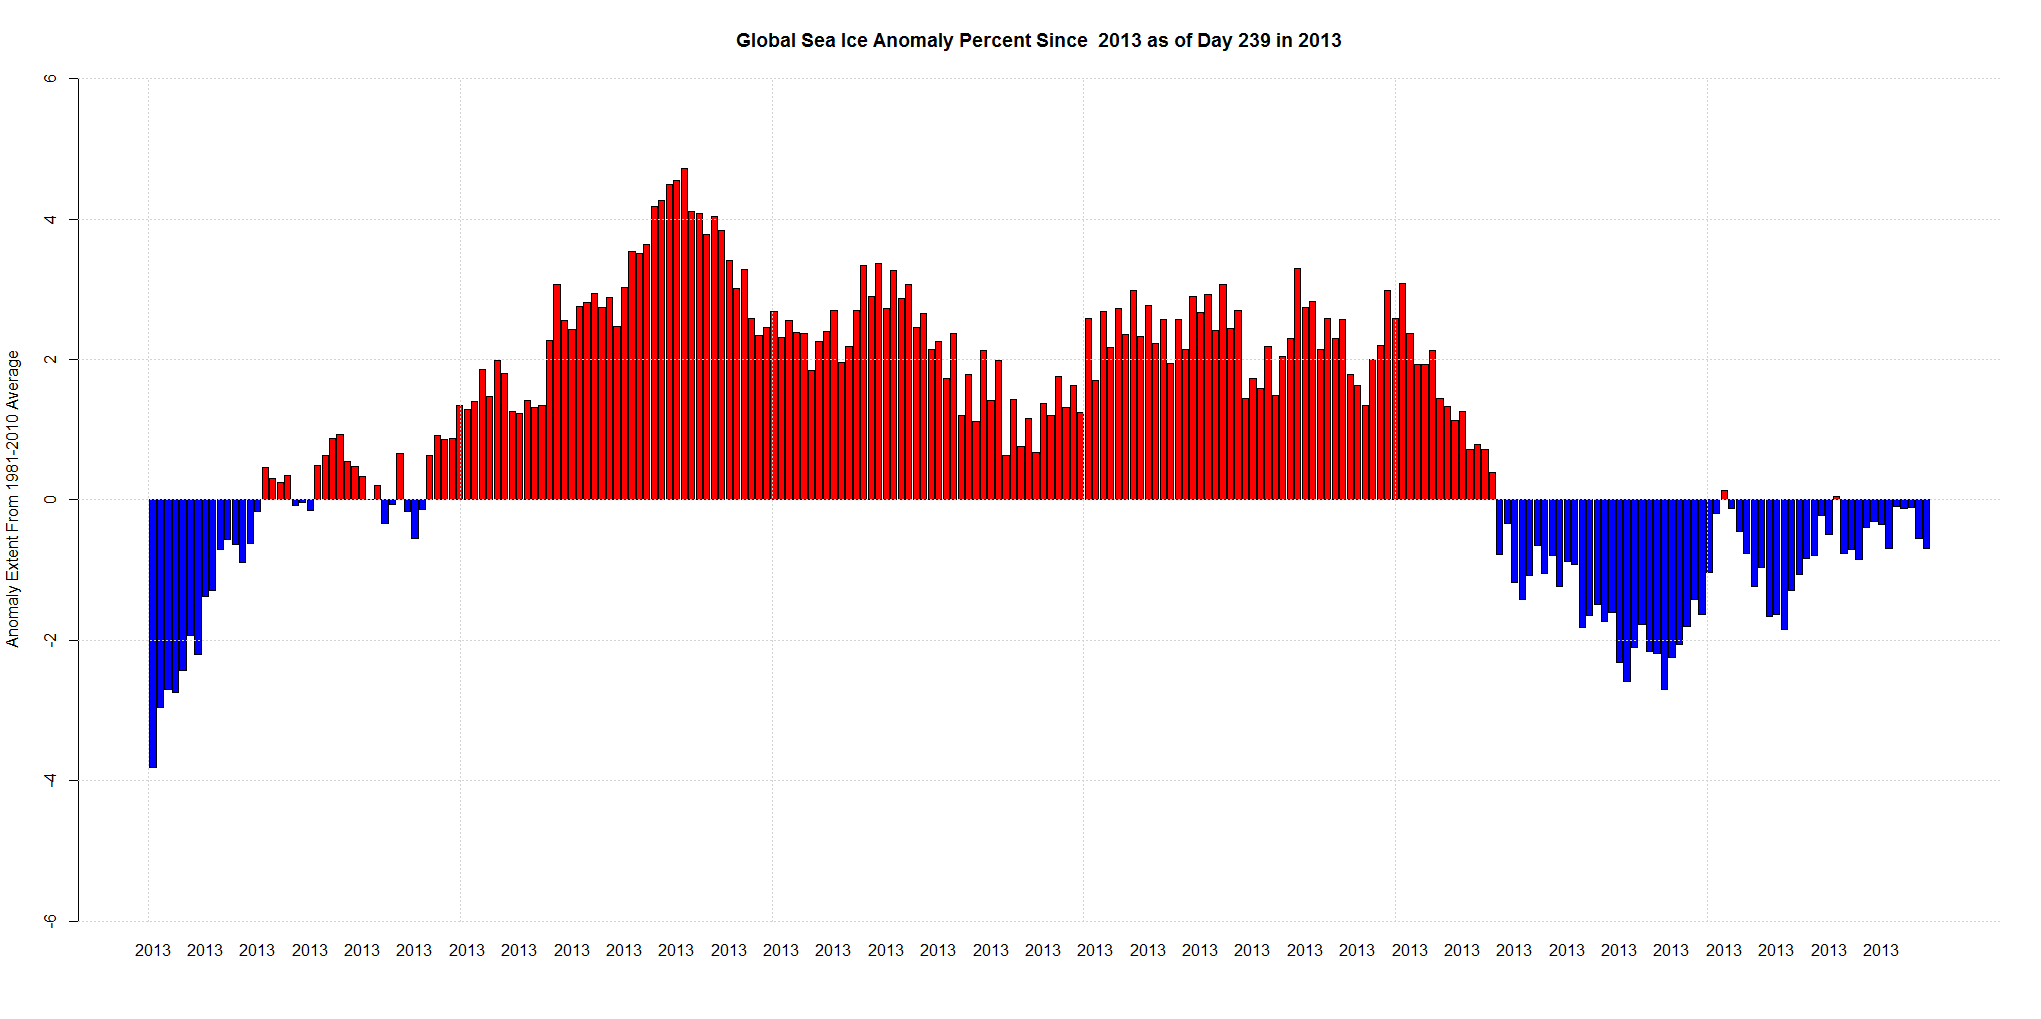
If you add up the Antarctic Sea Ice Extent Anomaly from the 30 year mean and the Arctic Anomaly and divide by the 30 year mean it comes to 170,000 sq km. Out of a normal mean of 24,700,000 sq km on Day 239.
That is a whole 0.7% below normal. The red part is above normal. The blue is below normal.
The highest anomaly for 2013 was March 14th when the anomaly was 908,000 out of a mean of 19.2 million for an anomaly percent of 4.72%.

Something you might want to post: 22 yachts caught in arctic ice trying to traverse northwest passage
http://www.sail-world.com/USA/North-West-Passage-blocked-with-ice—yachts-caught/113788
Thanks! I did!
Where to you get your daily data for global sea ice anomaly?
Antarctic:
ftp://sidads.colorado.edu/DATASETS/NOAA/G02135/south/daily/data/
Replace south with north for Arctic.
I only get the daily extent. Not the anomaly.
I calculate that myself.