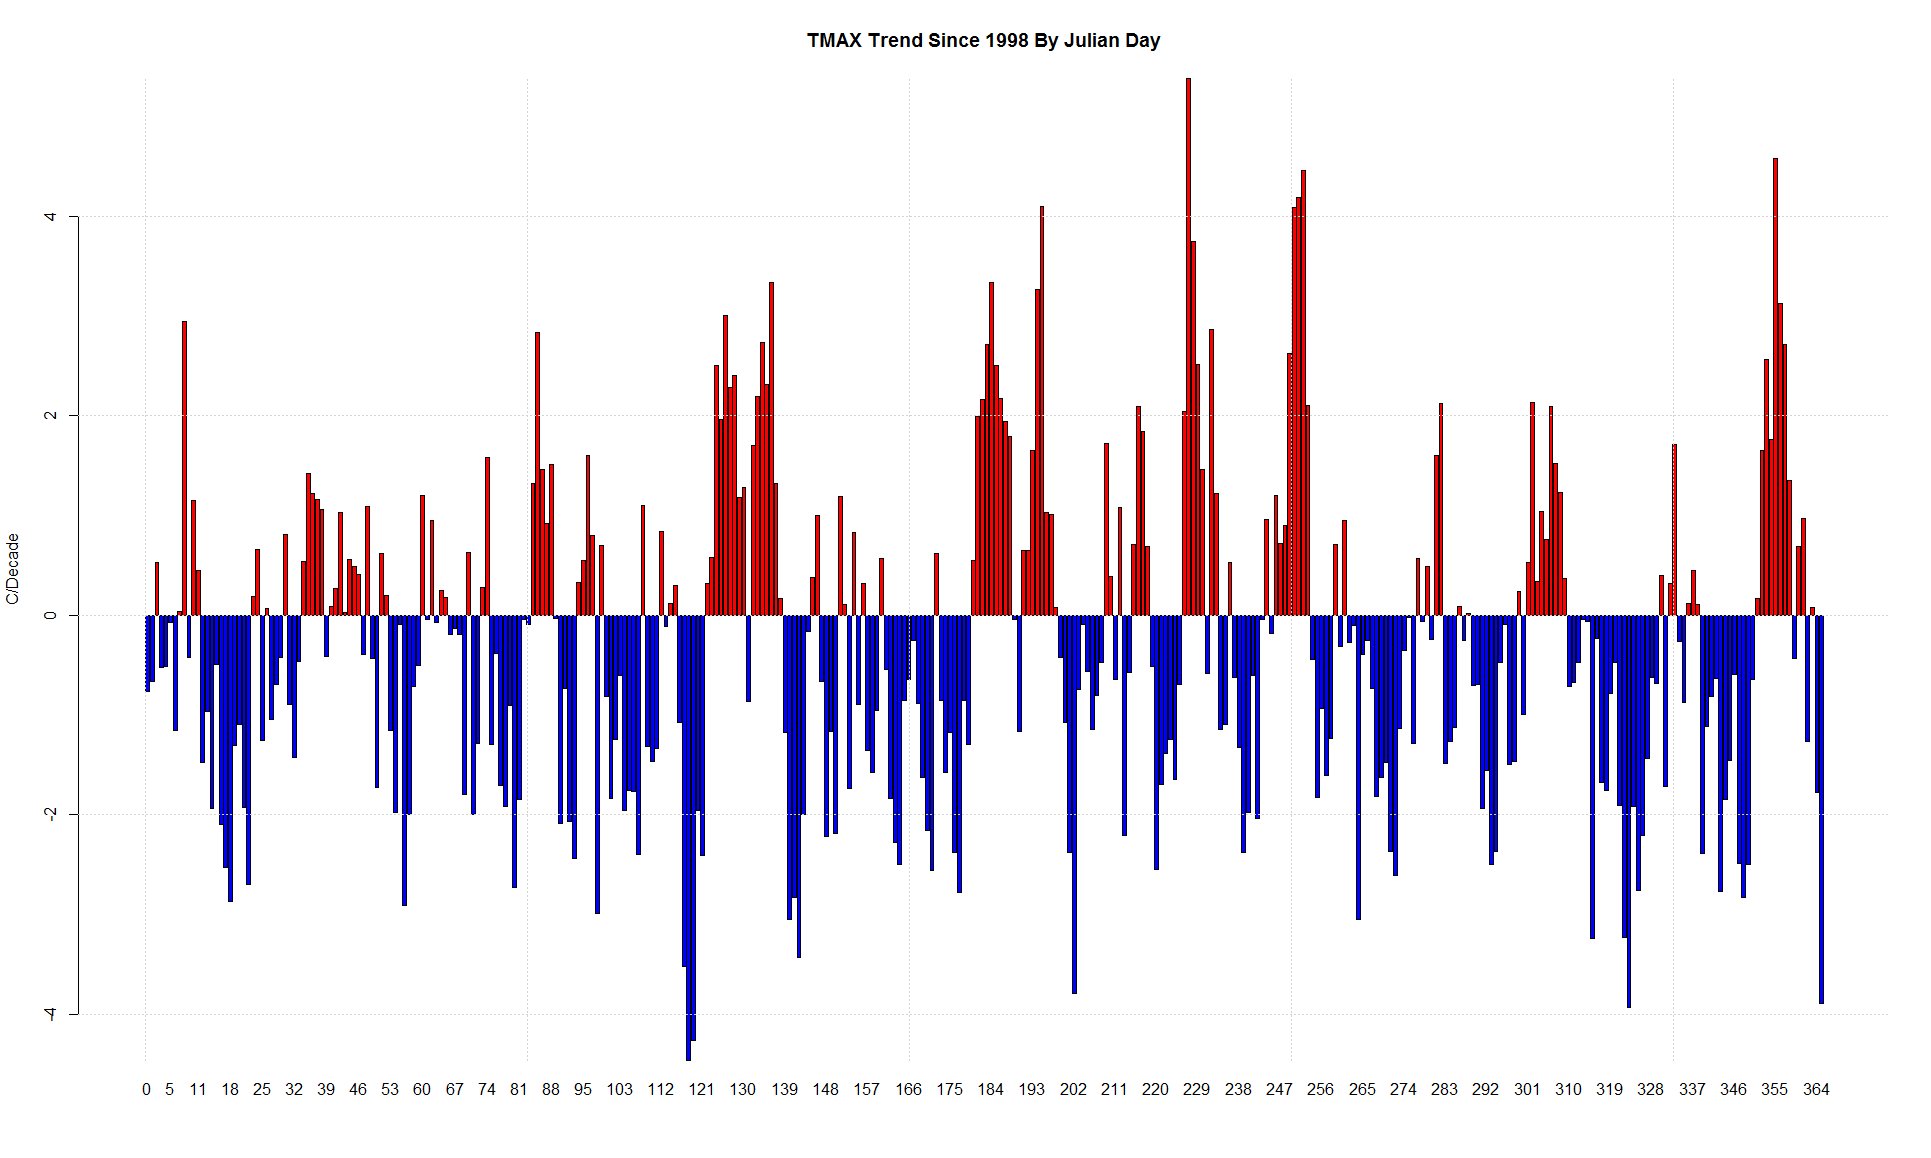
I live on the west coast. Out of idle curiosity I wondered what would happen if I took the Tmax daily data for my hometown since 1998 and graphed the Trend (in C/decade) by Julian day.
The trends go from -4.4C/decade all the way up to 5.4C/decade. The mean of all the julian day trends is -0.28C/Decade
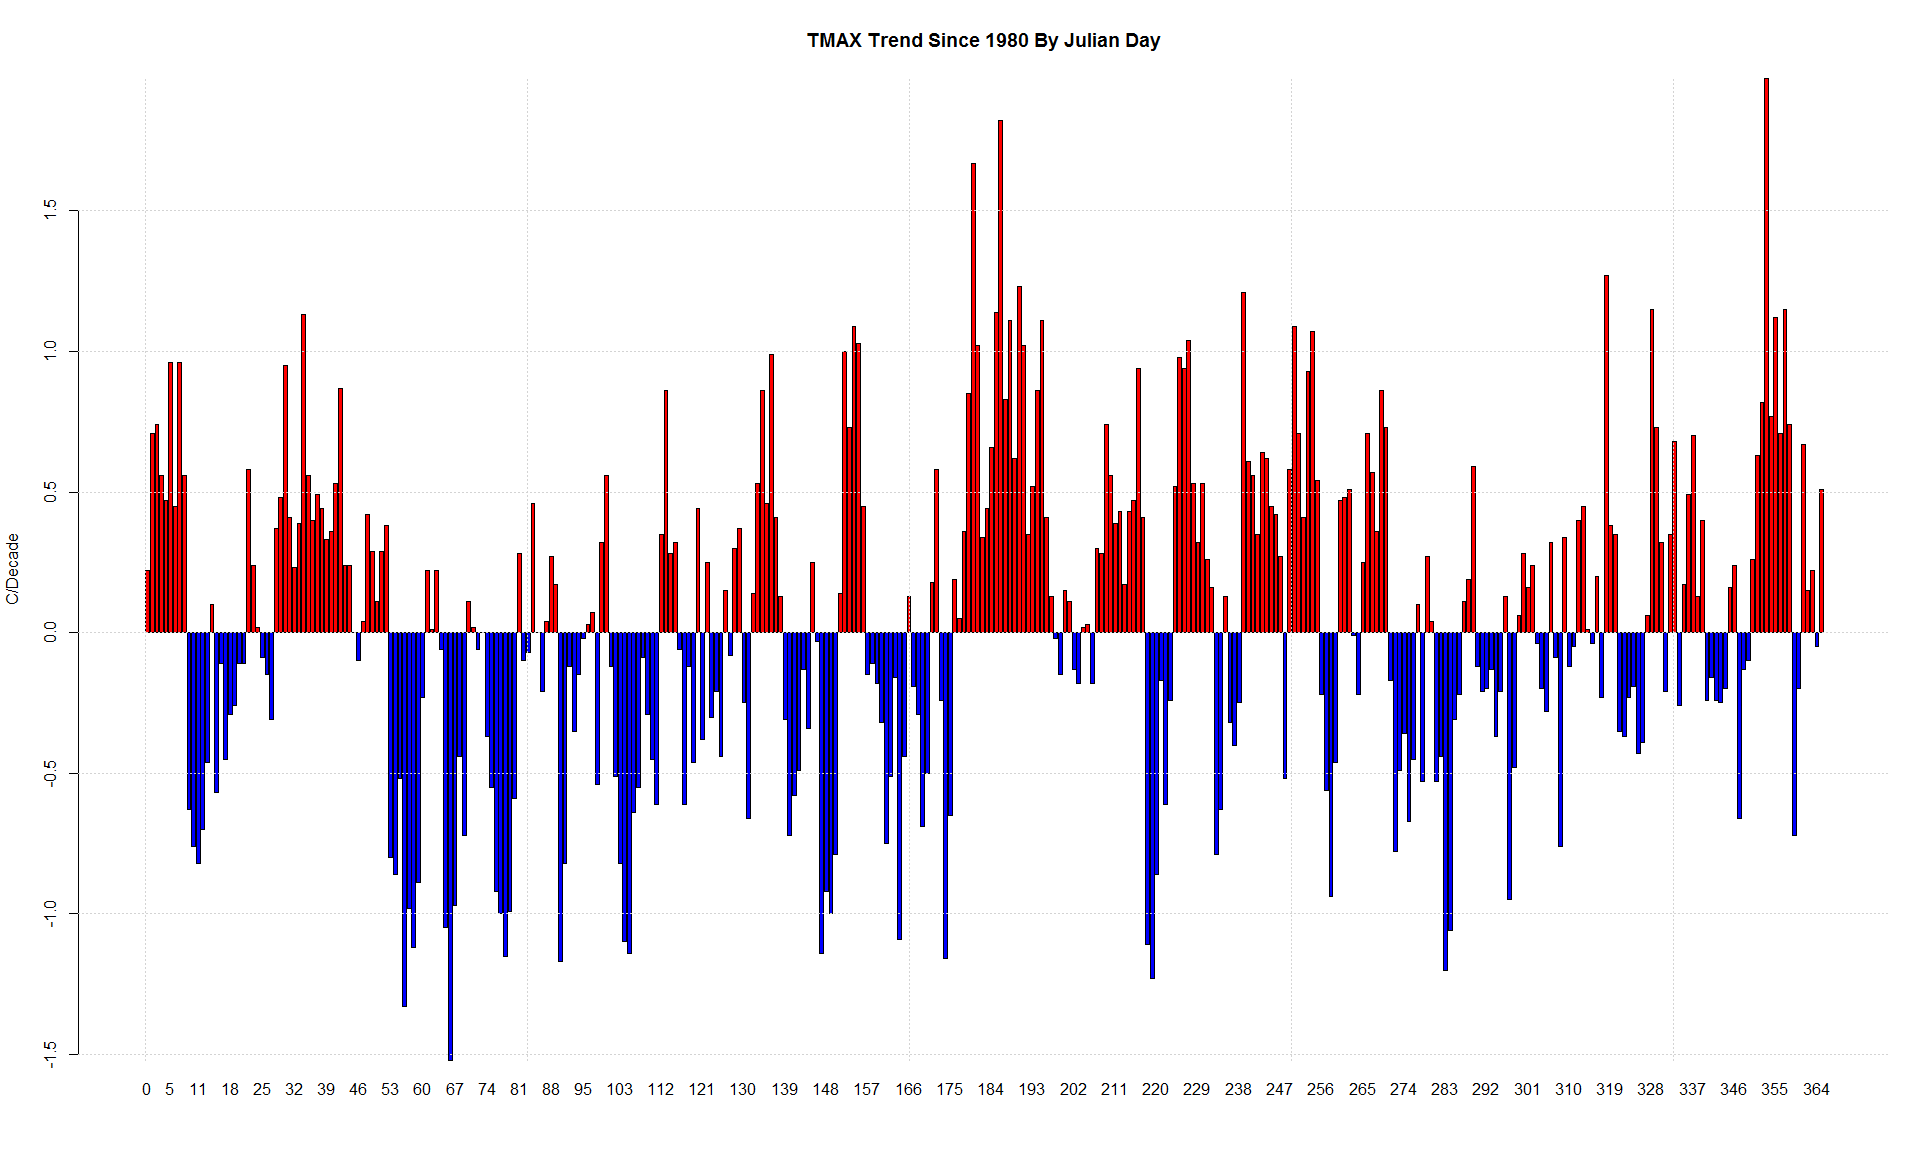
If I graph the data since 1980. The mean of all the julian day trends is +.05C/Decade

To be useful, run the same data by month/year, and plot side by side for comparison. I’ve always wondered if the binning by our calendar constraints introduces a bias not accounted for.
Ah, last comment wasn’t clear, what I was getting at was to do a longer series simply plotting days and calculate the trend for the whole set of days from 1980 to present, then compare to monthly mean and yearly mean plots of the same data, and compare trends.