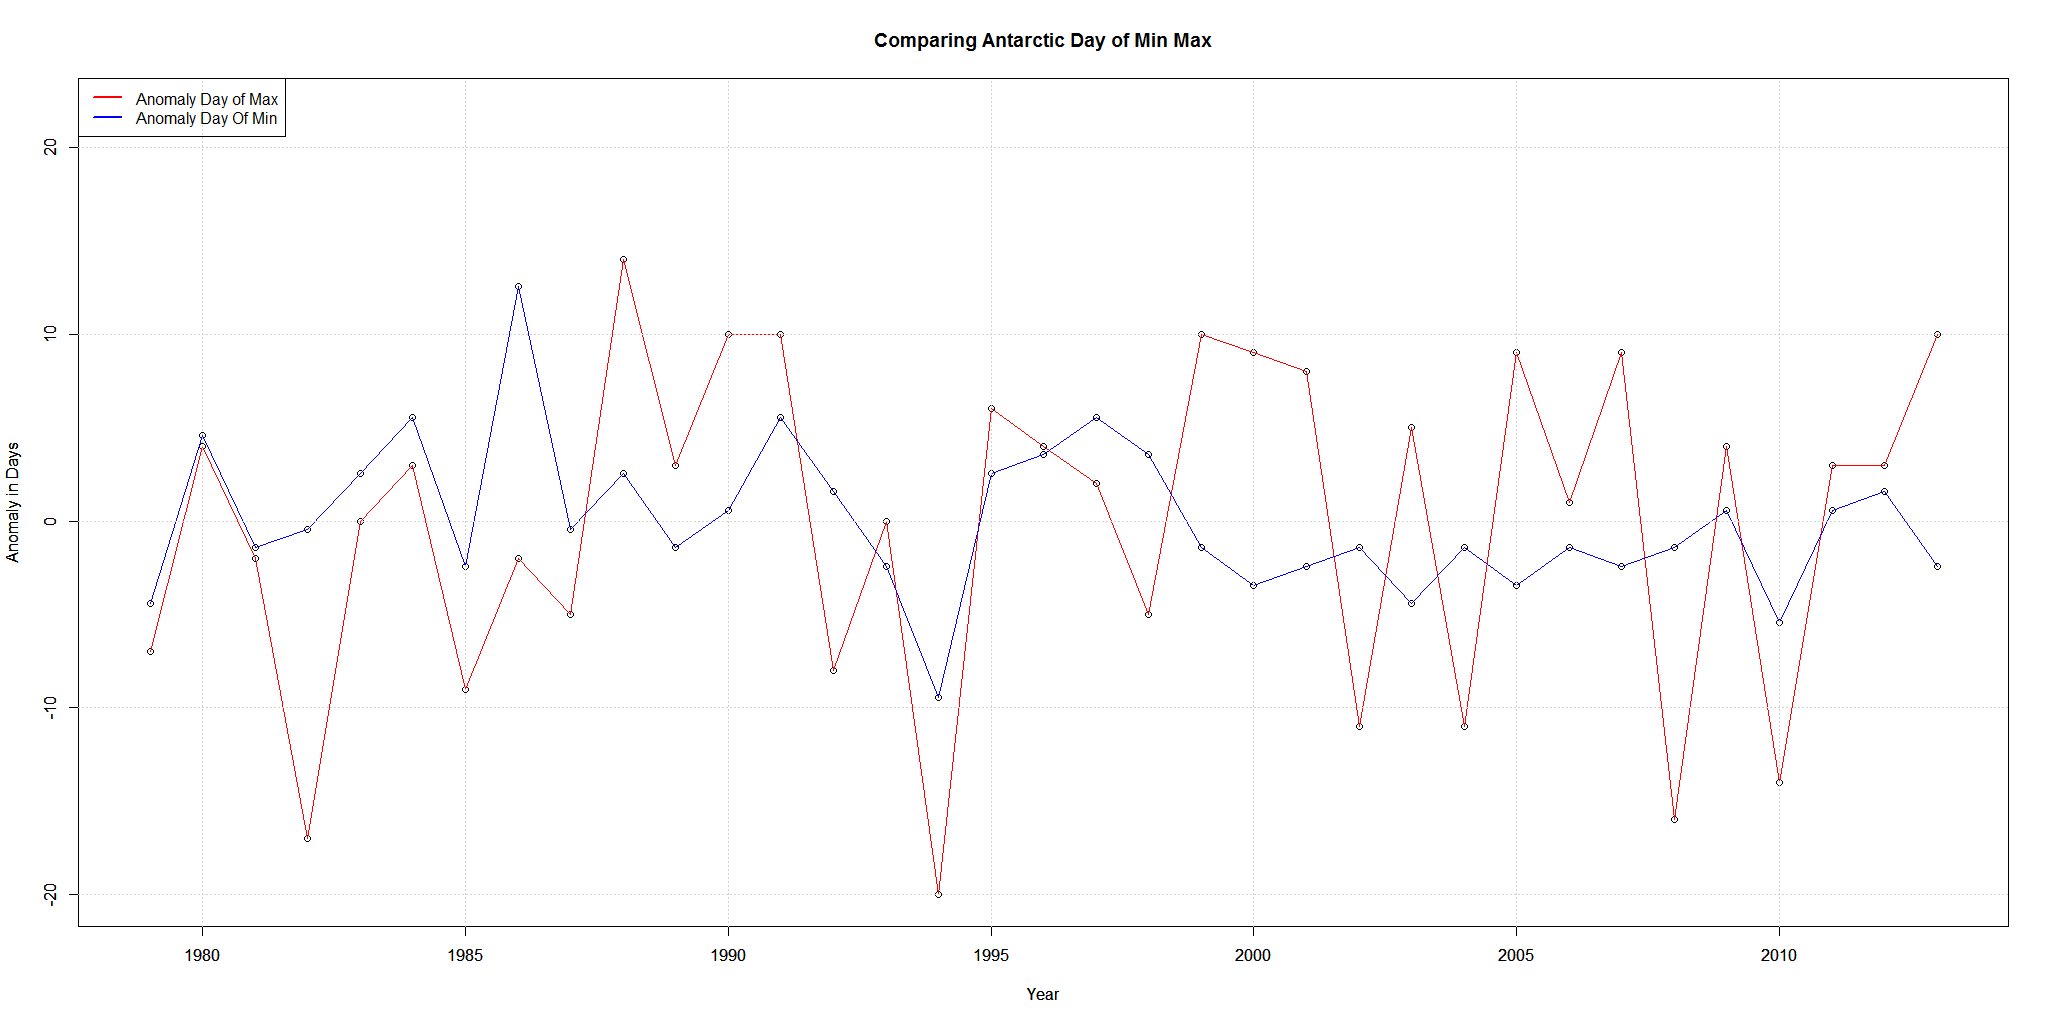
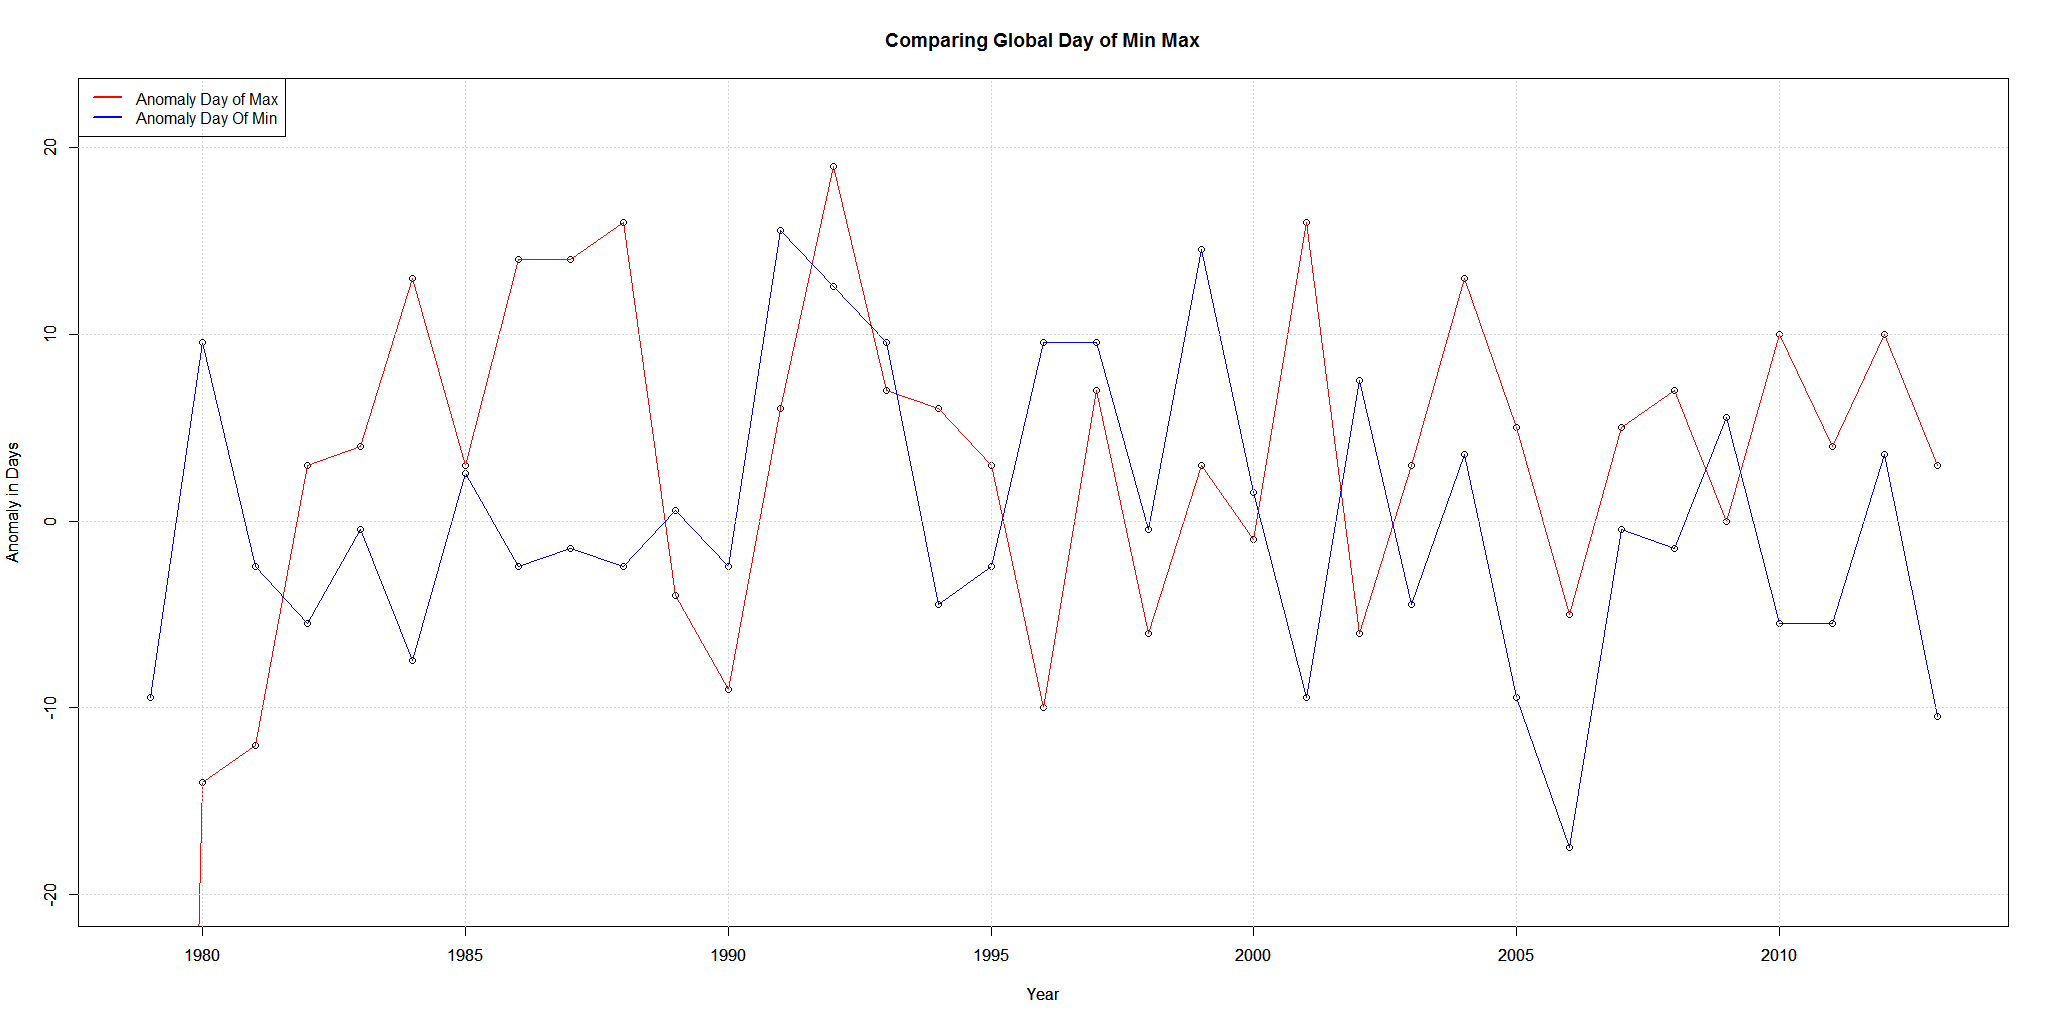
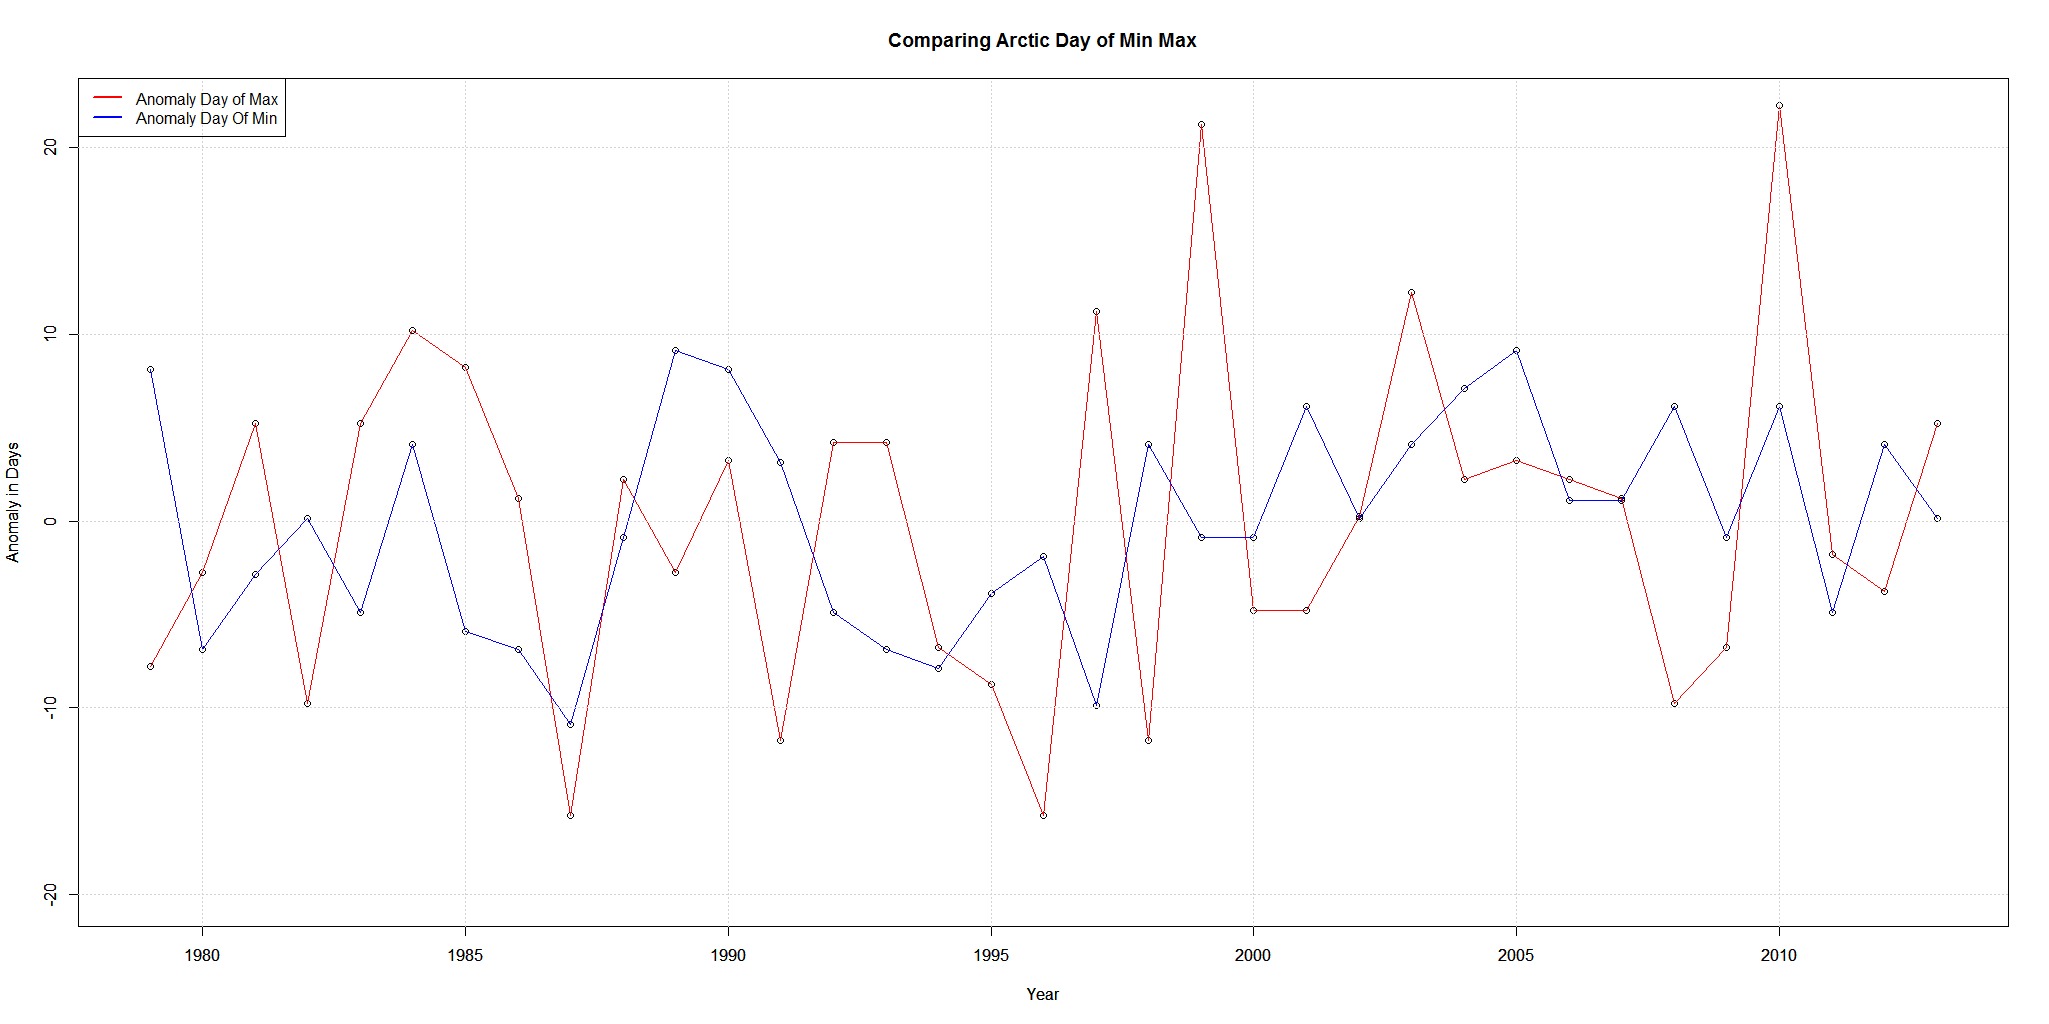
I have made 3 graphs for Antarctic/Global/Arctic Sea Ice Extent comparing the Day when the maximum ice occurred to the day the minimum ice occurred.
I am using anomalies from the 1979-2013 mean. 2014 is left out because it hasn’t finished yet.
Red is day of maximum and blue is day of minimum.
The items that stood out for me are:
Arctic 1999 and 2010 day of maximum which are 21 and 22 days above the mean. That is 10 more days later the other latest maximums.
Antarctic Day of Minimum has barely changed since 1999. Only a slight fluctuation up and down by 2 days or so.