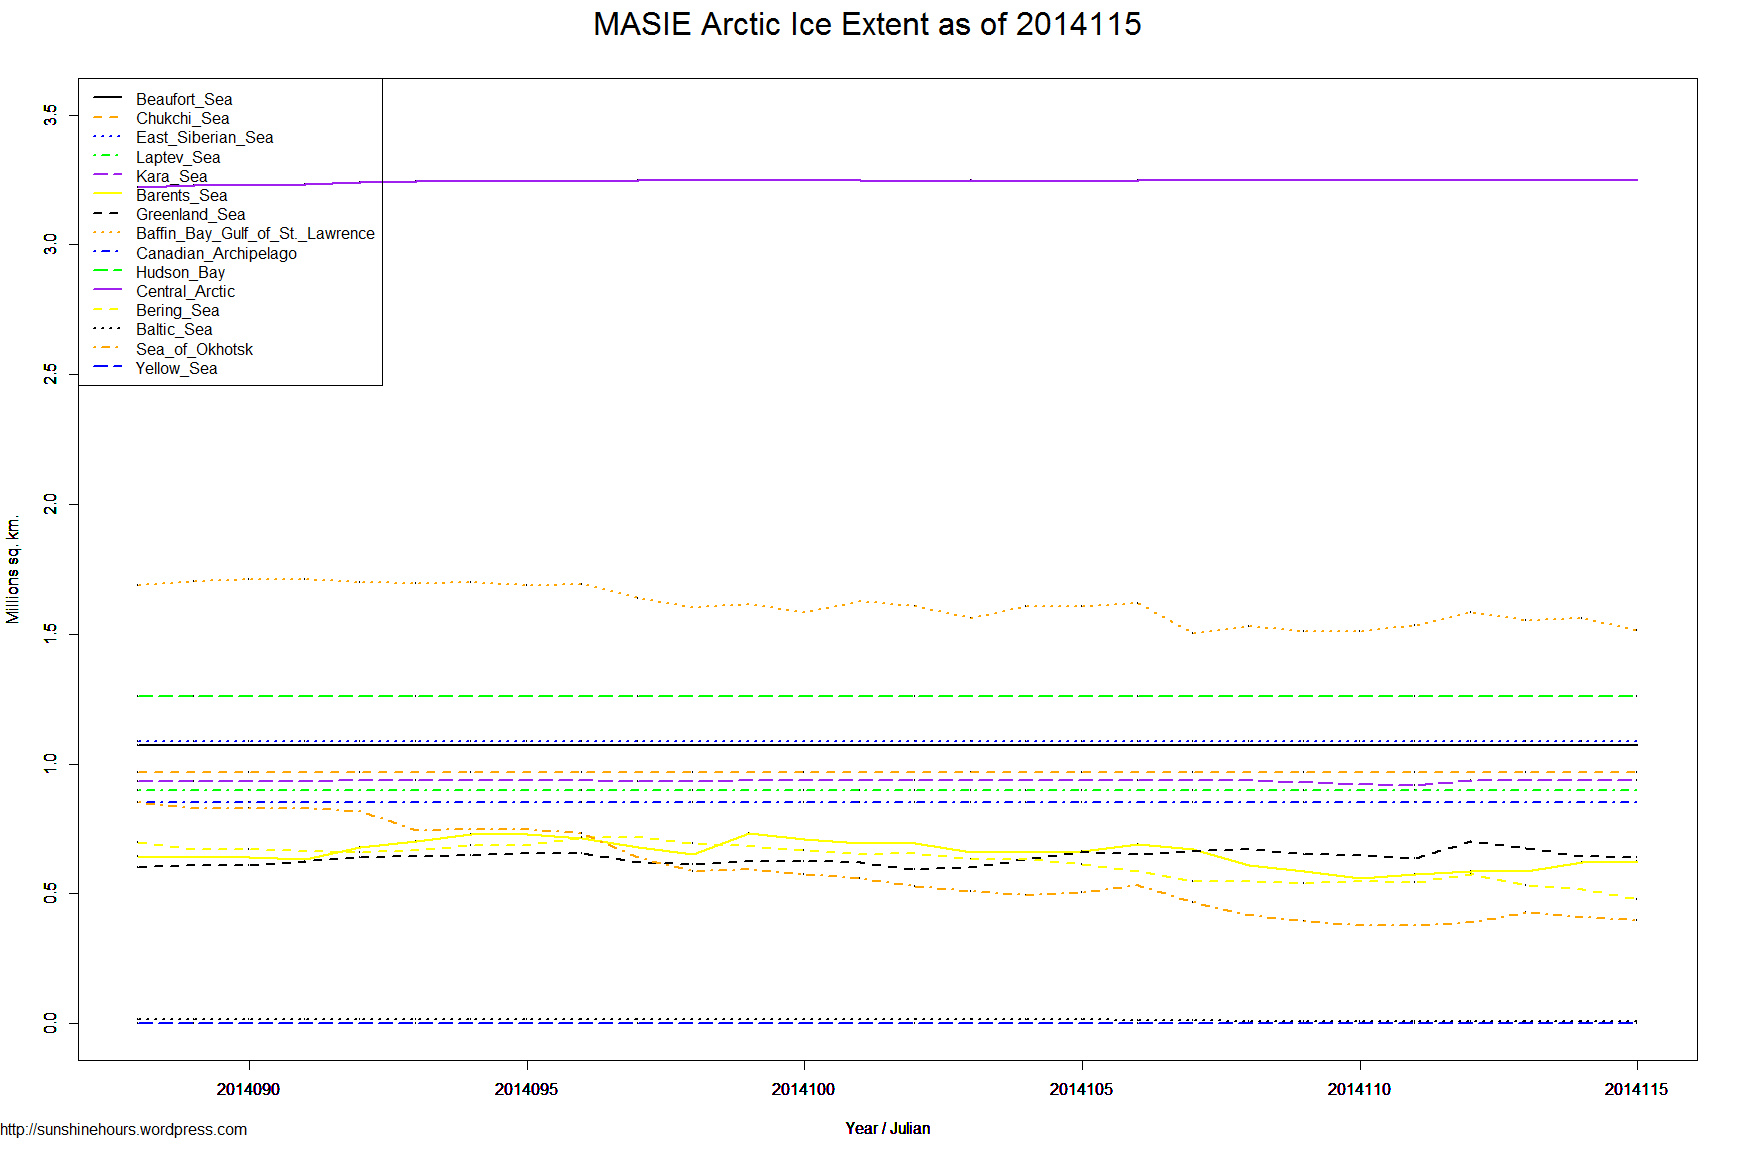
This Arctic Sea Ice dataset frm MASIE only has 28 days of data. I leave out the NH total otherwise the all of the other lines would look kind of flat.
Earlier today I posted my sea ice update and noted that ice loss in the Arctic had been almost flat for a week (compared to last year).
MASIE totals are not identical to NSIDC totals. Its the trend that is worth looking at.
This is the gain/loss from day 88 to day 115. Negative = loss. Sorted with biggest loser in last 7 days at top. Northern_Hemisphere is the grand total.
| Region | Start | End | Last 28 Days | Last 14 | Last 7 |
| Northern_Hemisphere | 14,805,115 | 13,984,885 | -820,230 | -509,465 | -121,570 |
| Bering_Sea | 697,324 | 479,375 | -217,949 | -173,774 | -68,905 |
| Greenland_Sea | 603,416 | 639,494 | 36,078 | 20,265 | -32,575 |
| Sea_of_Okhotsk | 853,240 | 398,045 | -455,195 | -162,679 | -18,897 |
| Baffin_Bay_Gulf_of_St._Lawrence | 1,688,530 | 1,515,185 | -173,346 | -112,258 | -14,610 |
| Baltic_Sea | 15,337 | 8,172 | -7,165 | -7,566 | -1,958 |
| Beaufort_Sea | 1,070,445 | 1,070,445 | 0 | 0 | 0 |
| Chukchi_Sea | 966,006 | 966,006 | 0 | 0 | 0 |
| East_Siberian_Sea | 1,087,137 | 1,087,137 | 0 | 0 | 0 |
| Laptev_Sea | 897,845 | 897,845 | 0 | 0 | 0 |
| Kara_Sea | 933,859 | 935,023 | 1,164 | 0 | 0 |
| Canadian_Archipelago | 853,214 | 853,214 | 0 | 0 | 0 |
| Hudson_Bay | 1,260,903 | 1,260,903 | 0 | 0 | 0 |
| Central_Arctic | 3,221,921 | 3,248,013 | 26,092 | 452 | 0 |
| Yellow_Sea | 0 | 0 | 0 | 0 | 0 |
| Barents_Sea | 645,917 | 623,822 | -22,096 | -71,839 | 15,375 |
The flat lines at the bottom are regions that have melted and are now ice free. The completely flat lines elsewhere indicate no melting at all yet. The changing lines indicate melting regions.
The purple line near the top is the “Central Arctic “. You can barely notice it rose from 3221921 on day 88 to 3248013 on day 115.
(I wish I had historical MASIE data) Click for bigger.

When I saw earlier this year that MASIE deletes data older than the current 28 day period, I began building a spreadsheet to retain the older numbers. It is interesting to see how the melt progresses in the different NH sectors, by comparing the losses against the maximums in each.
For NH overall, the ice extent was 15.52 MKm2 on day 73 (March 14, 2014). On April 25, the amount was 13.98, a loss of 1.53, almost 10%.
Barents Sea lost 0.12, Baffin Bay Gulf of St.Lawrence 0.46, Bering Sea 0.42 and Sea of Okhotsk 0.76 from their individual maximums, comprising most of the melting.
Meanwhile the Central Arctic is still at its maximum and Greenland Sea has lost only 0.06.
I should have automated the data download. I may cobble something together in the next week.