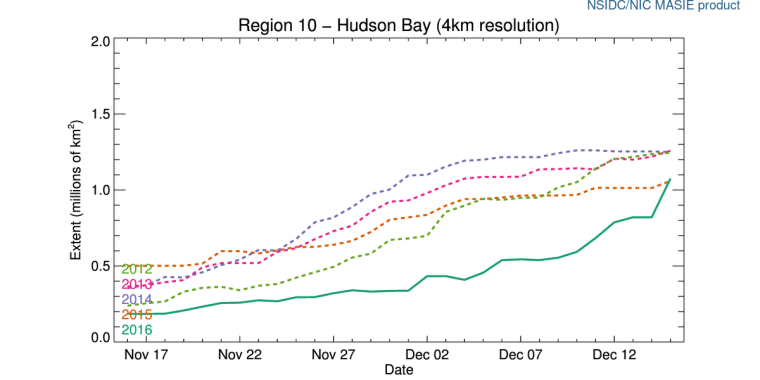
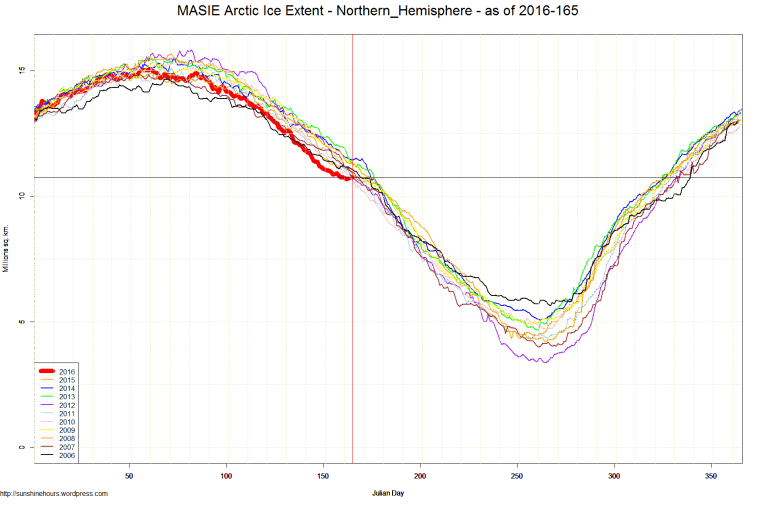
MASIE shows Hudson Bay sea ice rapidly catching up to previous years.
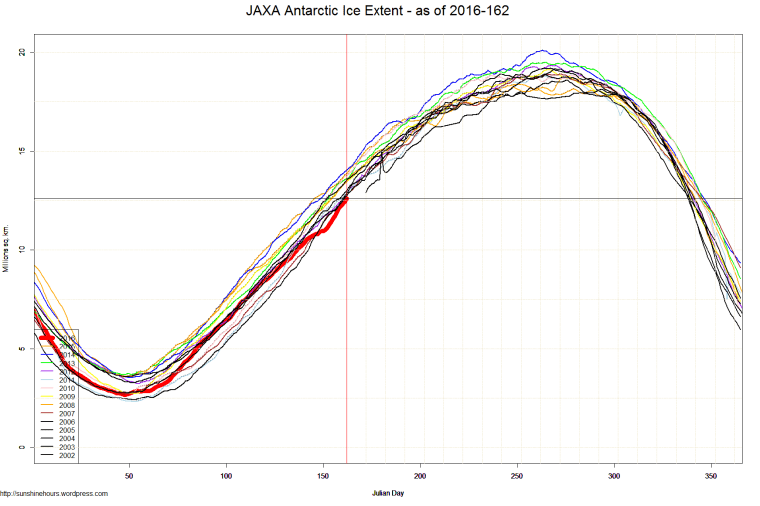
NSIDC has not updated its sea ice data for 3 days. So here is JAXA.
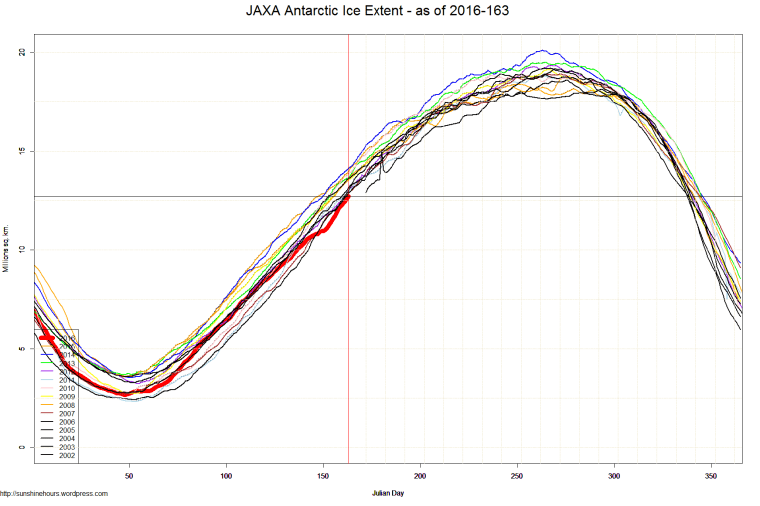
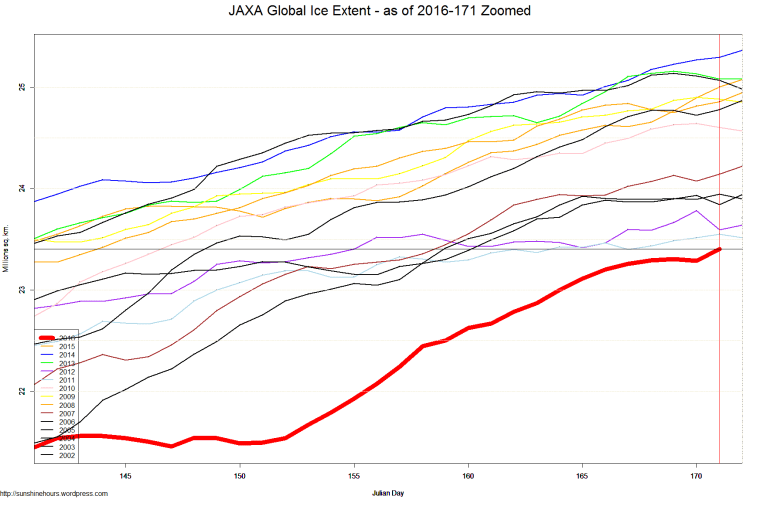
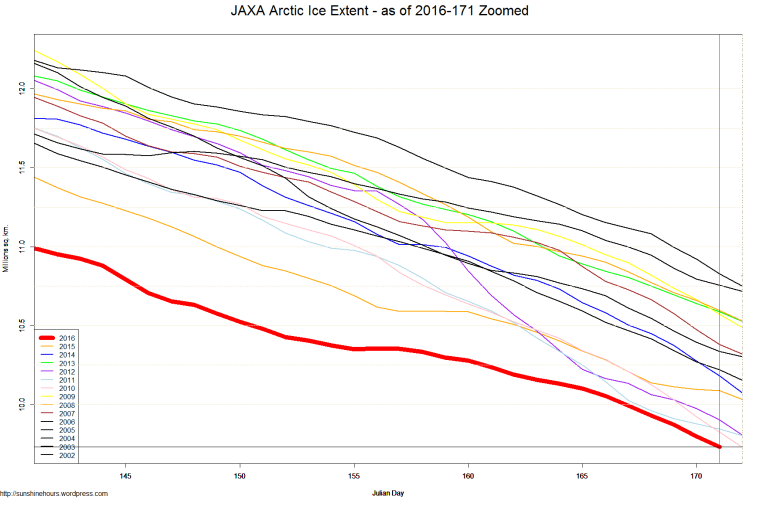
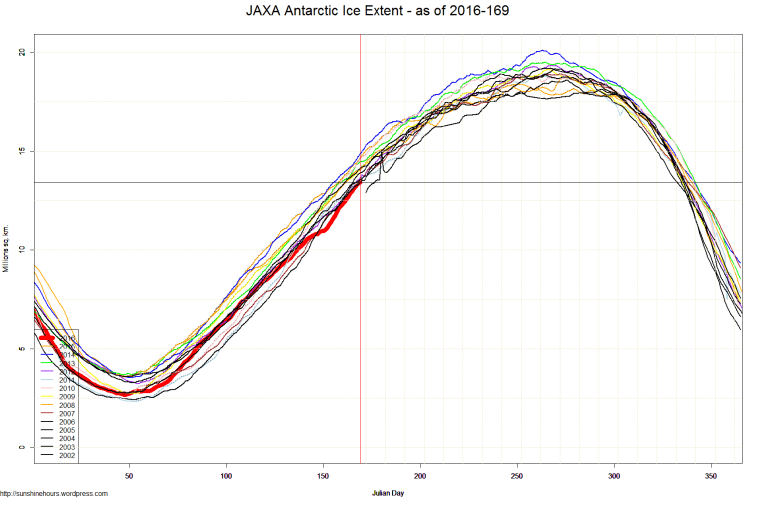
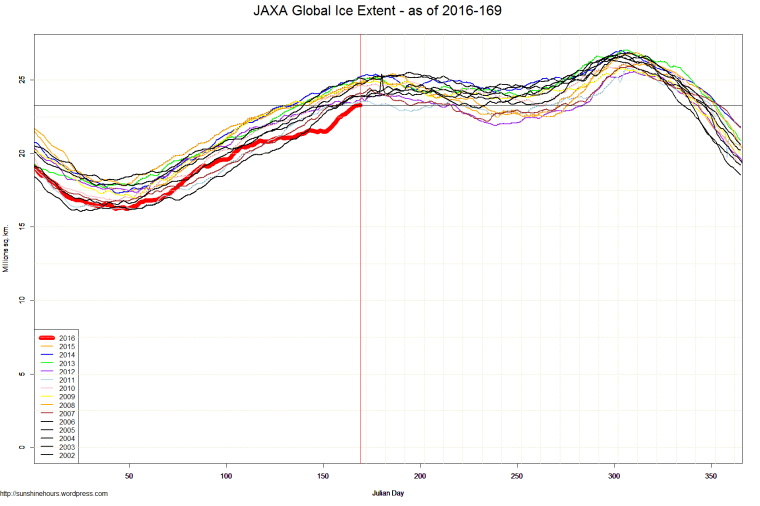
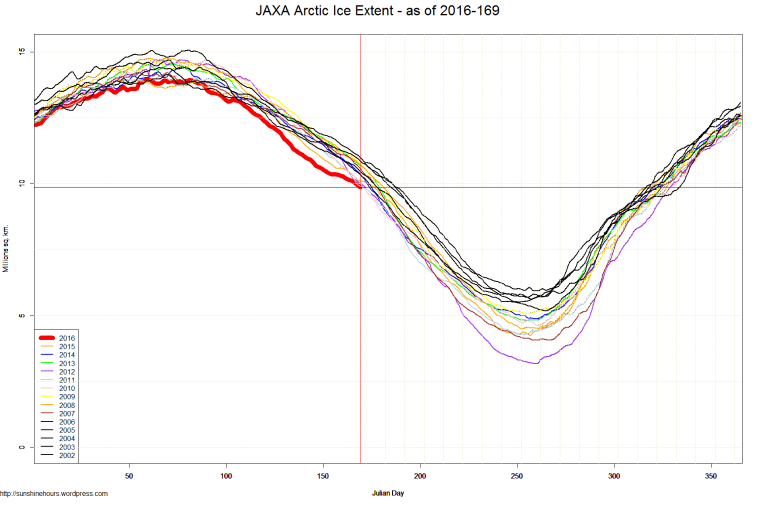
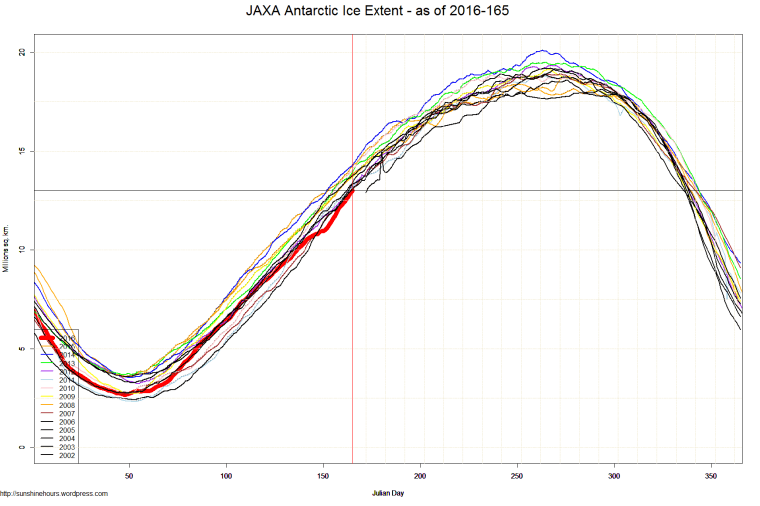
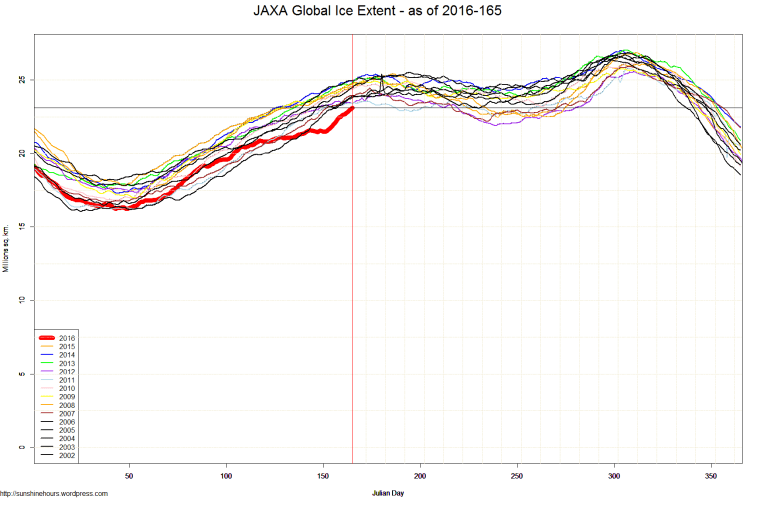
JAXA sea ice extent data from Japanese Aerospace Exploration Agency.
NSIDC has not updated its sea ice data for 2 days. So here is JAXA.
JAXA sea ice extent data from Japanese Aerospace Exploration Agency.
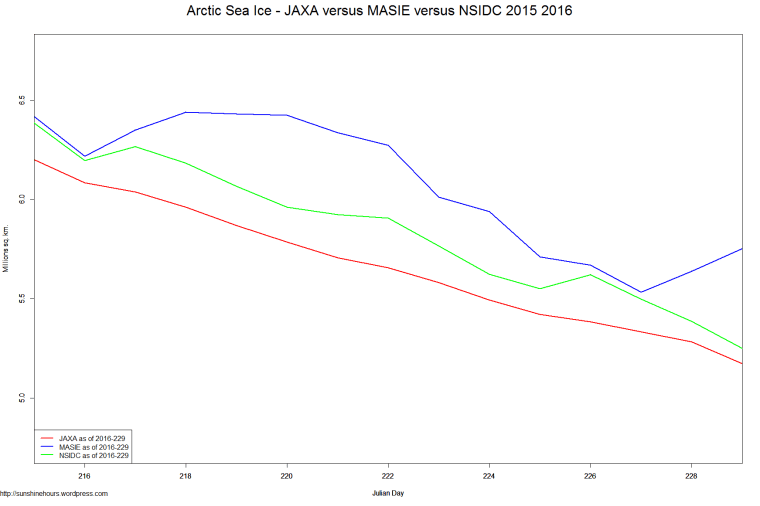
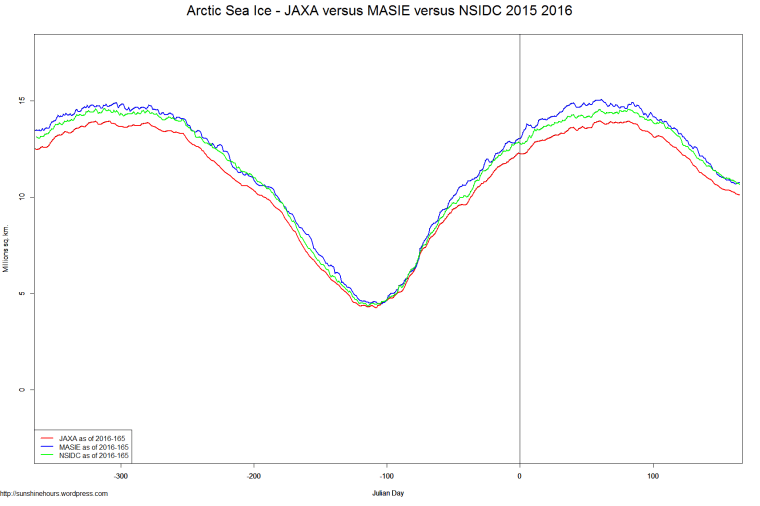
Now that NSIDC is publishing data again I thought I would post two graphs comparing JAXA MASIE and NSIDC.
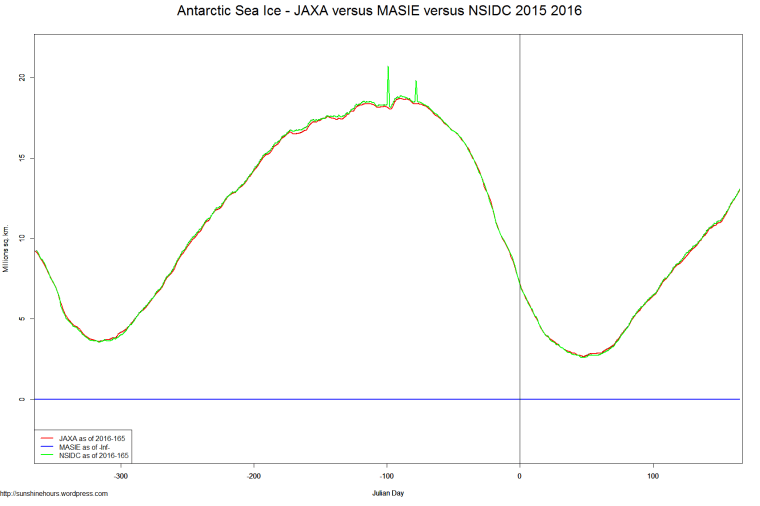
I’m doing it for Arctic and Antarctic (but MASIE has no Antarctic data)
Normally in the Arctic JAXA and NSIDC are very close only at the minimum … but now they are very close.
And in the Antarctic they might as well be doing just one they overlap so much.
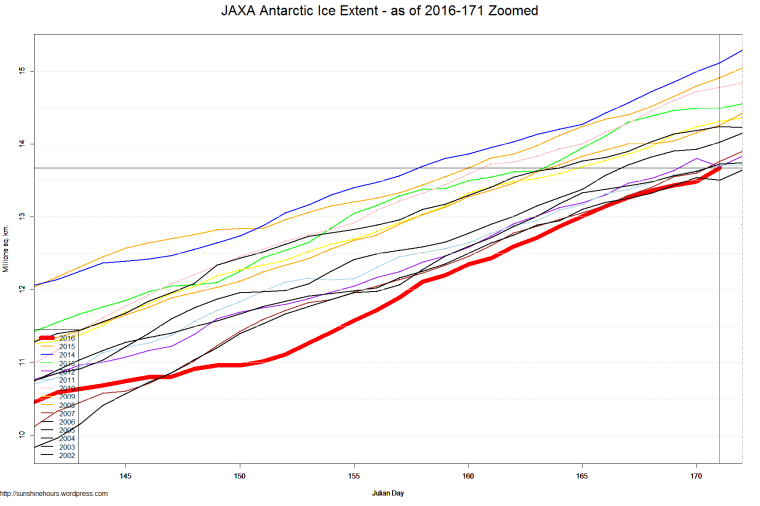
A couple of days ago I pointed out one of the other ice indexes (DMI) had now crossed over the 2012 track.
MASIE (see bottom graph) has actually gained ice the last couple of days and is above 2010,2011 and 2012.
JAXA is still 100,000 sq km below 2012.
JAXA sea ice extent data from Japanese Aerospace Exploration Agency.

MASIE (Arctic only)
A couple of days ago I pointed out one of the other ice indexes (DMI) had now crossed over the 2012 track.
MASIE (see bottom) is now very close (4300 sq km — but it was 2011 not 2012). JAXA is still 300,000 sq km below 2012.
JAXA sea ice extent data from Japanese Aerospace Exploration Agency.


MASIE (Arctic only)