May 15 2014 MASIE Update
This is the gain/loss up to day 131. Negative = loss. Sorted with biggest loser in last 7 days at top. Northern Hemisphere is the grand total.
A 71,559 sq km increase from day 133 to 134. Almost all the regions had some increase or flattening except for the Sea of Okhotsk.
| Region | Start | End | Last 46 Days | Last 28 | Last 14 | Last 7 | Last 3 | Last 1 |
| Barents Sea | 645,917 | 544,139 | -101,778 | -146,436 | -124,548 | -139,140 | -34,559 | 6,021 |
| Baffin Bay Gulf of St. Lawrence | 1,688,530 | 1,158,003 | -530,527 | -460,820 | -203,730 | -122,201 | -64,200 | 14,531 |
| Bering Sea | 697,324 | 223,502 | -473,821 | -361,304 | -212,024 | -120,356 | -71,689 | 16,065 |
| Sea of Okhotsk | 853,240 | 102,095 | -751,145 | -430,119 | -206,663 | -100,859 | -32,112 | -6,286 |
| Hudson Bay | 1,260,903 | 1,213,477 | -47,426 | -47,426 | -37,835 | -38,325 | -614 | 22,303 |
| Chukchi Sea | 966,006 | 928,313 | -37,693 | -37,693 | -25,831 | -24,215 | -20,492 | 513 |
| Canadian Archipelago | 853,214 | 834,183 | -19,031 | -19,031 | -19,031 | -17,769 | -1,864 | -96 |
| Kara Sea | 933,859 | 928,578 | -5,282 | -6,446 | -6,446 | -6,255 | 2,163 | 3,886 |
| Baltic Sea | 15,337 | 2,673 | -12,664 | -8,595 | -5,834 | -5,729 | -954 | -34 |
| Laptev Sea | 897,845 | 893,342 | -4,503 | -4,503 | -4,503 | -4,503 | 683 | 683 |
| Beaufort Sea | 1,070,445 | 1,048,548 | -21,897 | -21,897 | -21,897 | -4,467 | -6,795 | 2,164 |
| Central Arctic | 3,221,921 | 3,247,742 | 25,821 | -271 | -271 | -271 | 0 | 0 |
| East Siberian Sea | 1,087,137 | 1,087,137 | 0 | 0 | 0 | 0 | 0 | 0 |
| Yellow Sea | 0 | 0 | 0 | 0 | 0 | 0 | 0 | 0 |
| Greenland Sea | 603,416 | 629,681 | 26,265 | -23,916 | -28,065 | 9,649 | 28,749 | 11,808 |
| Northern Hemisphere (Total) | 14,805,115 | 12,842,910 | -1,962,204 | -1,571,232 | -897,388 | -575,135 | -201,765 | 71,559 |
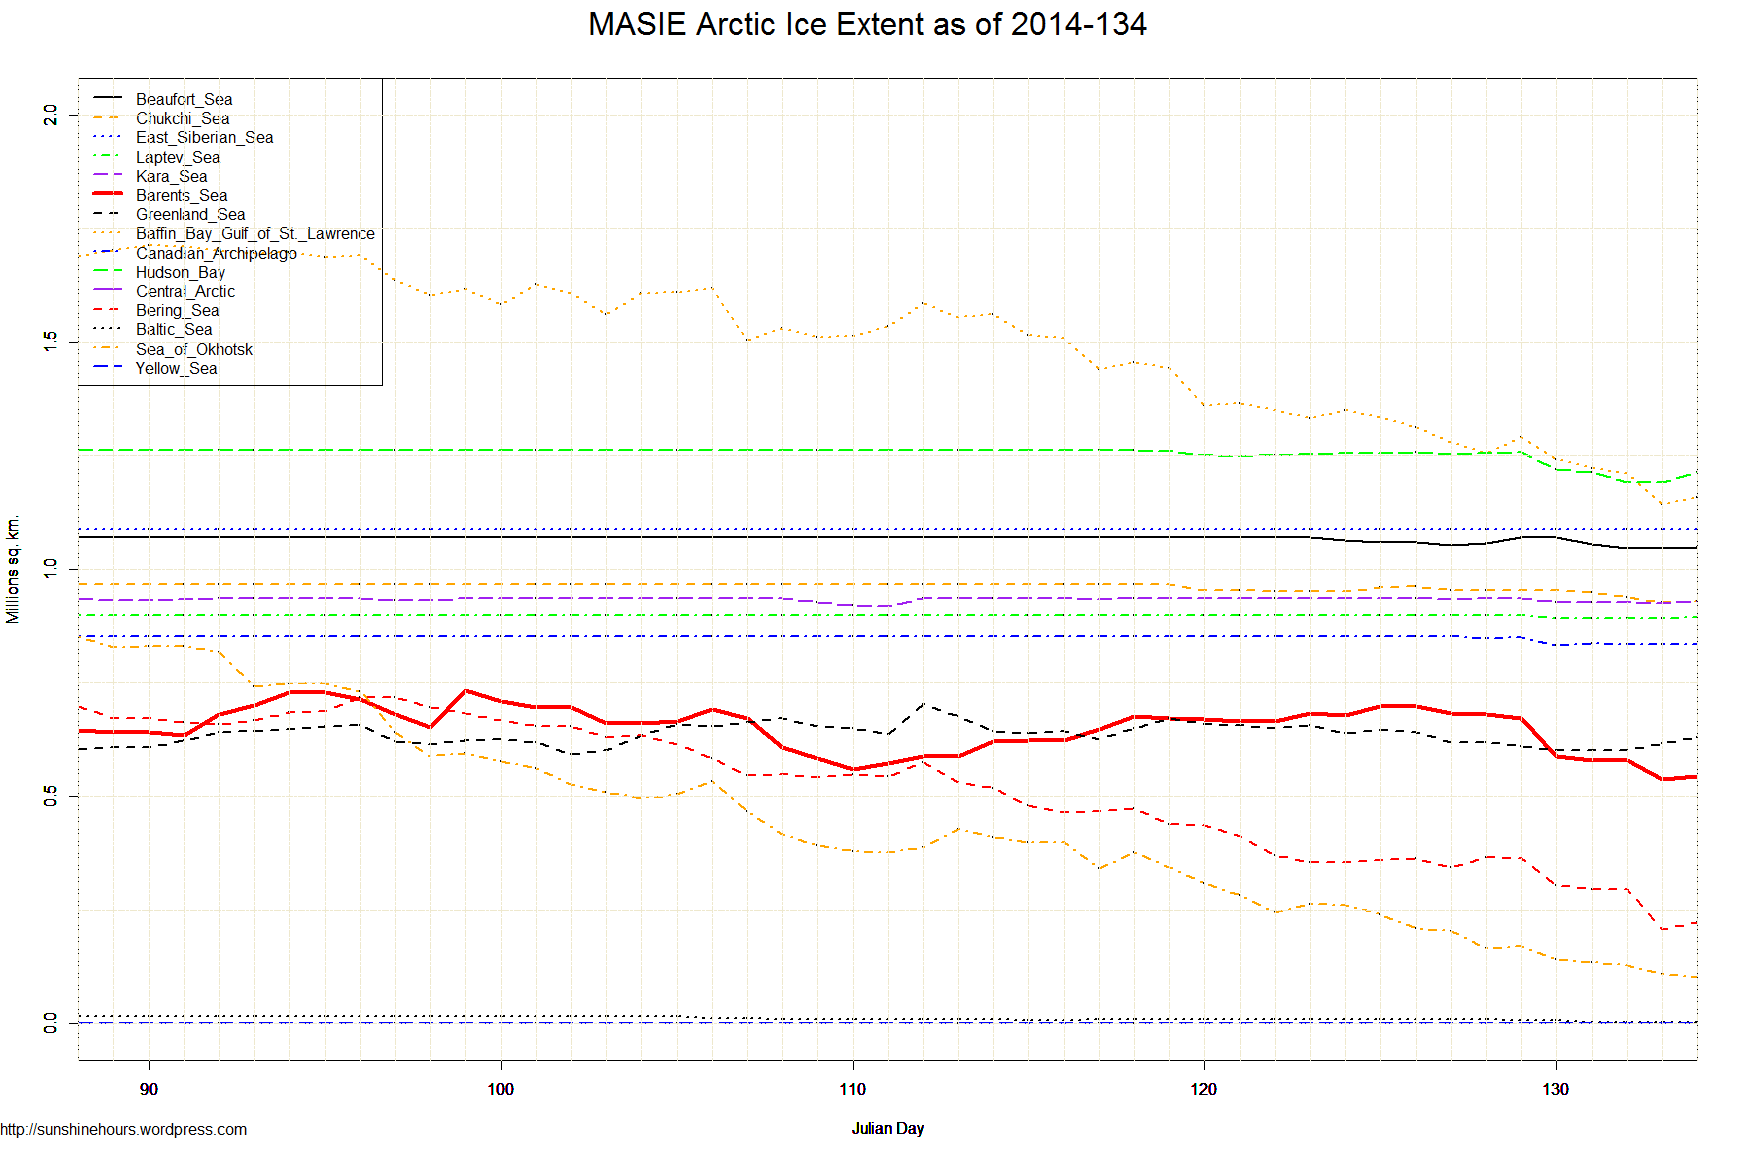

May 14 (day 135) and NH sea ice extent is down to 12.86 MKm2, a loss of 17% from the maximum (day 73).
Sea of Okhotsk has lost 91% from max, Bering sea 73%, Baffin Bay 41%, Barents Sea 29%, Greenland Sea 10%.
Central Arctic still at max and Canadian Archipelago lost only 2%.
Here is a bit more on the pattern of freezing and melting in the regions of Northern Hemisphere. Since MASIE does not provide year over year statistics, there is no way to compare 2014 with other years.
Region Max MKm2 Last Date Reported
(0) Northern_Hemisphere 15.52 2014073
(1) Beaufort_Sea 1.07 2014130
(2) Chukchi_Sea 0.97 2014119
(3) East_Siberian_Sea 1.09 2014135
(4) Laptev_Sea 0.90 2014129
(5) Kara_Sea 0.94 2014129
(6) Barents_Sea 0.74 2014086
(7) Greenland_Sea -0.70 2014112
(8) Baffin_Bay_Gulf_of_St._Lawrence 1.98 2014073
(9) Canadian_Archipelago 0.85 2014126
(10) Hudson_Bay 1.26 2014118
(11) Central_Arctic 3.25 2014130
(12) Bering_Sea 0.90 2014073
(13) Baltic_Sea 0.10 2014043
(14) Sea_of_Okhotsk 1.16 2014065
(15) Yellow_Sea 0.03 2014045
(16) Cook_Inlet 0.01 2014045