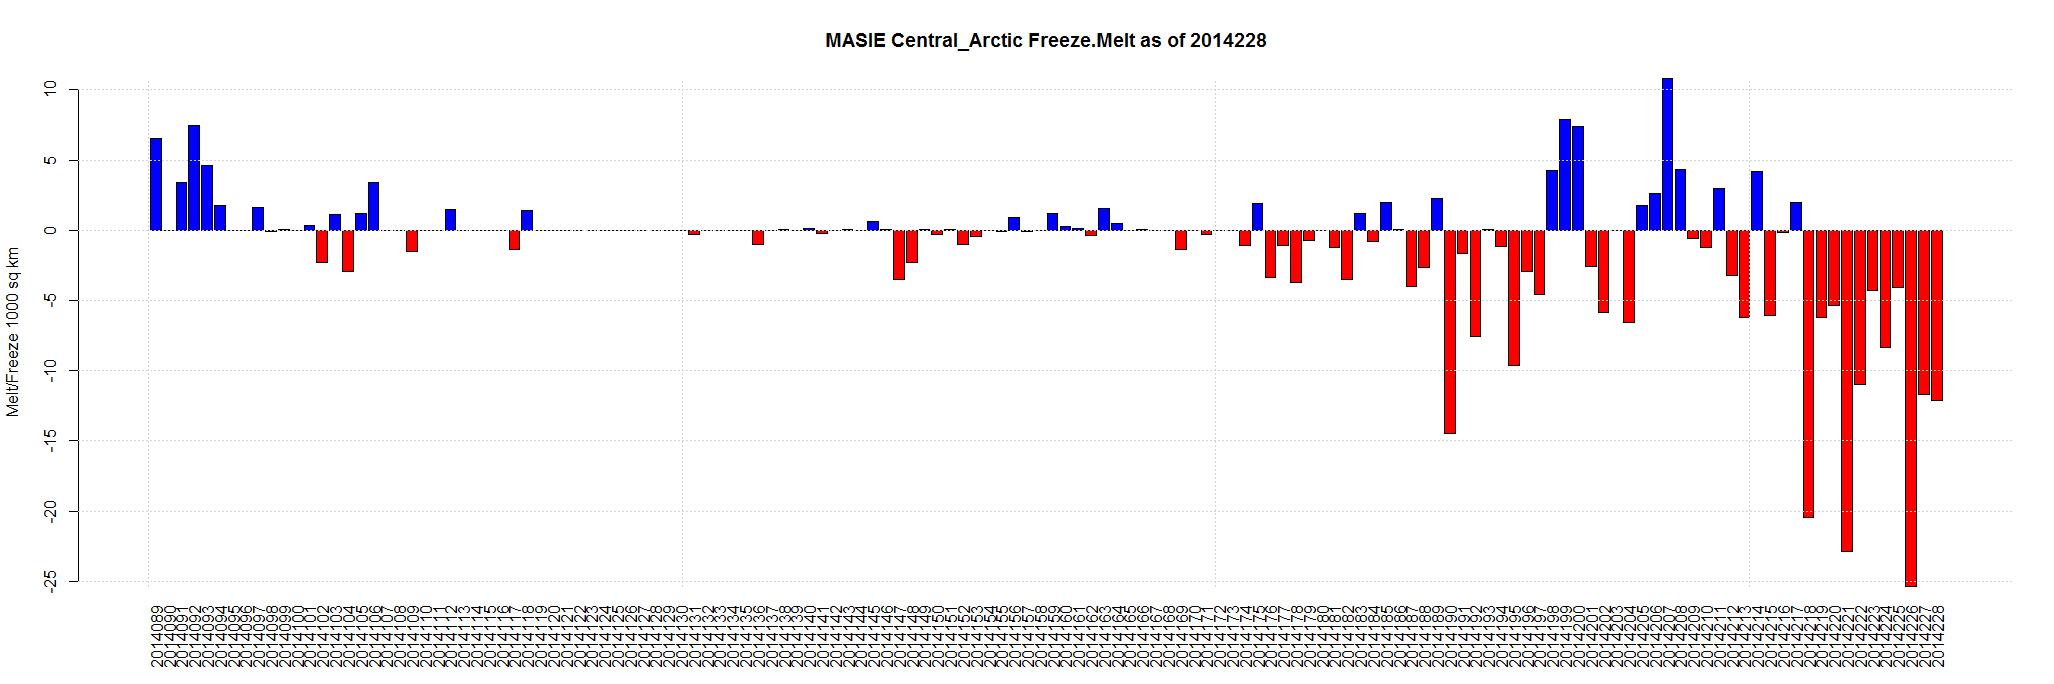
Aug 17 2014 MASIE Update – Steady Melting … Central Arctic is melting … But it has slowed from 25,000 sq km a day to 12,000 sq km over last two days
Barents Sea Has Been Gaining Ice For 4 Weeks
Data here. Click for bigger.

| Region | 141 days ago | End | Last 140 | Last 28 | Last 14 | Last 7 | Last 3 | Last 1 |
| East Siberian Sea | 1,087,137 | 628,671 | -458,466 | -384,338 | -266,834 | -162,919 | -67,657 | -22,414 |
| Chukchi Sea | 966,006 | 474,901 | -491,105 | -173,659 | -120,625 | -50,114 | -30,520 | -14,865 |
| Kara Sea | 933,859 | 187,131 | -746,729 | -340,810 | -128,957 | -37,596 | -19,812 | -14,531 |
| Greenland Sea | 603,416 | 266,843 | -336,573 | -152,927 | -85,187 | -29,463 | -13,195 | -14,002 |
| Central Arctic | 3,221,921 | 3,068,880 | -153,041 | -135,772 | -136,108 | -76,857 | -49,178 | -12,159 |
| Canadian Archipelago | 853,214 | 527,779 | -325,436 | -182,407 | -150,443 | -77,063 | -25,564 | -11,079 |
| Beaufort Sea | 1,070,445 | 763,810 | -306,635 | -72,831 | -89,839 | -40,159 | -25,655 | -8,176 |
| Laptev Sea | 897,845 | 48,385 | -849,459 | -342,570 | -164,653 | -103,114 | -30,296 | -3,710 |
| Baffin Bay Gulf of St. Lawrence | 1,688,530 | 12,597 | -1,675,933 | -133,960 | -59,951 | -33,765 | -8,108 | -1,350 |
| Hudson Bay | 1,260,903 | 87,721 | -1,173,183 | -209,363 | -67,147 | -40,296 | -5,414 | -1,144 |
| Bering Sea | 697,324 | 0 | -697,324 | -787 | 0 | 0 | 0 | 0 |
| Baltic Sea | 15,337 | 0 | -15,337 | 0 | 0 | 0 | 0 | 0 |
| Sea of Okhotsk | 853,240 | 0 | -853,240 | 0 | 0 | 0 | 0 | 0 |
| Yellow Sea | 0 | 0 | 0 | 0 | 0 | 0 | 0 | 0 |
| Barents Sea | 645,917 | 112,870 | -533,047 | 13,781 | 18,252 | 16,257 | 716 | 1,261 |
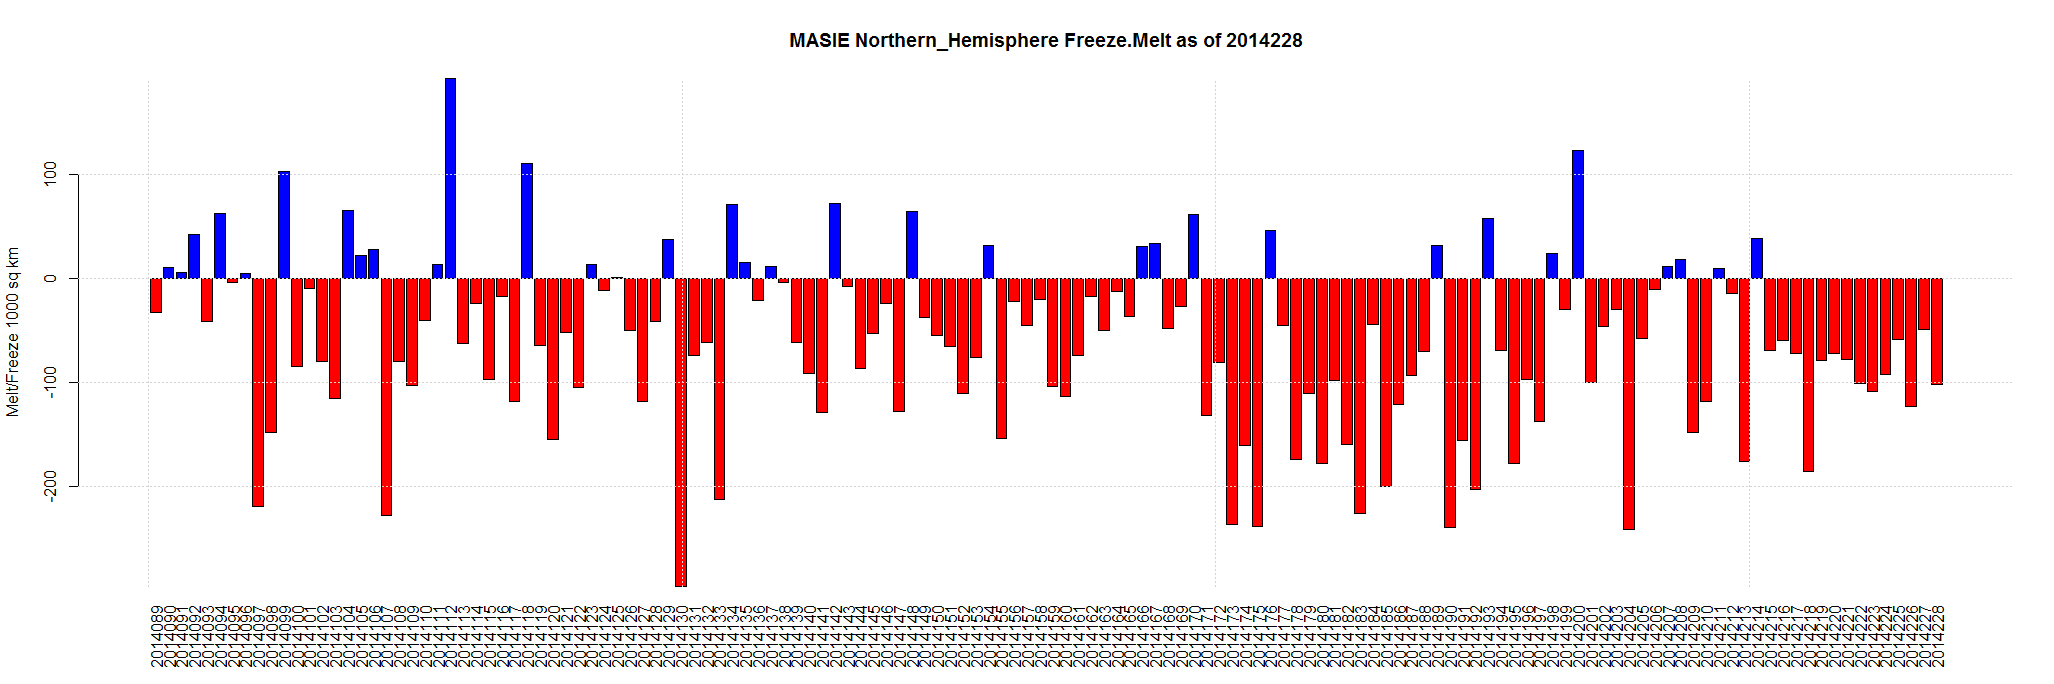
| Northern Hemisphere (Total) | 14,805,115 | 6,180,730 | -8,624,384 | -2,115,642 | -1,251,492 | -635,089 | -274,684 | -102,168 |
| NH (Average Loss per Day) | -61,166 | -75,559 | -89,392 | -90,727 | -91,561 | -102,168 |

Day 228–NH ice appears to be trending similar to 2013 and 2009. Both those years had below average melts: about 64% of max, and 2009 minimum was a week later (day 264).
If those analogues hold up, the MASIE extent would come out 5.5 to 5.7 M Km2 (comparable NOAA figure: 5.1 M Km2).
Presently the melting pace is stronger than the above scenario, every two days losing about 150,000 Km2 (1% of max).
Continuing at that rate ends up below 5 M Km2. At day 228, NH extent is 6.18 M Km2, a loss from max of 60%.
Those regions with below average melt:
Central Arctic now has 94% ice left
Beaufort Sea is now at 71%,
Canadian Archipelago is now at 62%
East Siberian Sea is down to 58%