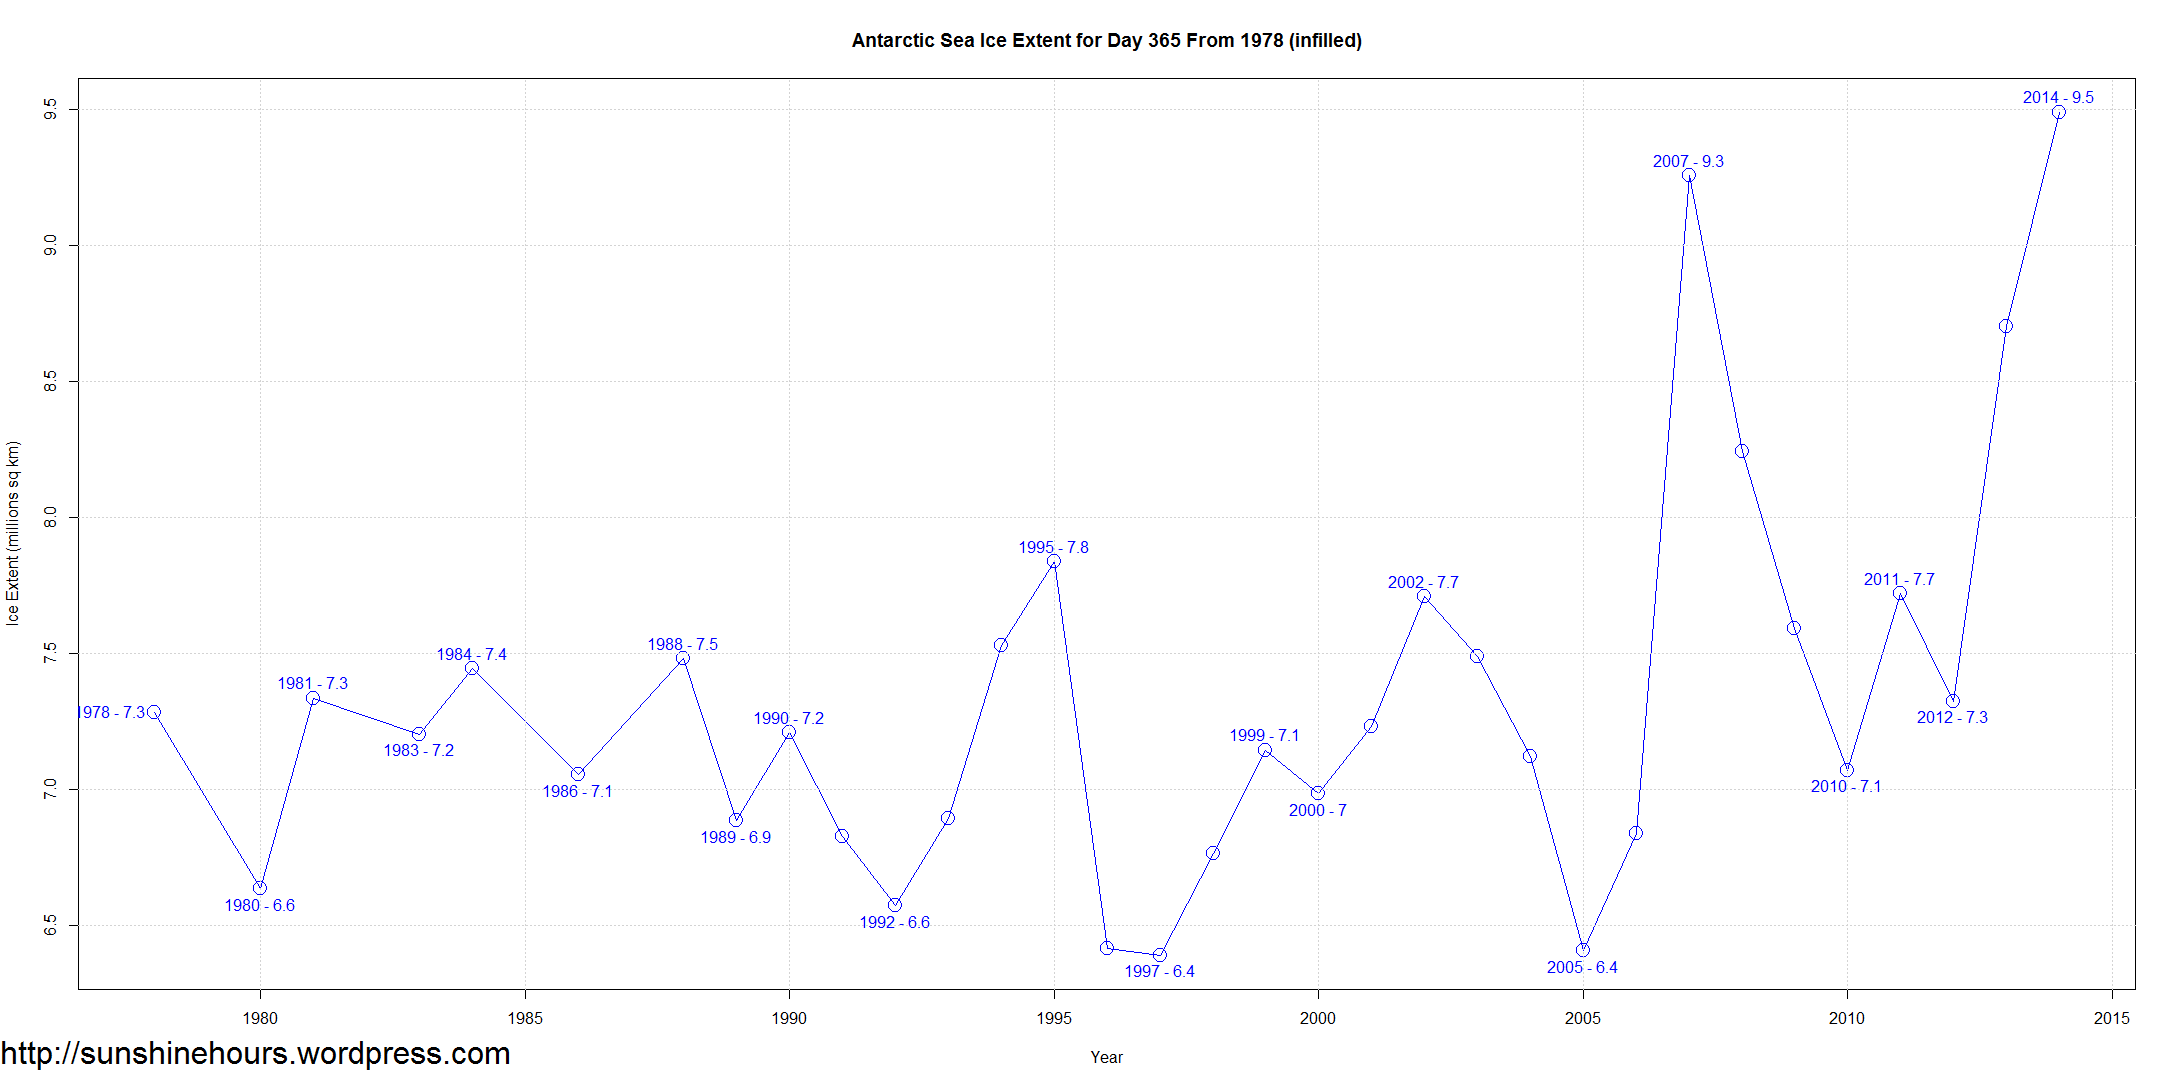
The increase in Antarctic Sea Ice Extent For Day 365 is pretty extraordinary. 3,000,000 sq km higher than 2005.
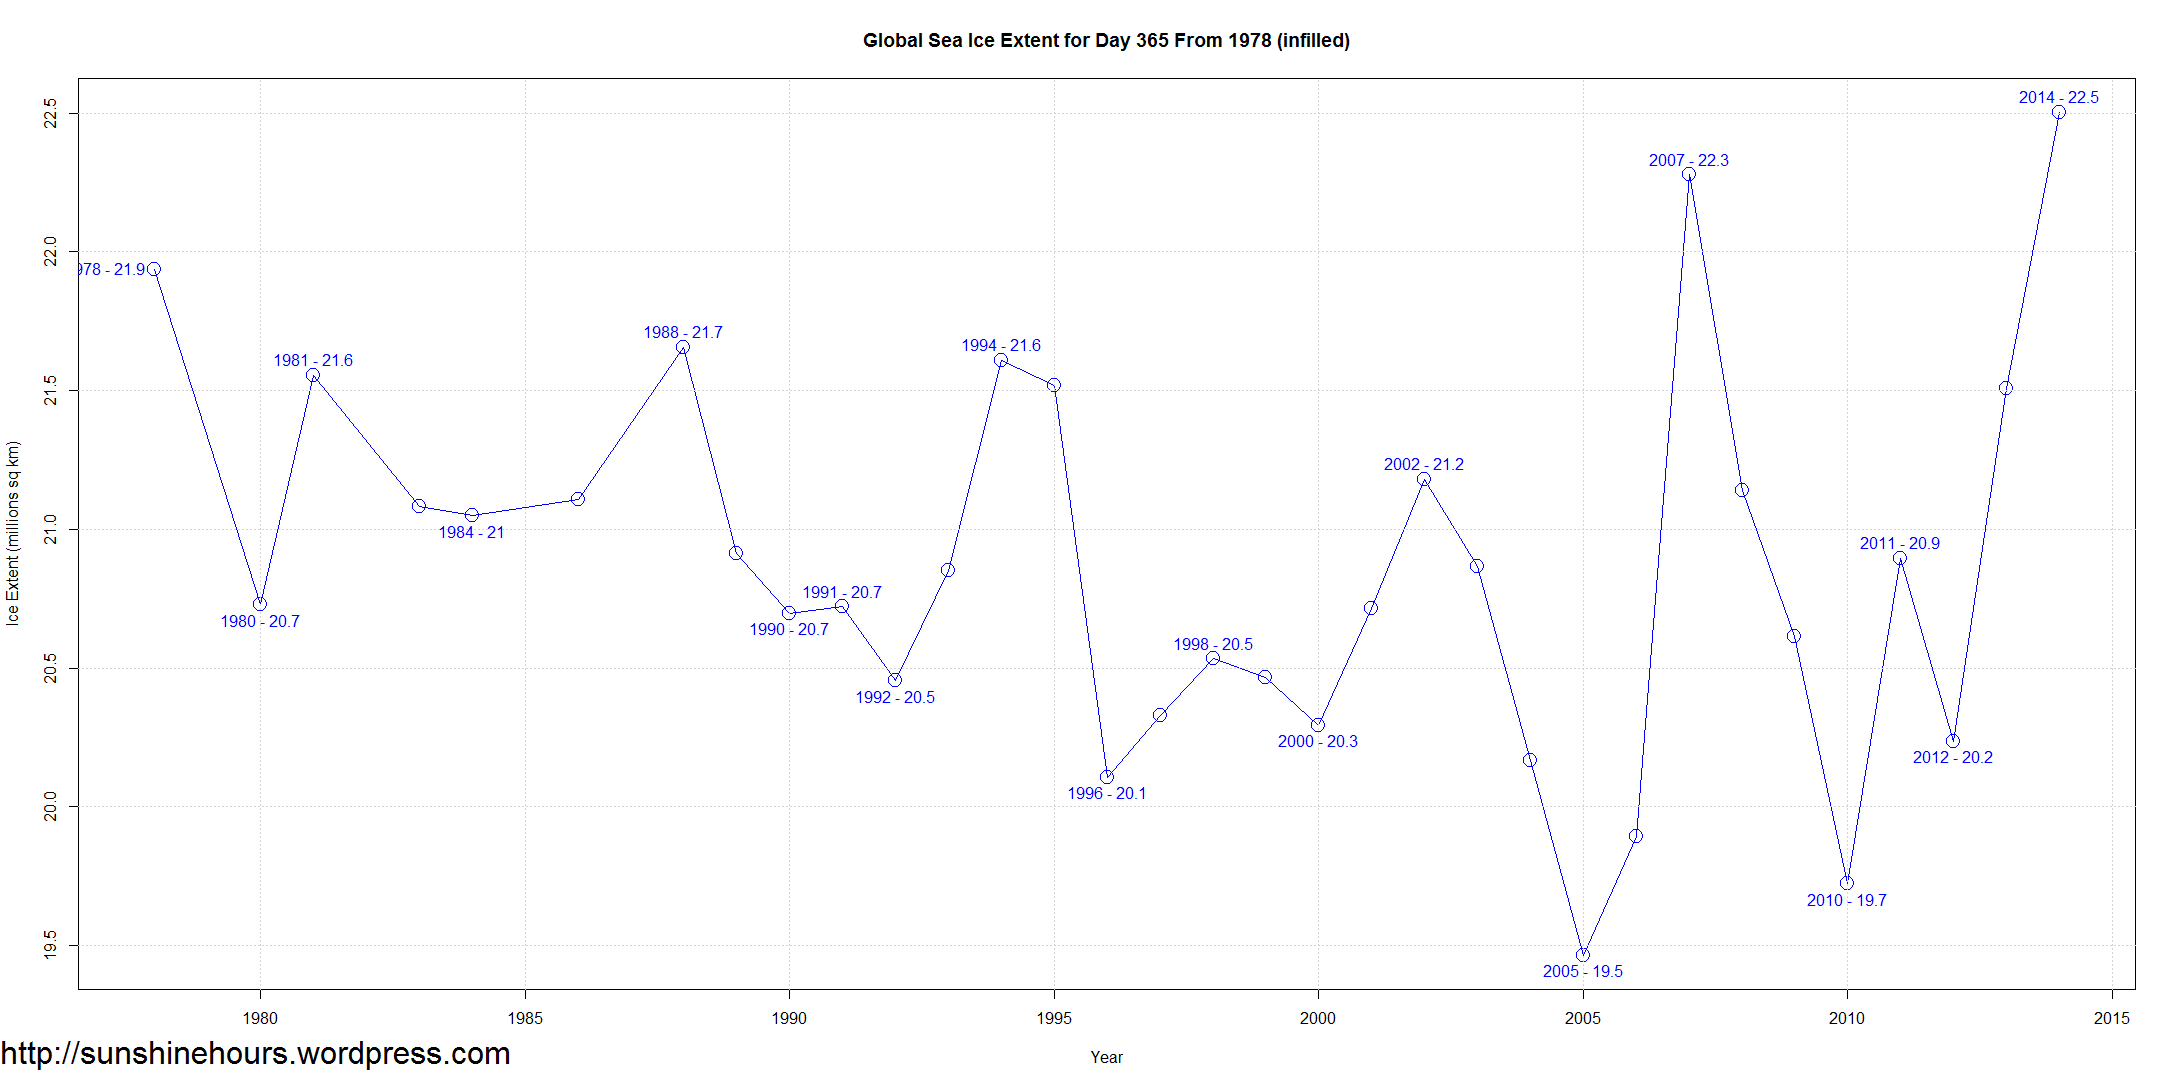
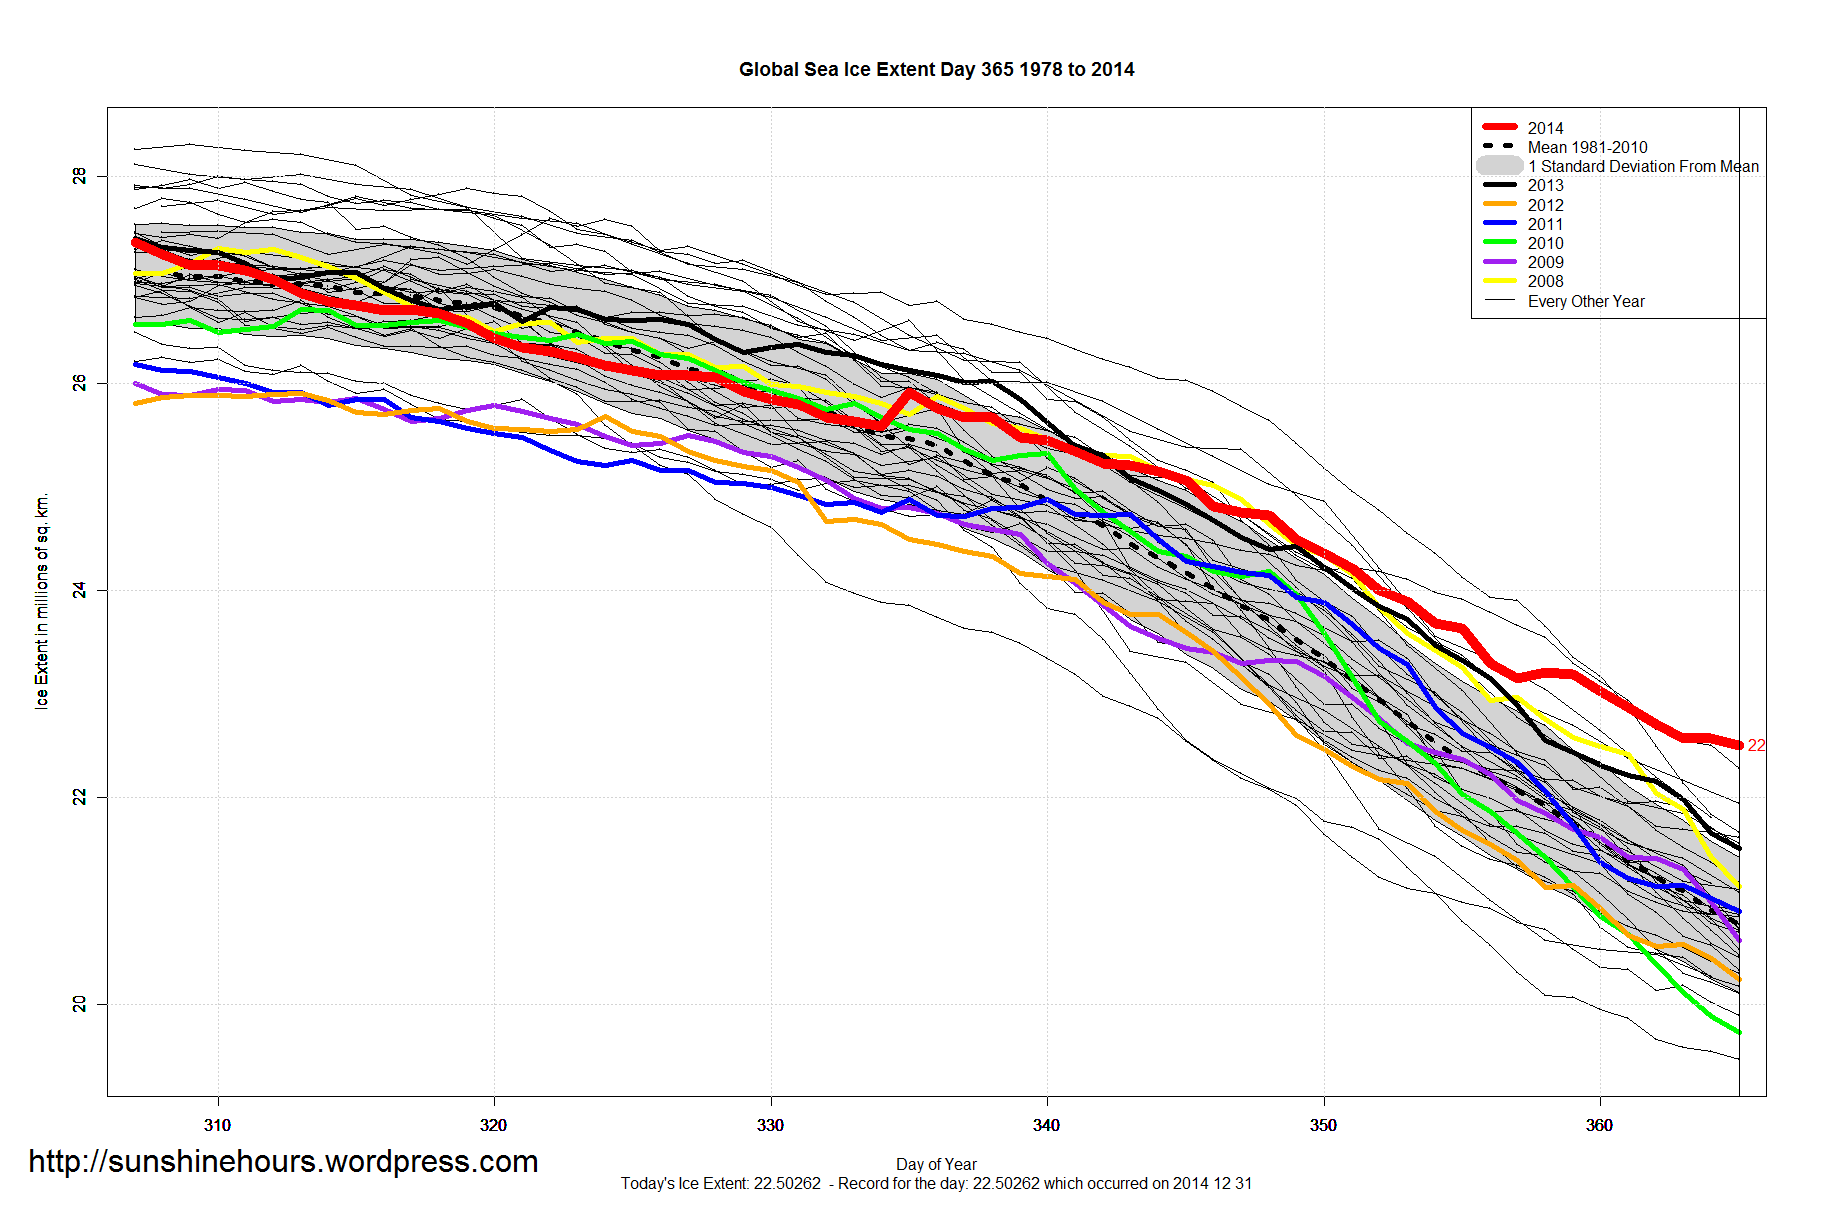
Which results in a record for Global Sea Ice Extent for day 365
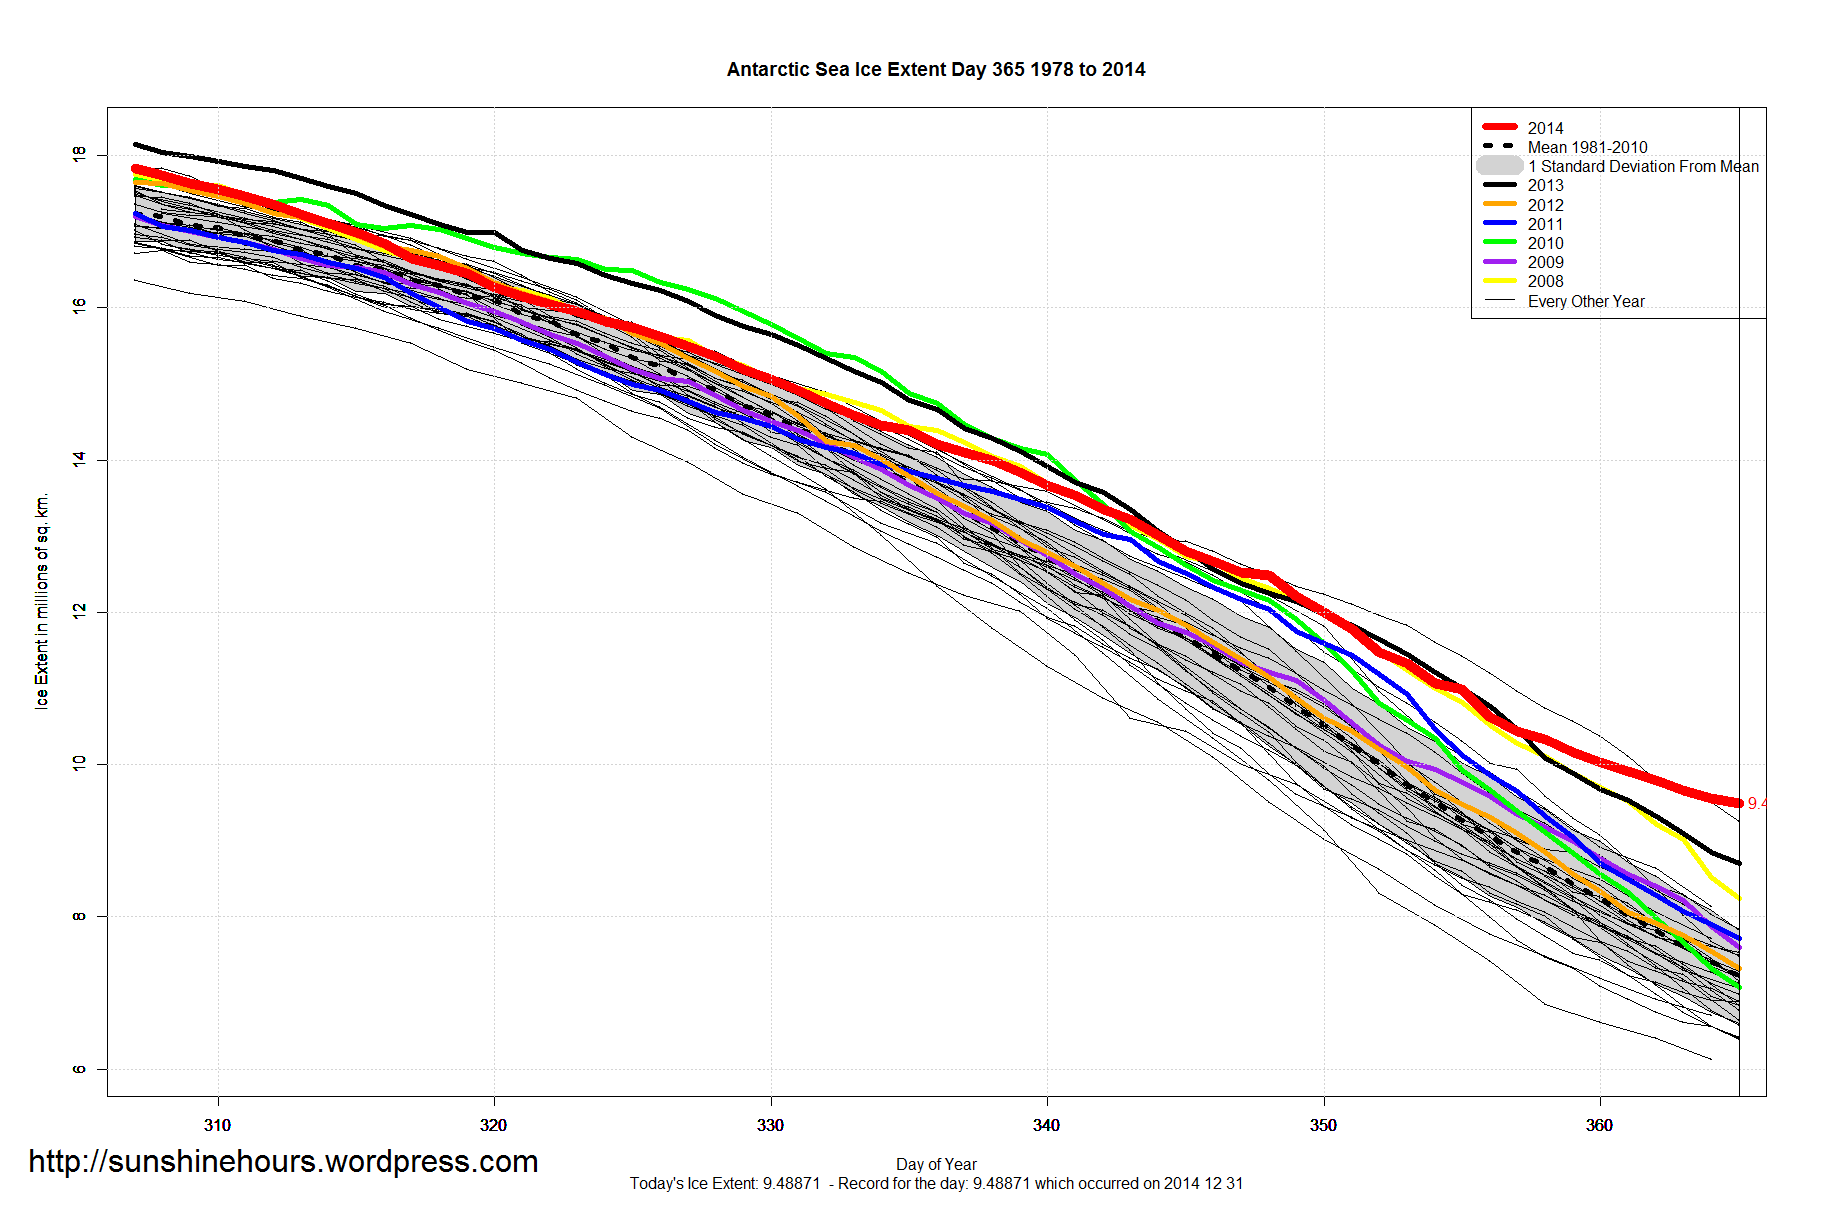
The increase in Antarctic Sea Ice Extent For Day 365 is pretty extraordinary. 3,000,000 sq km higher than 2005.
Which results in a record for Global Sea Ice Extent for day 365

If you remove 2007, 2008, 2013 and 2014 from the Antarctic record you end up with a much tighter trend so wouldn’t it be interesting to more closely examine why there has been so much variability to the upside since 2007, especially in terms of repeat “hottest years on record”. If it’s shifting wind patterns, or whatever it is, I say bring it on – because if you fear CAGW then you’re encouraged by the albedo effect of all that additional sea ice reflecting back ISI.
The current record is so short it is hard to tell what “normal” is. It may be that giant fluctuations every 30 years is normal.
Regardless of whether giant fluctuations are normal every 30 years, I’d like an explanation from the “experts” to explain the jump in Antarctic sea ice growth during those years. Plot a trend line and draw the 1SD and 2SD ranges; for the years I listed above, they’re significantly into the 2SD or 3SD range. So again, why? We have all the temps, wind patterns, cloud cover, etc. that could be drawn upon to explain the growth but I’ve not seen anything that attempts to explain it other than “shifting winds in a more circumpolar pattern”. Is that all? Wind controls polar ice caps, not CO2? Maybe then the CAGW freaks should look to minimize winds coming out of the North Pole so the Arctic sea ice can rebuild to more historical levels if they’re concerned it’s going to disappear.
All sarcasm aside, having just a few one-offs should be easier to explain than a consistent pattern. Or, as others have proposed, perhaps the climate is modulated more by the big yellow orb in the sky than the dirty fossil fuel combustion products we as humankind are pumping into the atmosphere.
Manabe et al (1991) projected Increasing Antarctic sea ice with increasing CO2. It seems this is part of the problem, but it doesn’t explain it all:
Click to access sm9101.pdf
page 795.
See also:
“In short, the increased supply of fresh surface water from both land-bound ice melt and increased precipitation increases the halocline gradient, which reduces upwelling of warmer bottom waters, decreasing sea surface temperature, and thus leading to more sea ice.”
http://tamino.wordpress.com/2013/03/16/antarctic-sea-ice-gain/#comment-80113
The paper discusses ice thickness … not extent … over 100 years.
The really interesting point is why Antarctic Sea Ice Extent is up 50% for day 1 since 2006?
It would be interesting to know the ice-albedo effect for Antarctic sea ice. For Arctic sea ice lost, the forcing change 1979 and 2011 is 25% as large as that due to the change in CO2 in the same interval:
Observational determination of albedo decrease caused by vanishing Arctic sea ice
Kristina Pistone et al, PNAS (2014)
http://www.pnas.org/content/111/9/3322.abstract
I don’t know of any similar paper for Antarctic SI; if you know of any, please give links….
The decrease in Arctic SI since 1979 (-53,000 km2/yr) is more than the increase in Antarctic SI (+32,000 km2/yr), but the Antarctic SI is at a higher latitude. But it’s also more variable than for the Arctic. If I had to guess, it would be that they about cancel each other.
Duh, I meant of course that Antarctic sea ice is generally at a LOWER latitude.
https://sunshinehours.wordpress.com/2012/09/30/impact-of-more-antarctic-sea-ice/
“Thus, “simple” physics and geography shows that an increase in Antarctic Sea by 1.5 million km^2 ABOVE its previous “average” of 15.0 million km^2 SIGNIFICANTLY increases heat loss from the planet. An (potential) loss even of the entire remaining sea ice of 3.4 million km^2 increases heat loss from the planet.”
Or am I suddenly being moderated because my data isn’t welcome?
Blog: Its because you were a douchebag for accusing the author of the post on albedo of “hand waving” when clearly it proved YOU were full of sh*t.
I have edited this
Troll: Are you going to acknowledge that the decline in northern hemisphere snow cover is also real, of about the same magnitude as the gain in Antarctic sea ice, and at similar lower latitudes?
https://sunshinehours.wordpress.com/2015/01/03/appell-are-you-going-to-acknowledge-that-the-decline-in-northern-hemisphere-snow-cover-is-also-real/