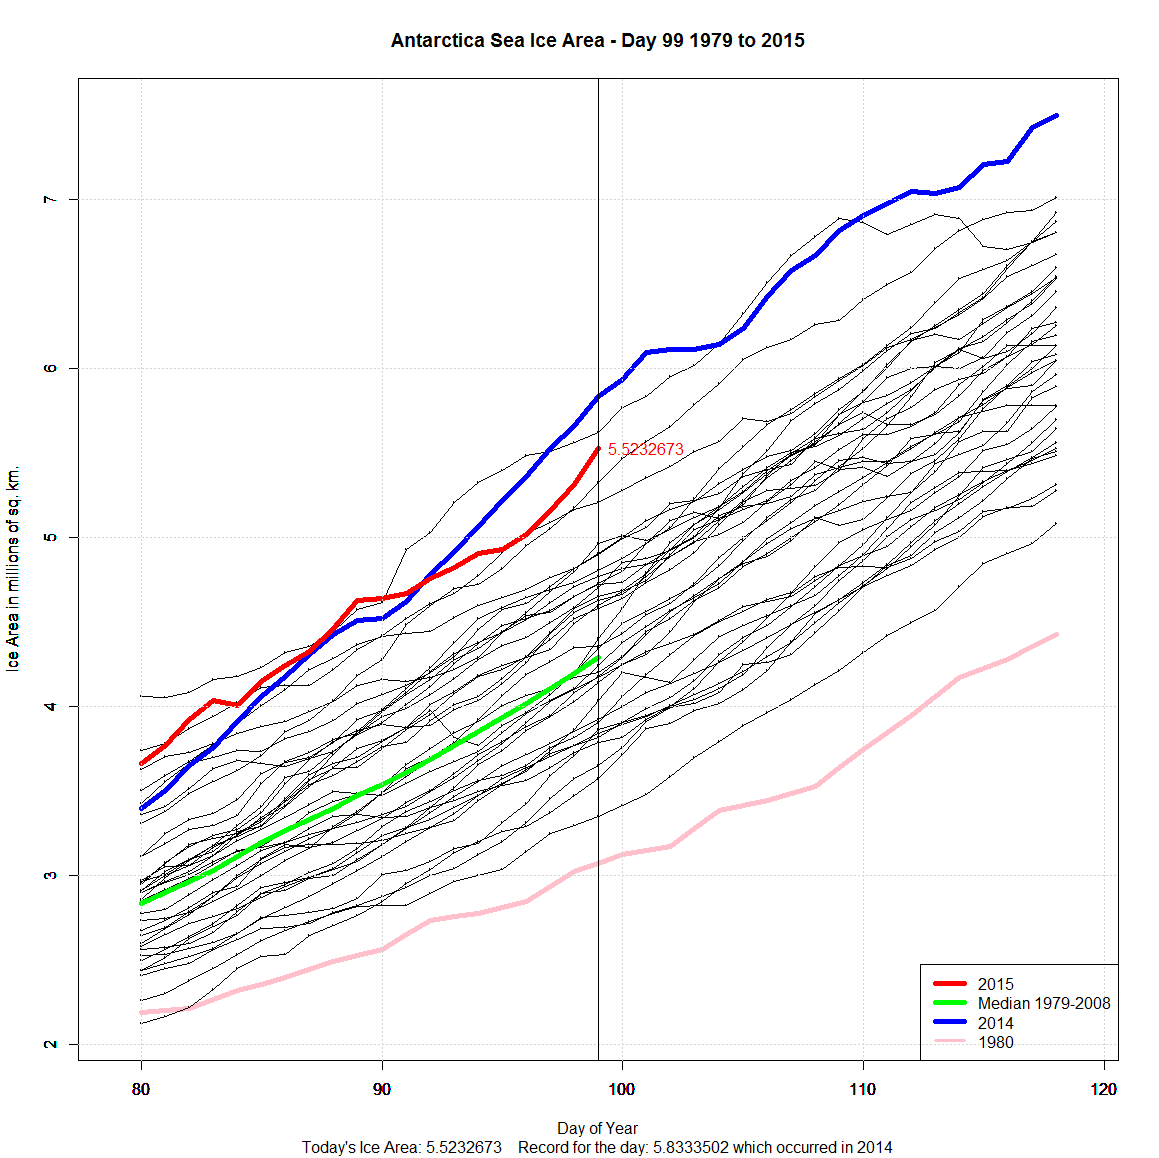
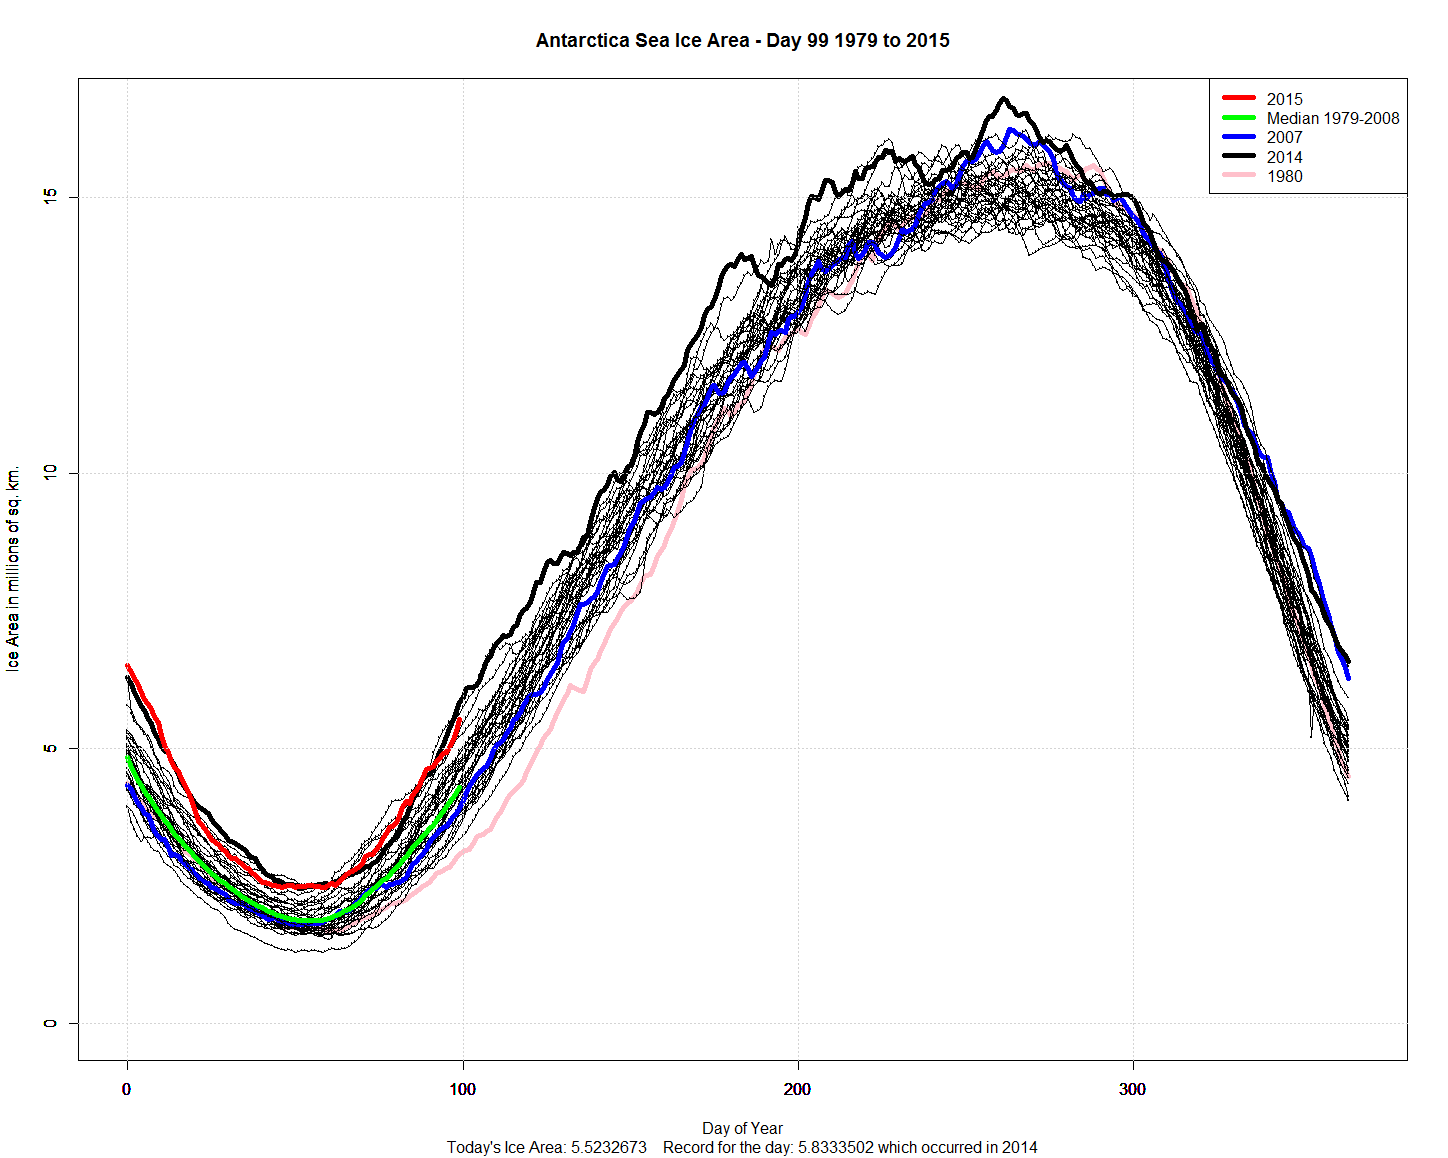
I usually do Sea Ice Extent. But I had a request for Area.
Antarctic Sea Ice Area Data is here. It is usually 5-6 days behind NSIDC Extent data.
I usually do Sea Ice Extent. But I had a request for Area.
Antarctic Sea Ice Area Data is here. It is usually 5-6 days behind NSIDC Extent data.

Thanks for doing this. Like many others who hit your site daily, I is on my list every day to check…thanks.
that should read ” It’s on my list….”
In looking at the Global Ocean Temperature Anomaly graphs, I just realized something. Around Antarctica, the anomaly is showing zero or slight cooling, but this is the region that has had increasing ice area/extent for 30 years. Even a slight amount of cooling or increase in ice area/extent is ominous; even holding steady is worrisome. I really don’t want the Earth to become cooler!
A second issue is that the anomaly charts measure the sea surface temperatures. What is the sea surface? Is is the top 1 foot or the top 300 feet? In either case the cold is 1000 to 30,000 feet deep. My point is that the Sun directly warms the surface so we are looking at “instantaneous” Solar input to global sea surface temperatures. Since there is “essentially” no direct Solar input to Antarctica this time of year, the anomaly graphs are showing heat transfer from the equator to the South Pole region via the oceans.
If the anomaly graphs show cooling by Antarctica, then there is less heat being transferred. If this is due to reduced heat/energy at the equator, then we are seeing the beginning of cooling even though CO2 has increased.
Just several thoughts…