MASIE results for day 133
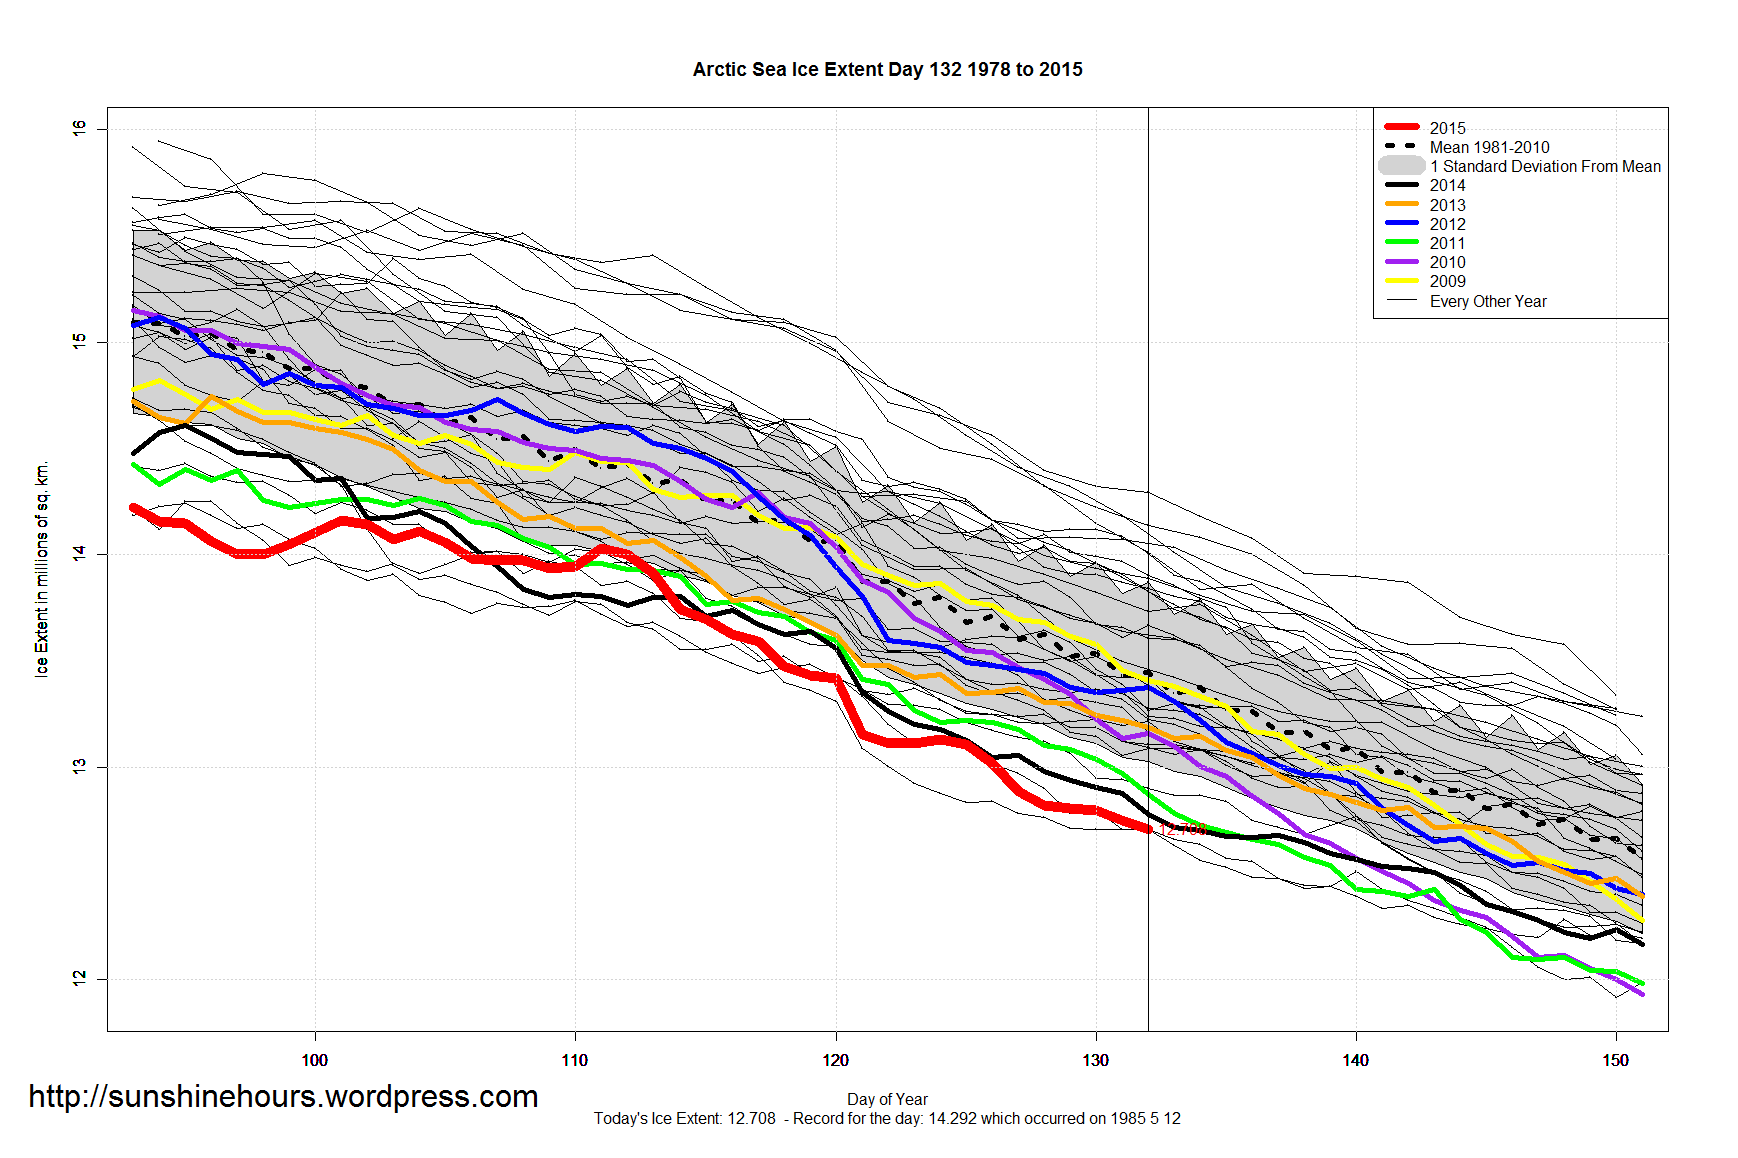
Gap closes, now same as day 130. 2014 lost about 212K on this day while 2015 lost 44k Km2 down to 12.67M Km2. The loss is at 12.9% from NH max on day 93. 2014 lead reduces to 0.8%.
2015 losses occurred mostly in Baffin and Hudson Bays, with slight gains in Greenland and Bering Seas.


Here are two sea ice graphs from the University of Bremen:
xxxhttp://www.iup.uni-bremen.de:8084/amsr2/extent_s_running_mean_amsr2_regular.png
xxxhttp://www.iup.uni-bremen.de:8084/amsr2/extent_n_running_mean_amsr2_regular.png
Just remove the xxx before the http: to view.
I love the “South” graph because the because it goes “off the chart” and they made no attempt to fix the chart!!!!
Pardon my grammar….
MASIE results for day 133
Gap closes, now same as day 130. 2014 lost about 212K on this day while 2015 lost 44k Km2 down to 12.67M Km2. The loss is at 12.9% from NH max on day 93. 2014 lead reduces to 0.8%.
2015 losses occurred mostly in Baffin and Hudson Bays, with slight gains in Greenland and Bering Seas.