5 thoughts on “Sea Ice Extent – Day 147 – Antarctic Sets 58th Daily Record – 11th Highest Global Sea Ice For This Day”
The Solar Flux is down to 93sfu. It takes about three weeks for a plus/minus Flux to reach Antarctica! [Sun at +20 degrees north]. Let’s watch and see if in three weeks Antarctica ice extent spikes…
It takes about one week to reach the Arctic: expect reduced melting.
Immediately, expect the storms over Texas, etc., to dissipate!
The Flux affects the Ozone layer and the upper atmosphere: higher Flux, warming/storms; lower Flux, cooling/calm.
Remember that the “lustrous Solar Physicists” said that the Sun was a “constant” until “it was not”. Did they retract their view? Of course not, they moved on. Until one of their “own” publishes a “definitive paper”, we are stuck with CO2, SO2, etc., for what makes “climate”.
I have a PhD is Physical Systems. I know the arrogance of these “creeps”!!!! You are in, or you are out. Just try to present a different view point!
Great post. Last year was very easy to see spikes and dips with S Sea ice area charts and solar spikes and dips. This year because their is much Mort static in the atmosphere it seems.
Solar cycle #24 is an amazing cycle..
Am I missing something Bruce. Says from 5/22 3 day mean but at first look data they use shows more ice?

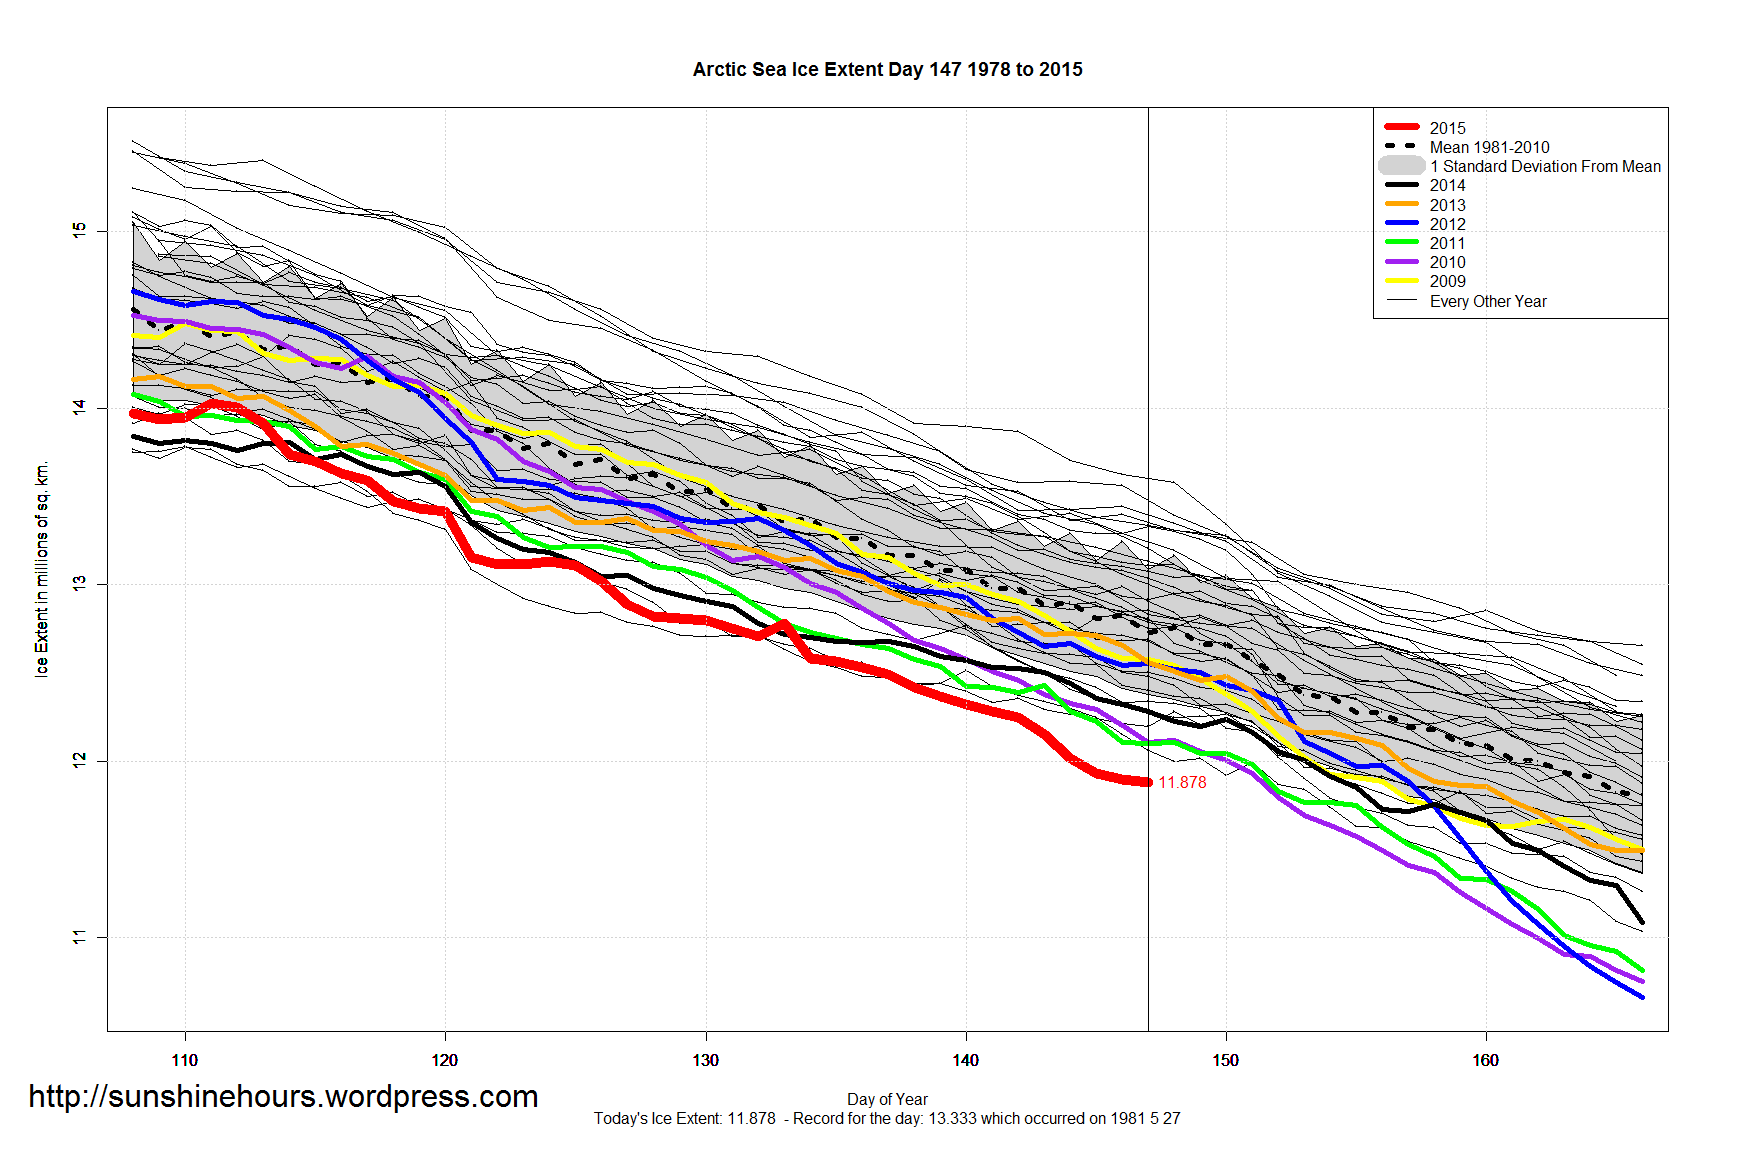
The last 10 days of NSIDC:
12.365 12.323 12.281 12.249 12.152 12.014 11.927 11.896 11.878 11.859
The last 10 days of MASIE
12.706238 12.712024 12.643909 12.379858 12.374938 12.370994 12.346640 12.238507 11.999257 11.749481
MASIE uses different sensors and methodology. There are numerous Sea Ice methodologies, all with a different number.
Thanks, keep up the great work..