Is there any chance that you could break down the Arctic spaghetti graphs into three colored graphs for the 1980’s, 1990’s, and 2000’s? To me (and using a generous assumption) it looks as though over the past 35 years the Arctic has had three distinct phases where the winter maximum has shifted later, the September minimum has been deeper, and the summer melt has been more steep. Am I misinterpreting the data? Could those three decadal colored graphs be included once for reference?
No misinterpretation AZ you are spot on with that data analysis….the question is why? I don’t think you can dispute warming happened from 1979-1998…and a pause doesn’t mean a decrease so it just added more heat energy to the water….this to me is settled and not disputed….the question is to me is whether or not it’s natural and would it continue? Plenty of scientists from the 1970s said an ice age was immenent that it would warm for 20-30 years then stop and drop…this is before the global warming cash cow took over when science was still science
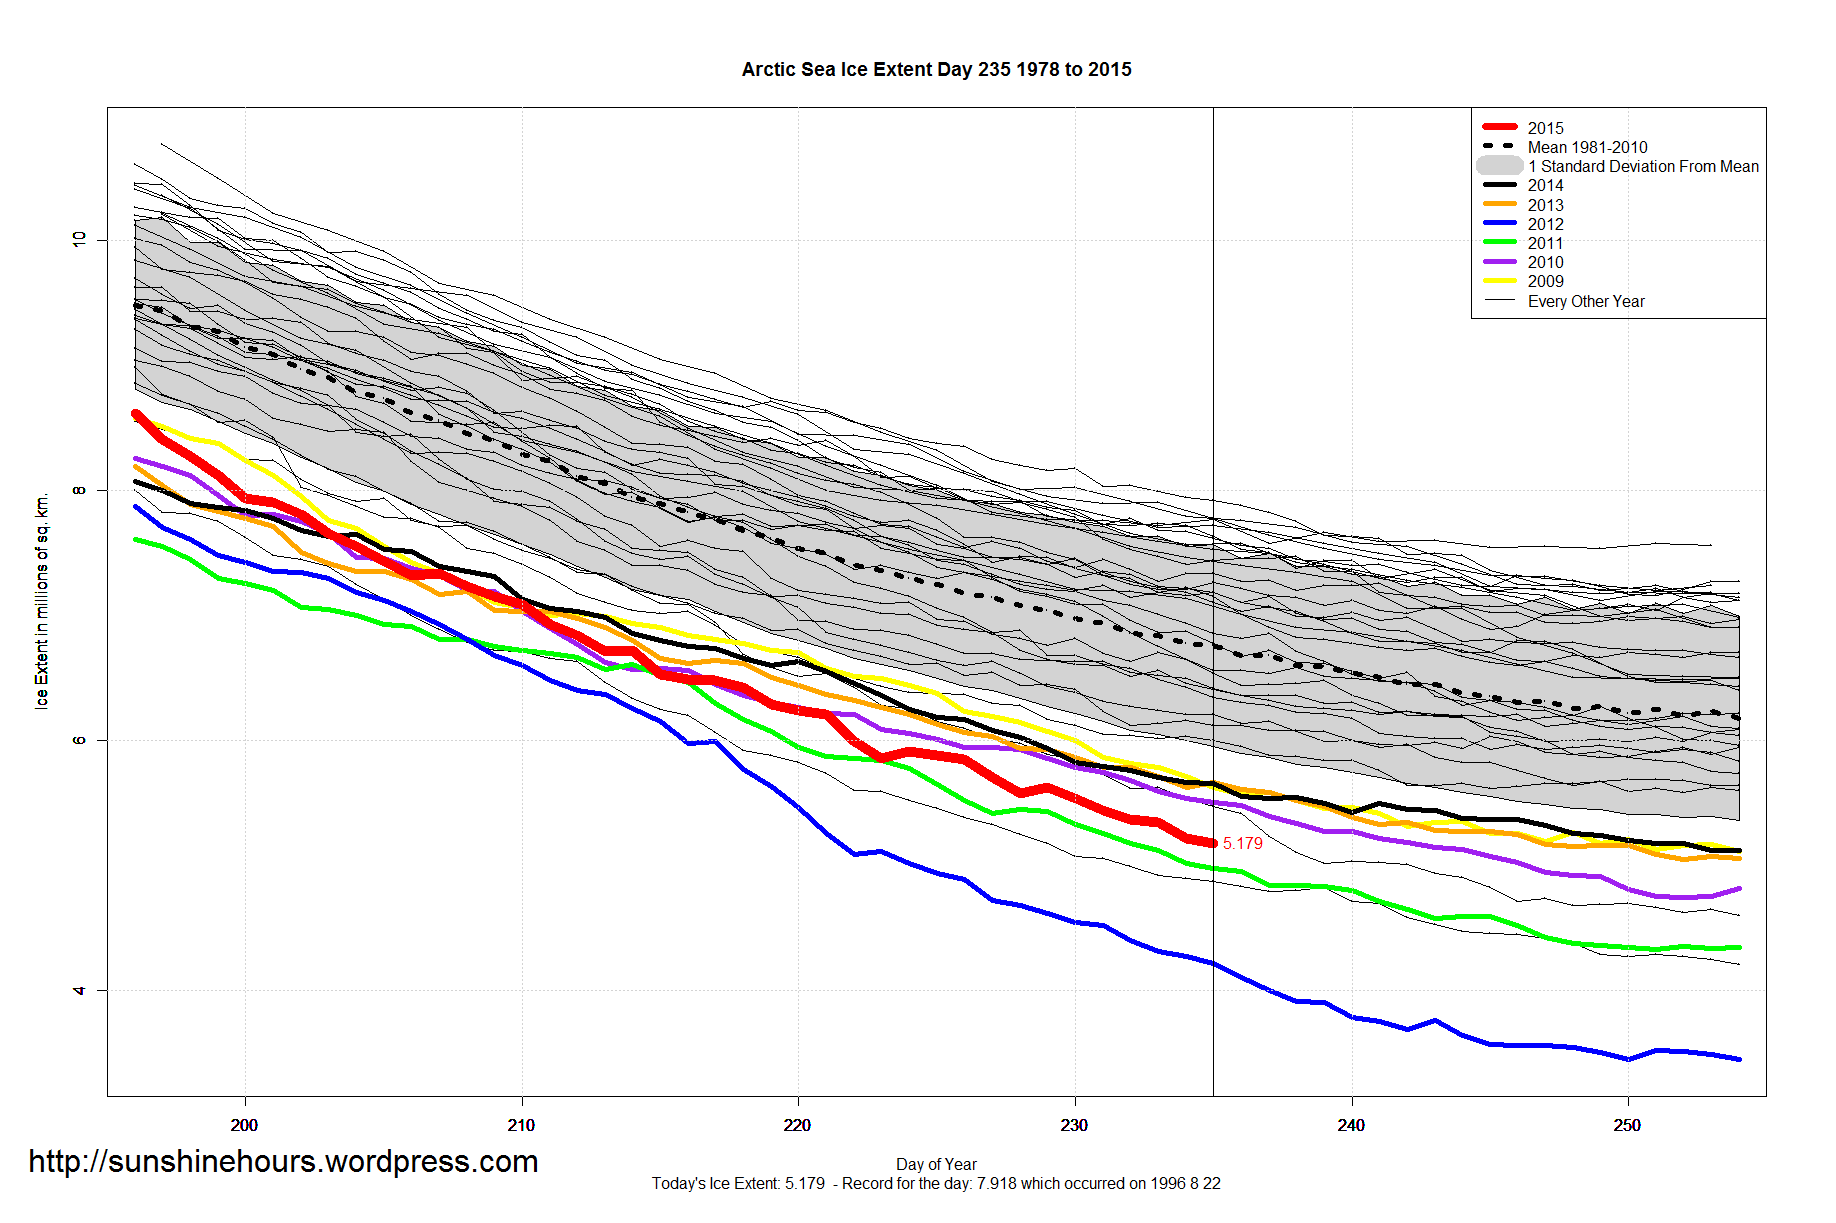
After silence for five days MASIE is back online.
https://rclutz.wordpress.com/2015/08/25/arctic-melt-final-stage-august-25-2015/