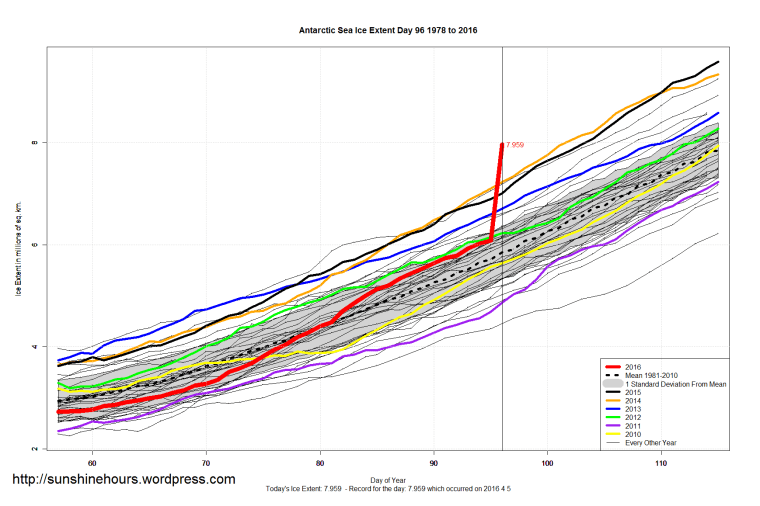
UPDATE 2: They updated the data, at 3:22 down to 5.786 (which is a 300,000 sq km drop from the day before. Not likely.
On day 96 the Antarctic sea ice extent took an unlikely jump from 6.082 million sq km to 7.959.
Sometimes they correct it the next day. Sometimes they don’t.
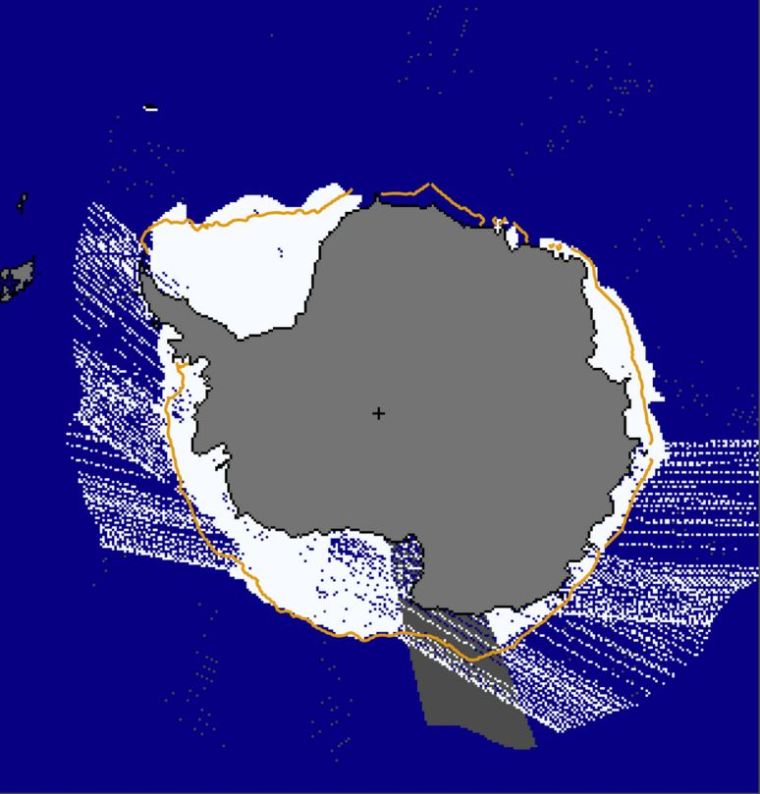
UPDATE: The “stuttering” in the daily Antarctic image. (Thanks AZ1971)

All caused by AGW, no doubt. The end is near.
In the past these spikes tended to occur when large areas of ocean had ice but not enough to qualify for ice cover. Even if they do self edit the graphs large areas are freezing quickly.
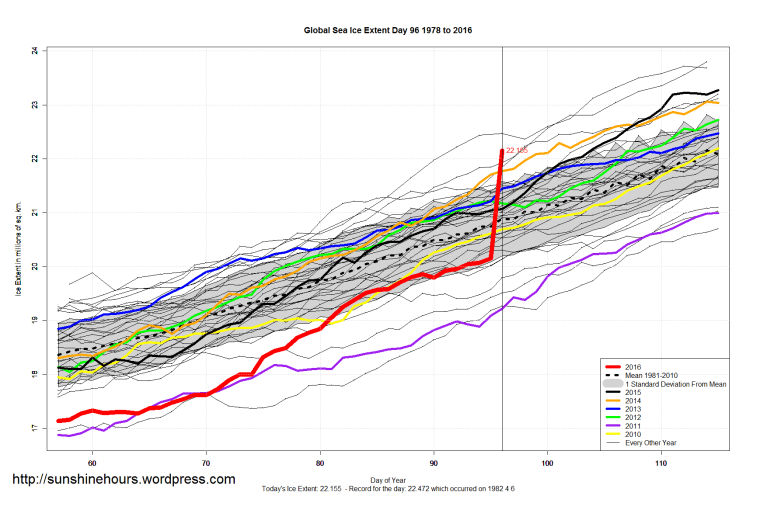
The discrepancy can be found in today’s NSIDC graph:

I wish I knew how to copy/save out a version of this for demonstration purposes because it’s apparent that the satellite feed is highly distorted.
If you are using a PC, see here:
http://www.wikihow.com/Take-a-Screenshot-in-Microsoft-Windows
If a Mac, use Grab.app in Applications/Utilities.