This is funny.
An anonymous blog commenter sends the above graph and writes:
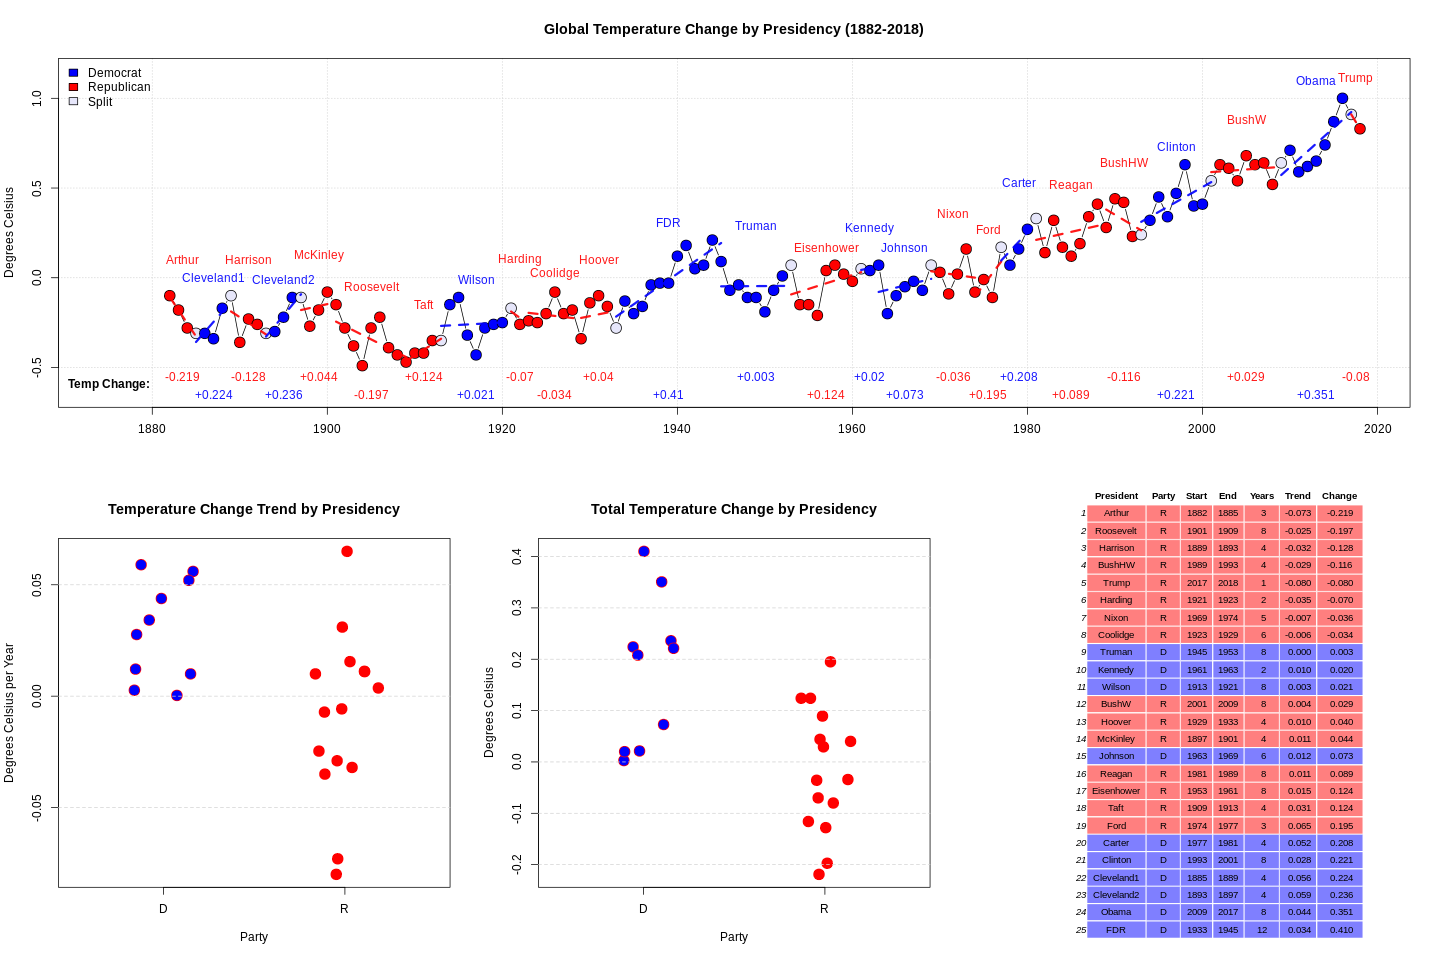
I was looking at the global temperature record and noticed an odd correlation the other day. Basically, I calculated the temperature trend for each presidency and multiplied by the number of years to get a “total temperature change”. If there was more than one president for a given year it was counted for both. I didn’t play around with different statistics to measure the amount of change, including/excluding the “split” years, etc. Maybe other ways of looking at it yield different results, this is just the first thing I did.
It turned out all 8 administrations who oversaw a cooling trend were Republican. There has never been a Democrat president who oversaw a cooling global temperature. Also, the top 6 warming presidencies were all Democrats.
I have no idea what it means but thought it may be of interest.

Reblogged this on HiFast News Feed.