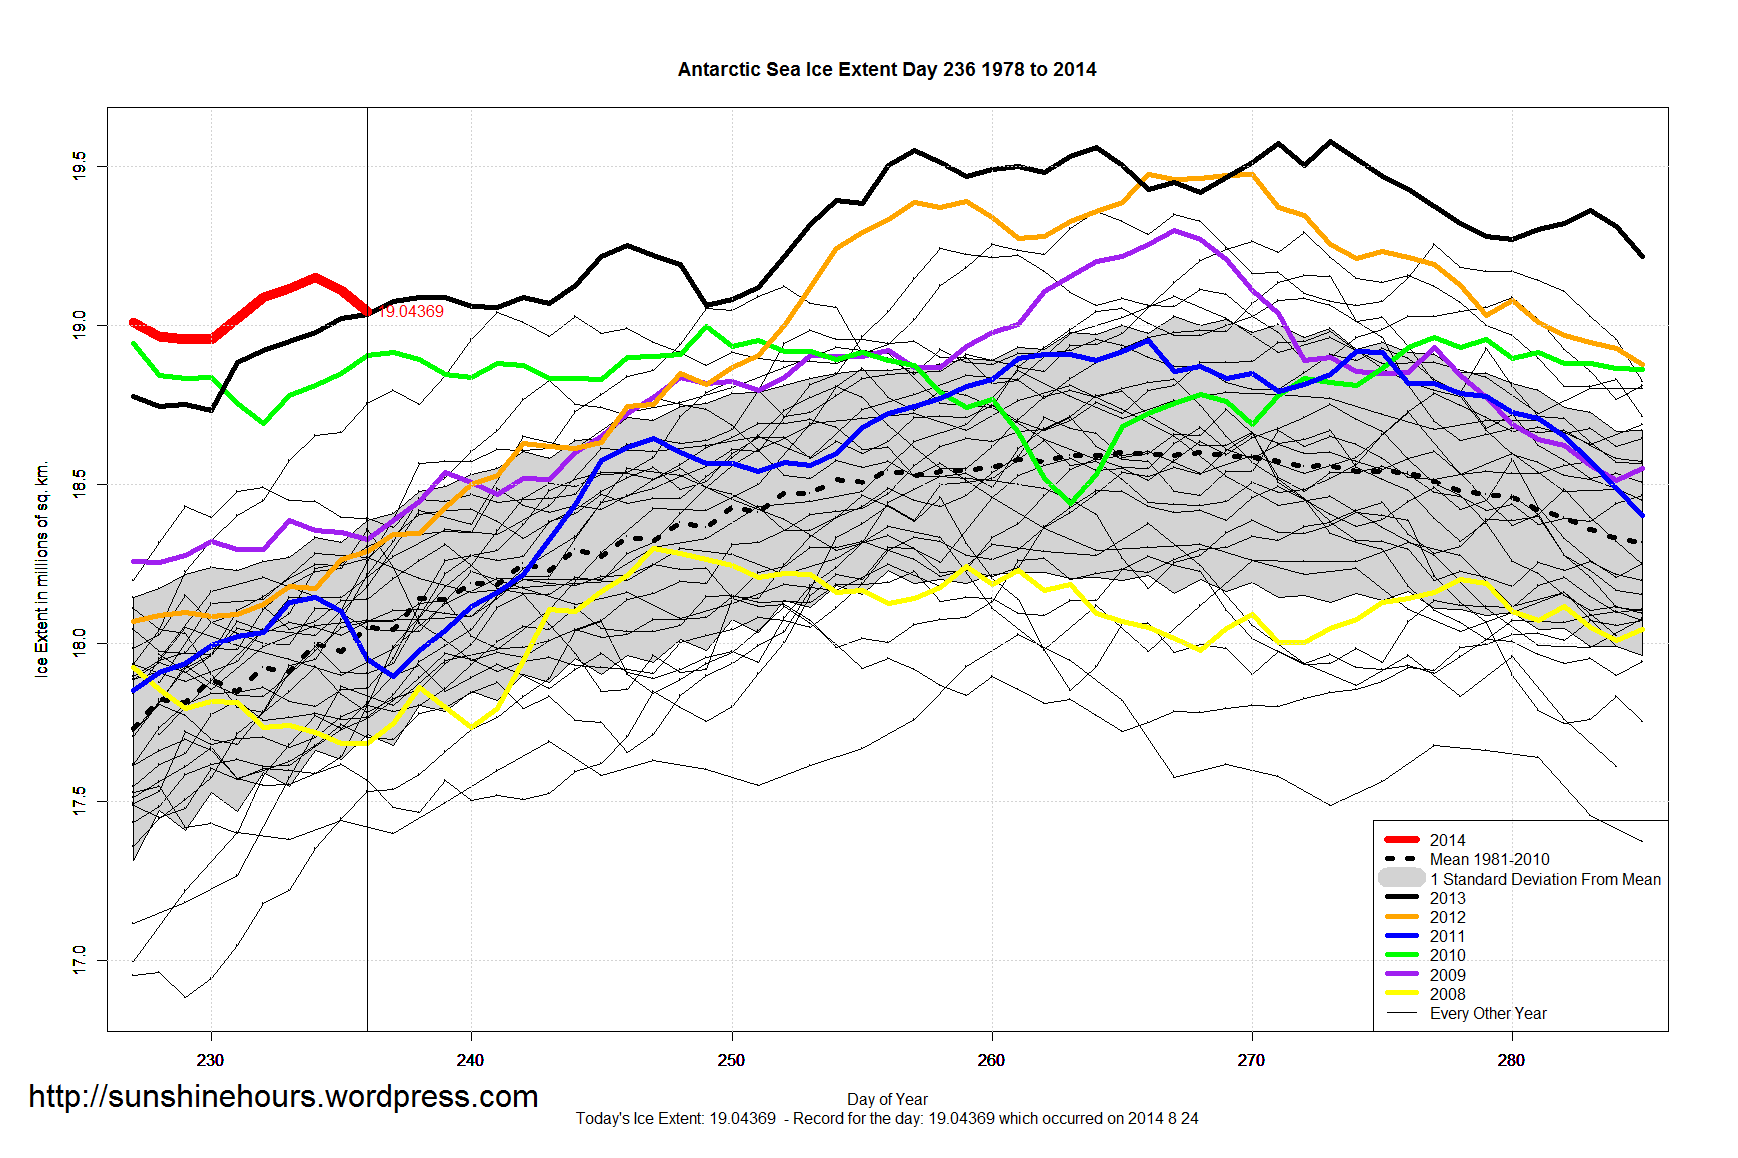
Antarctic Sea Ice Extent Aug 25 2014 – 1,026,000 sq km above the 1981-2010 mean. Data for Day 236. Data here.
2014 is 8,000 sq km higher than 2013.

Antarctic Sea Ice Extent Aug 25 2014 – 1,026,000 sq km above the 1981-2010 mean. Data for Day 236. Data here.
2014 is 8,000 sq km higher than 2013.
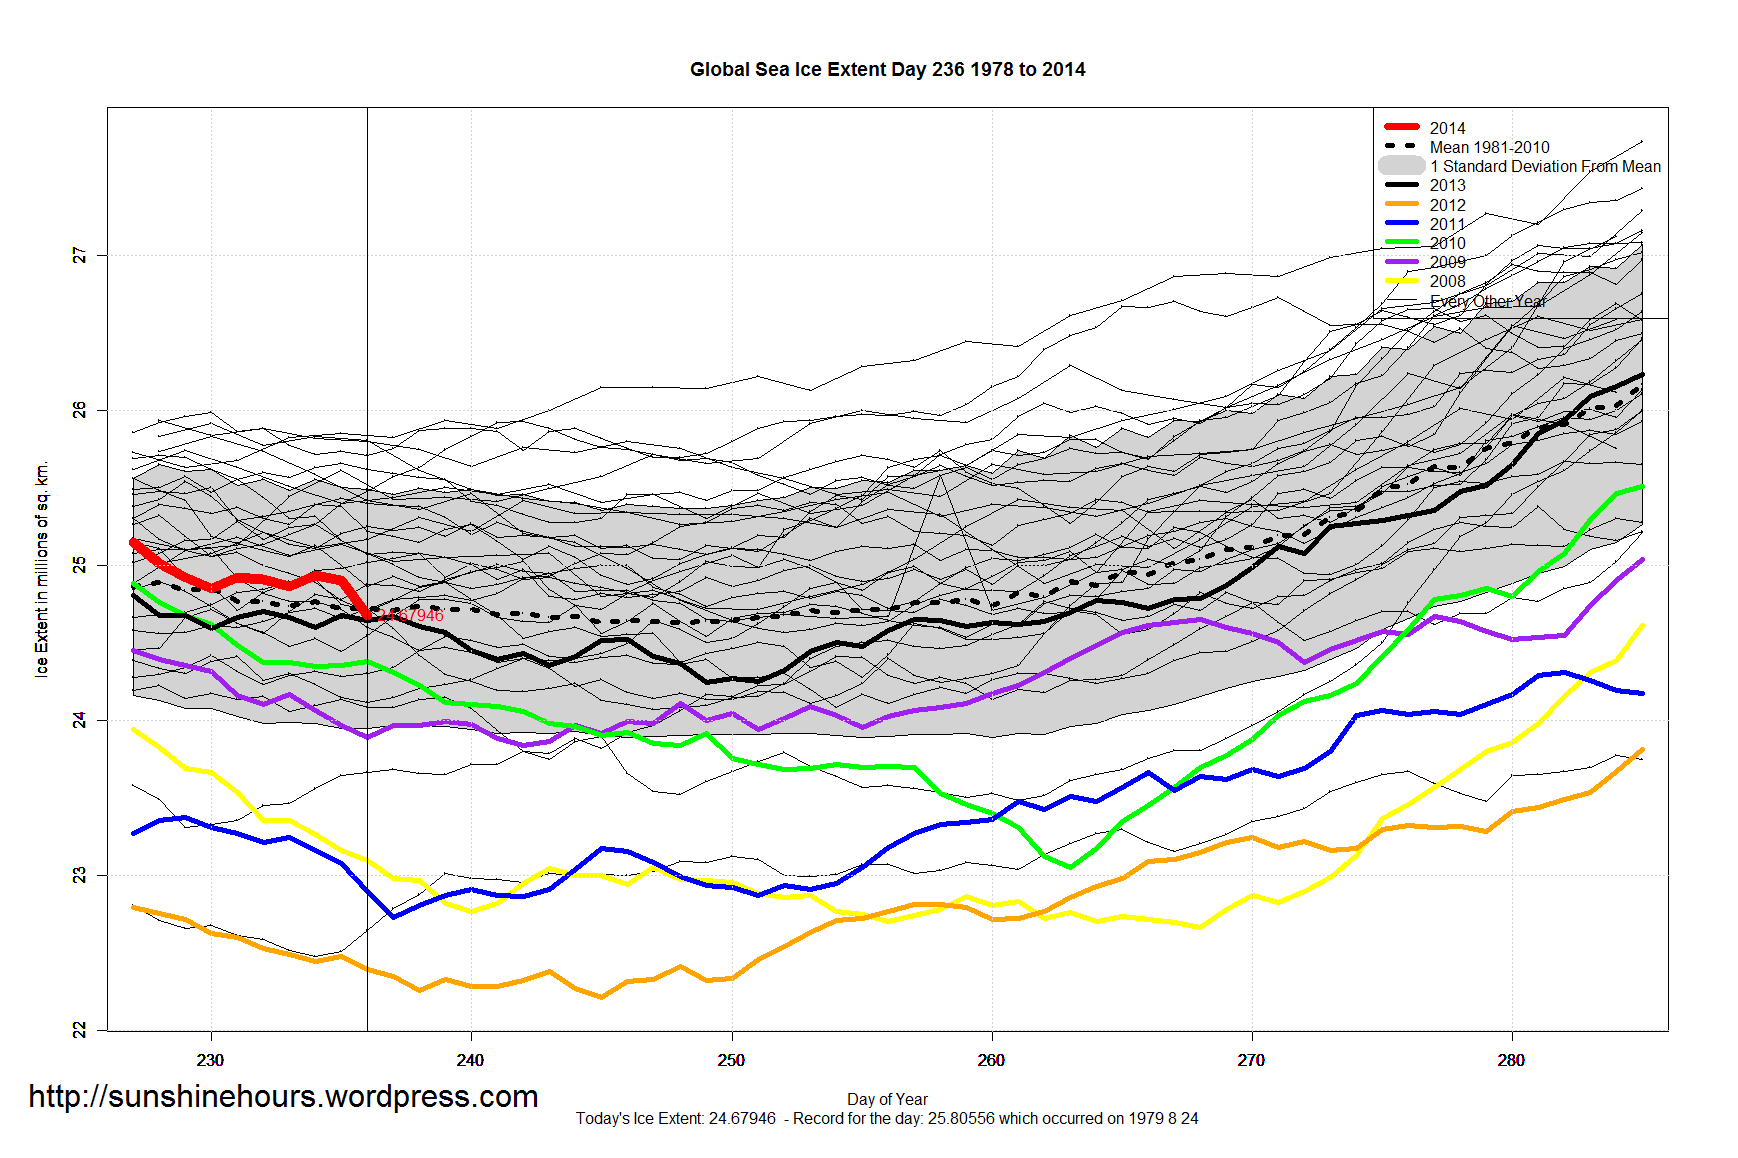
Global Sea Ice Extent Aug 25 2014 – -103,000 sq km below the 1981-2010 mean. Data for Day 236. Data here.

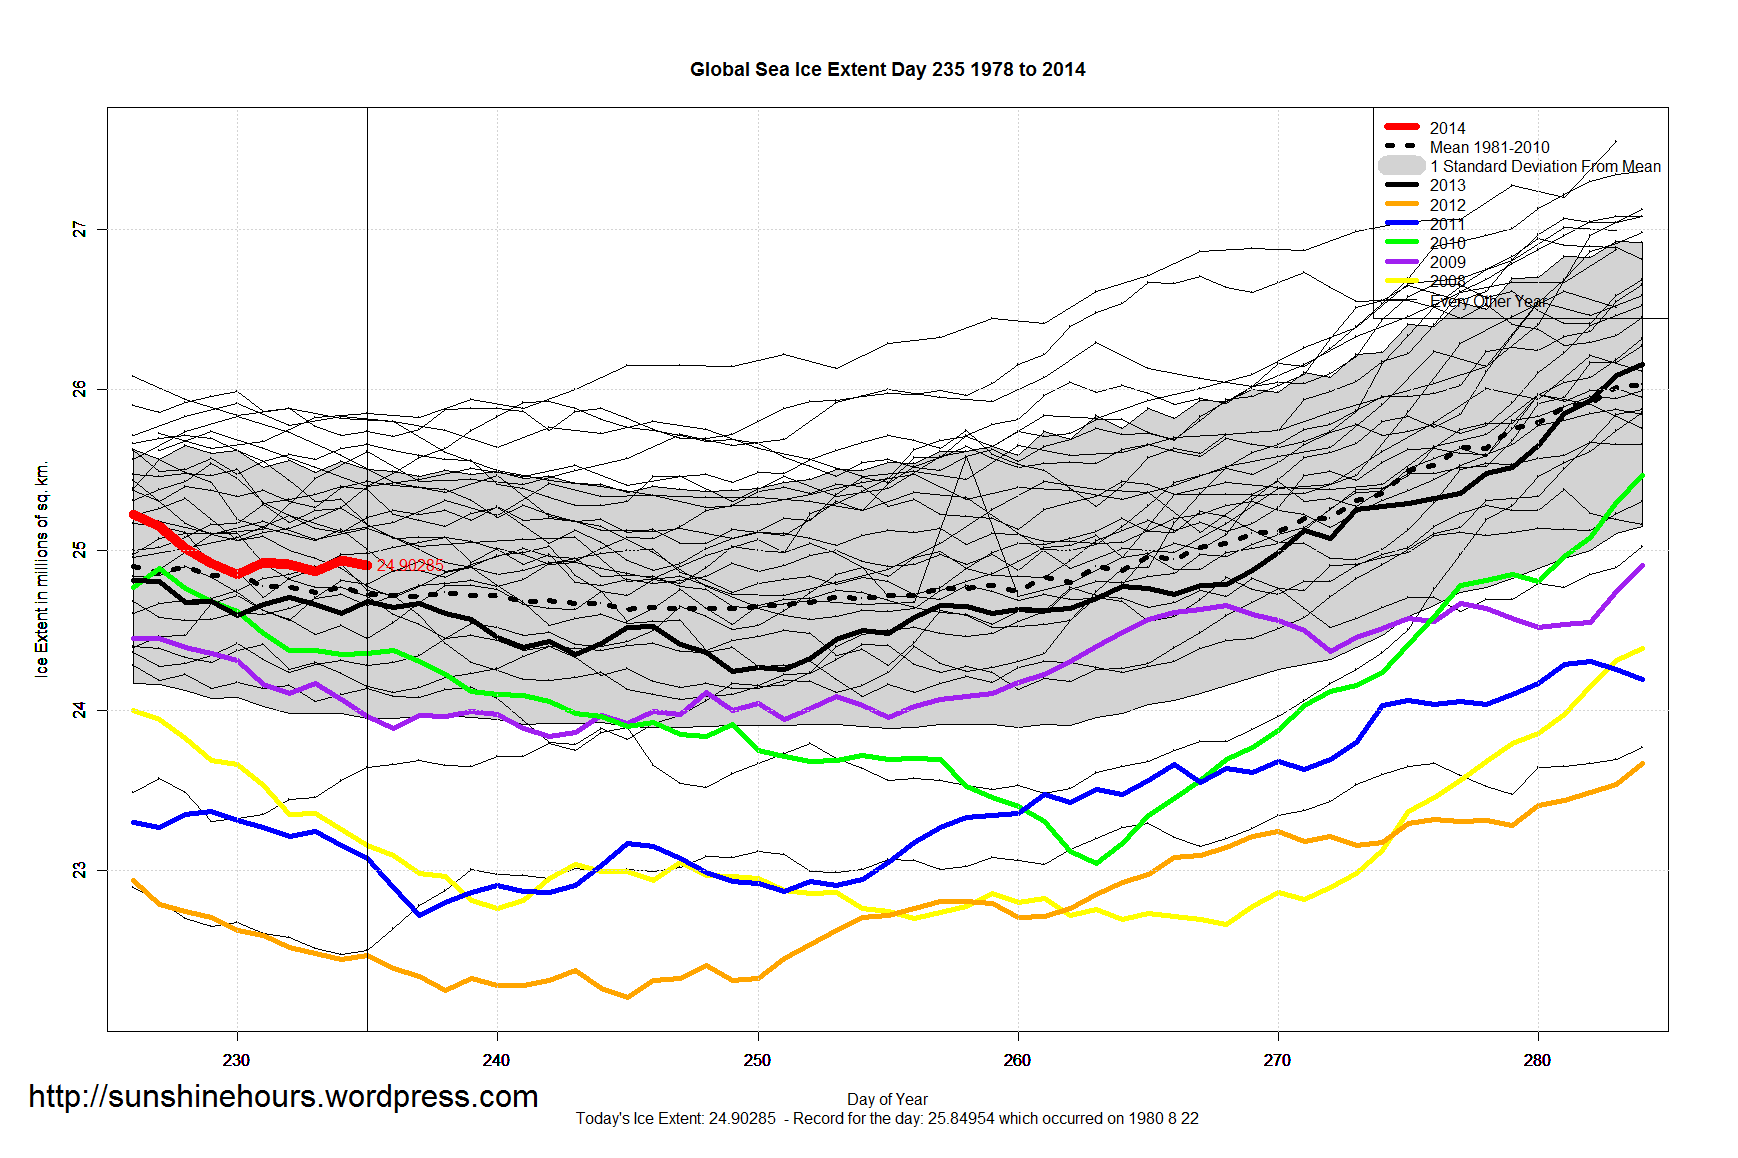
Global Sea Ice Extent Aug 24 2014 – 101,000 sq km above the 1981-2010 mean. Data for Day 235. Data here.

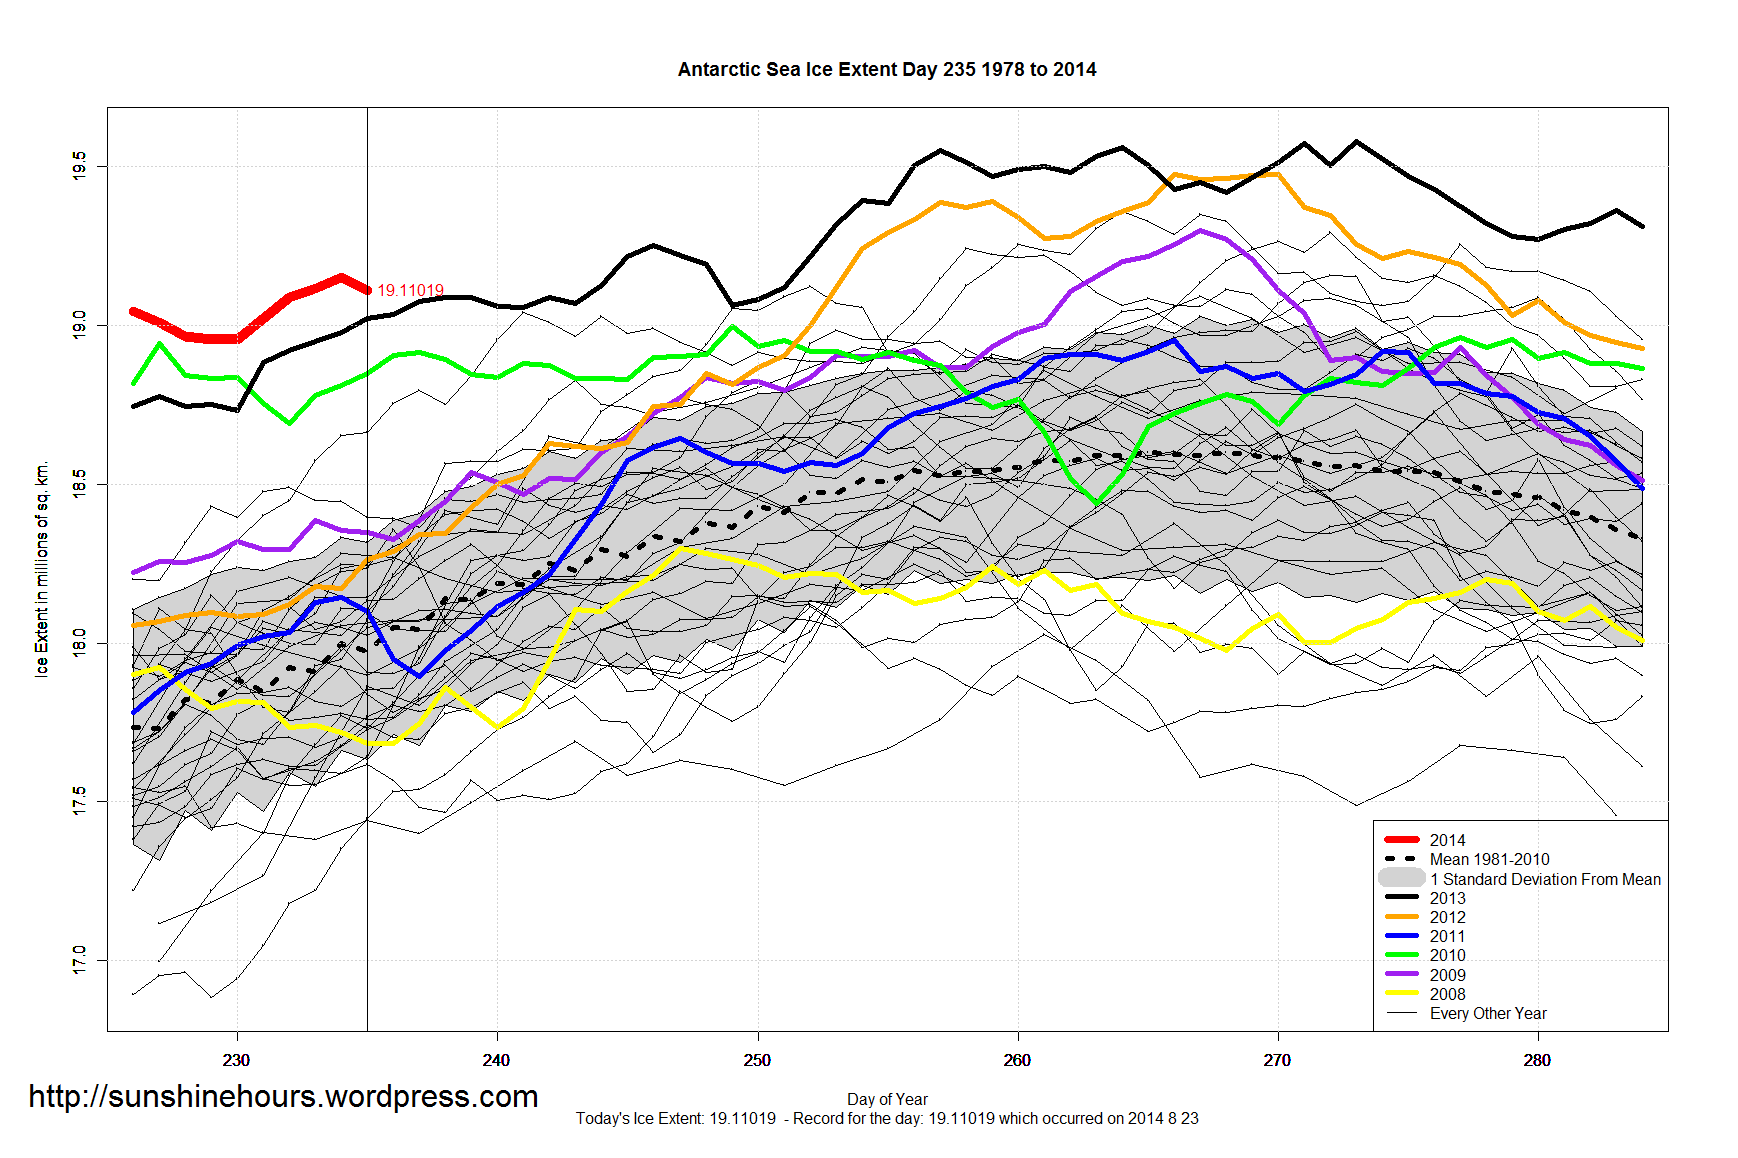
Antarctic Sea Ice Extent Aug 24 2014 – 1,125,000 sq km above the 1981-2010 mean. Data for Day 235. Data here.
157th Daily Record

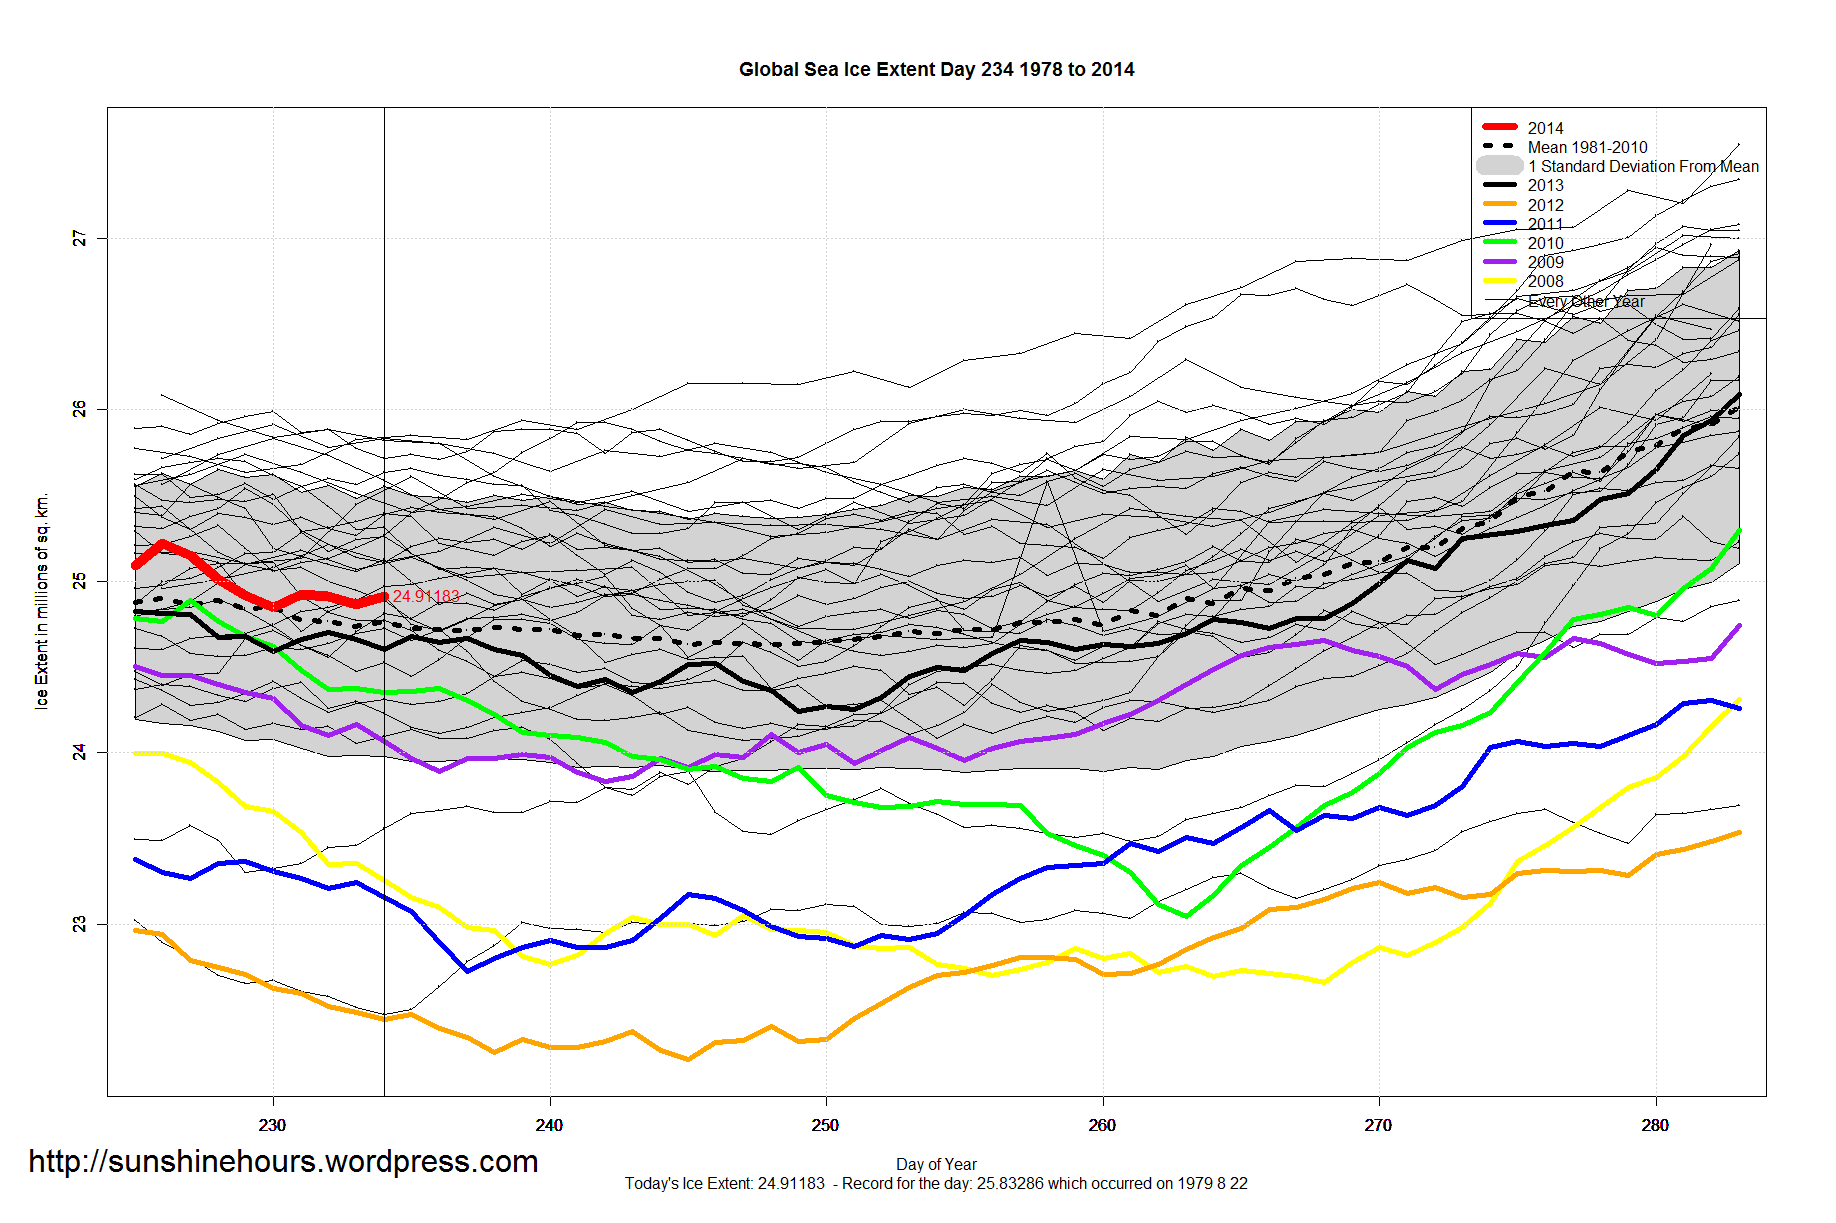
Global Sea Ice Extent Aug 23 2014 – 85,000 sq km above the 1981-2010 mean. Data for Day 234. Data here.

Antarctic Sea Ice Extent Aug 23 2014 – 1,156,000 sq km above the 1981-2010 mean. Data for Day 234. Data here.

NOTE: The data from NSIDC has a Missing column that is usually 0. Today it is 0.00054.
However, NSIDC did publish a new set of data several hours after I did my initial post. Previous post here.
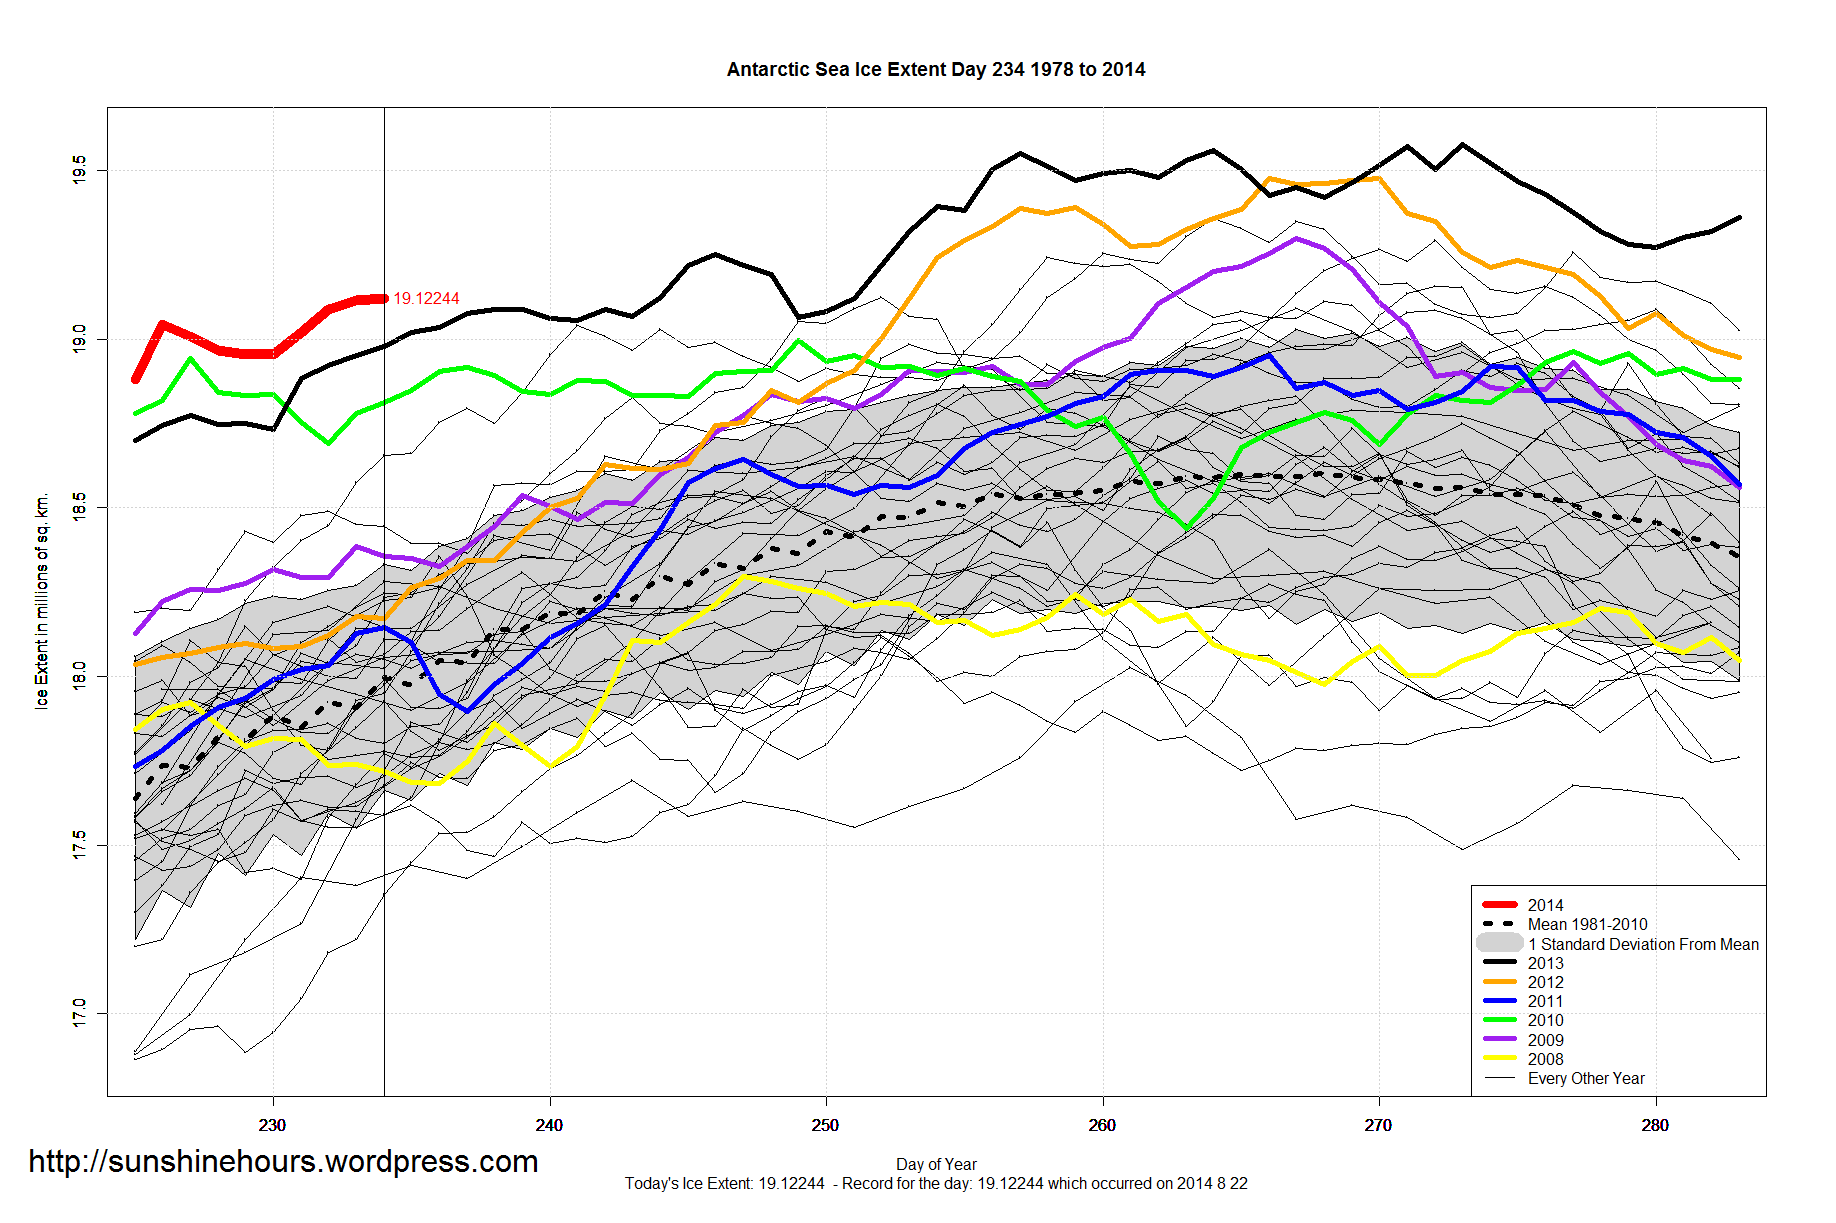
Antarctic Sea Ice Extent Aug 22 2014 – 1,189,000 sq km above the 1981-2010 mean. Data for Day 233. Data here.
A request. (I don’t usually do requests)
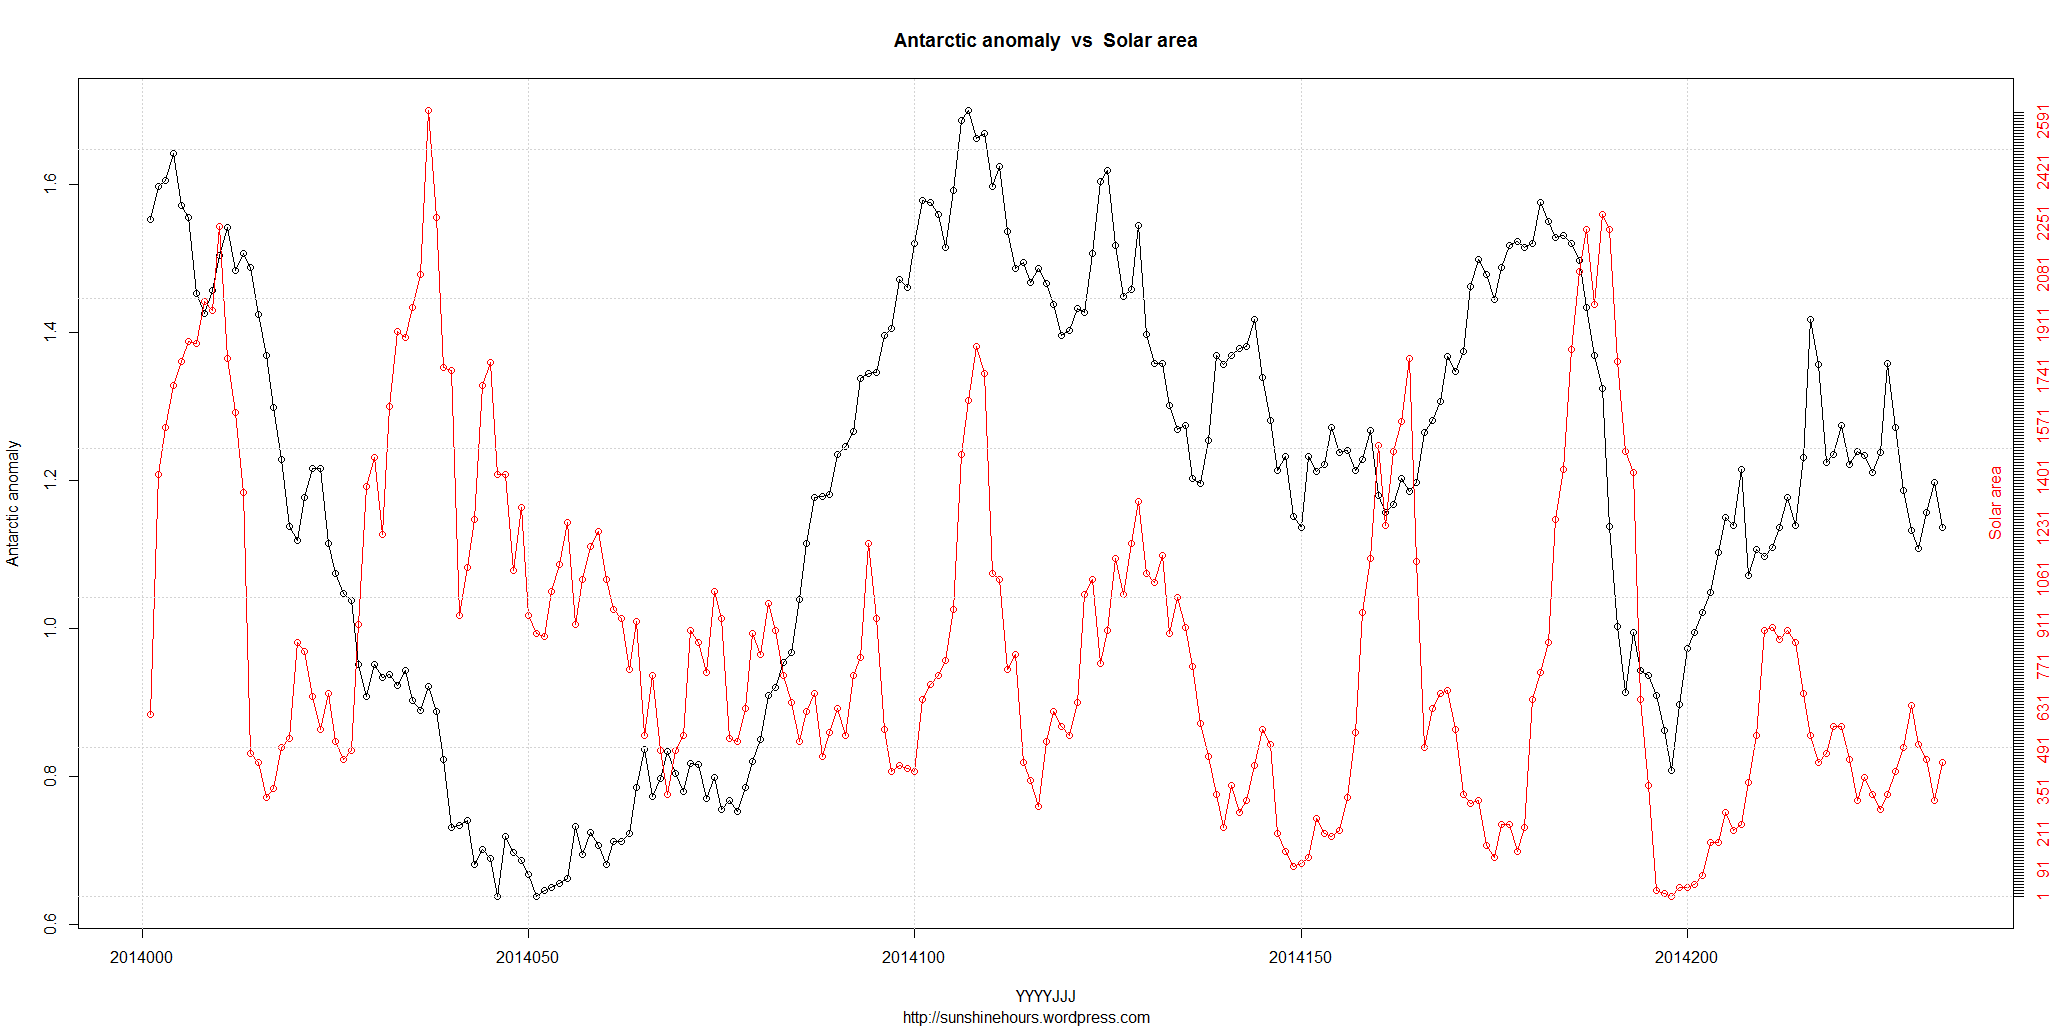
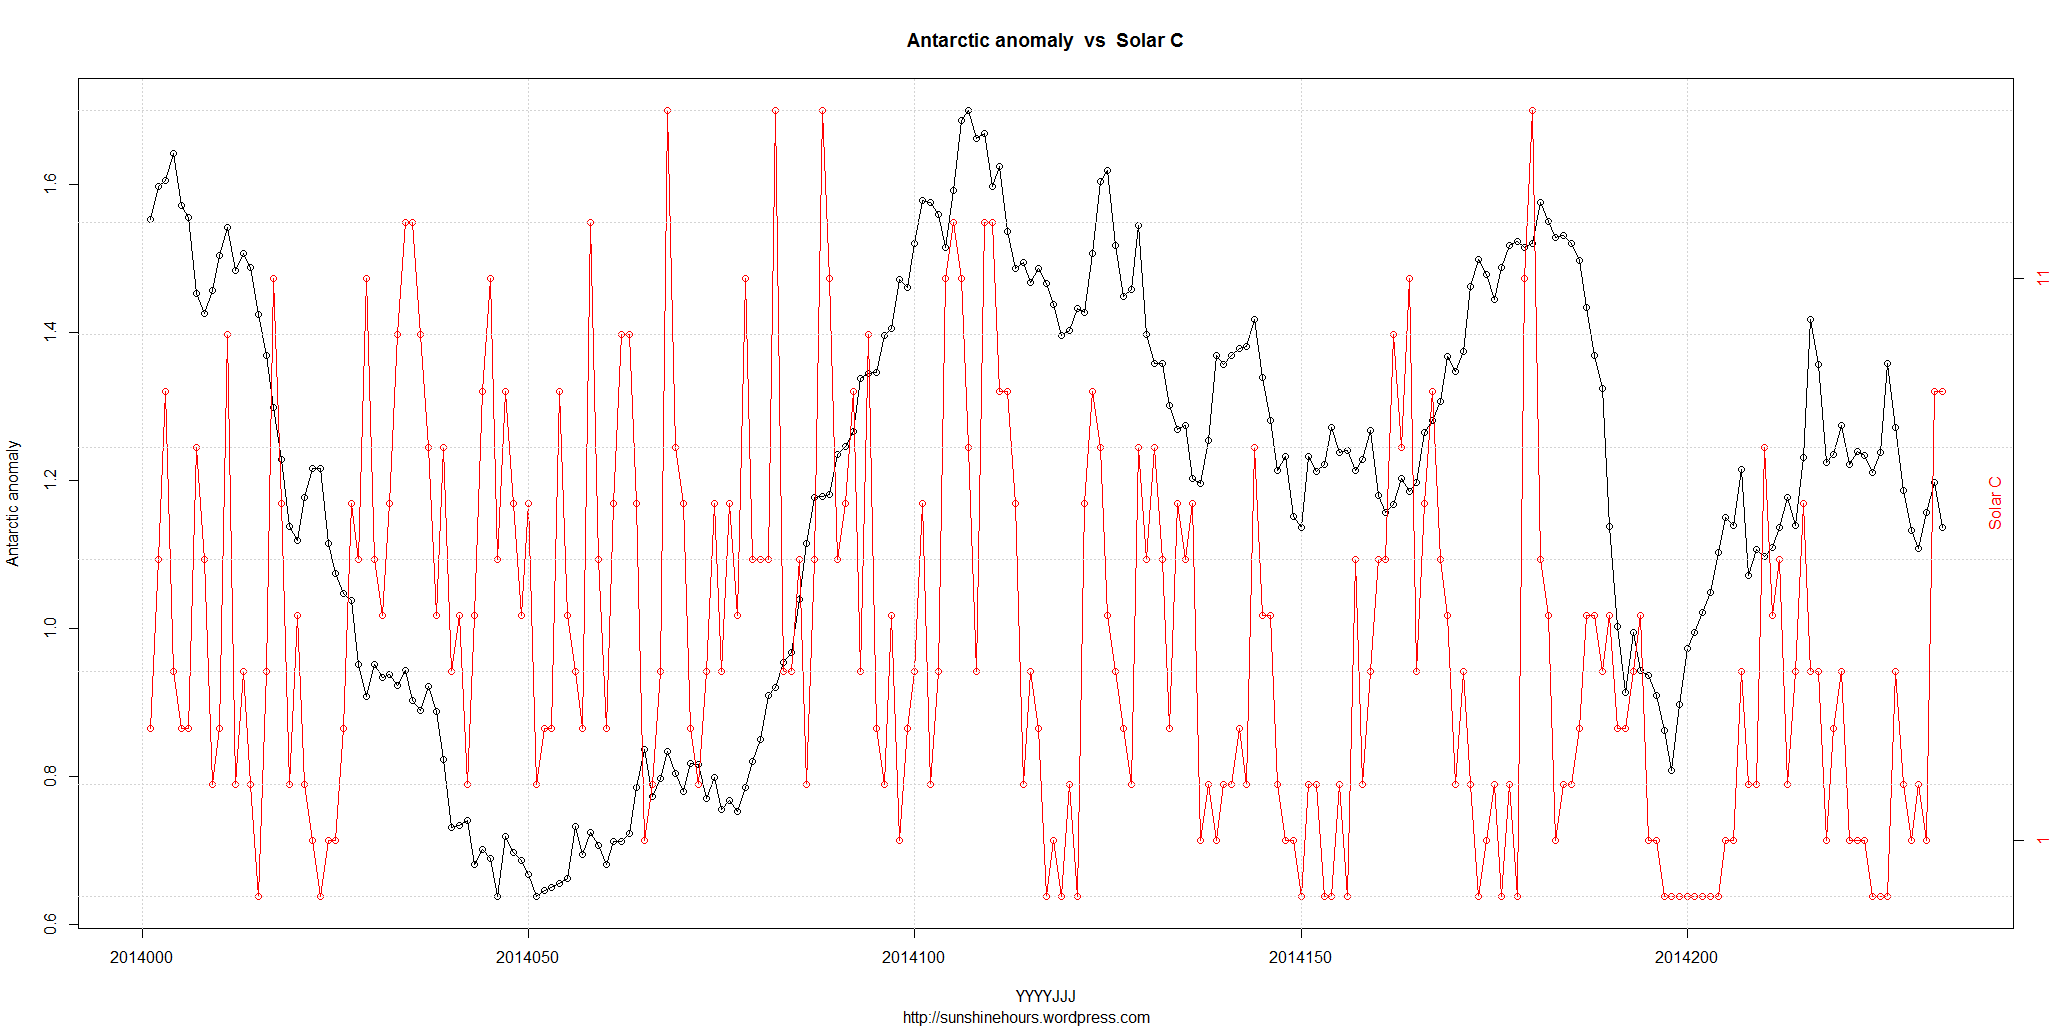
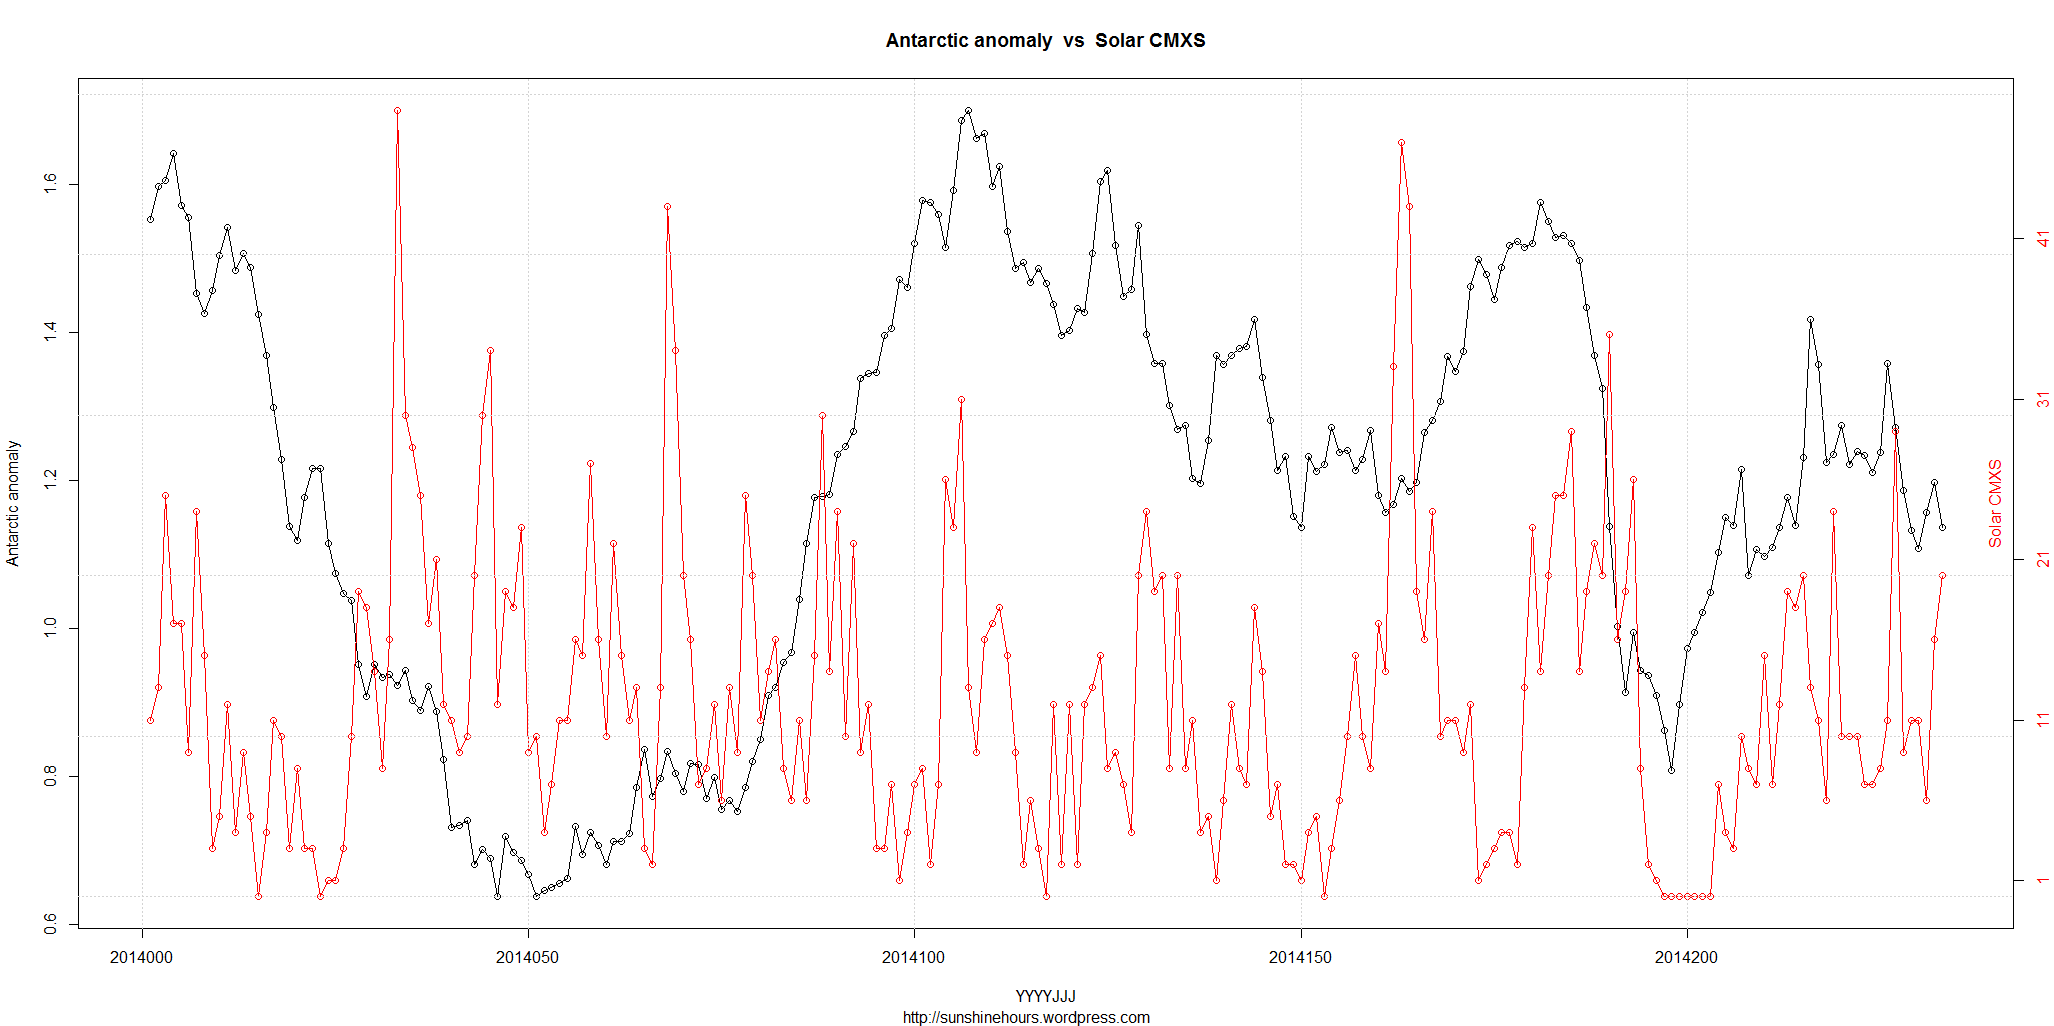
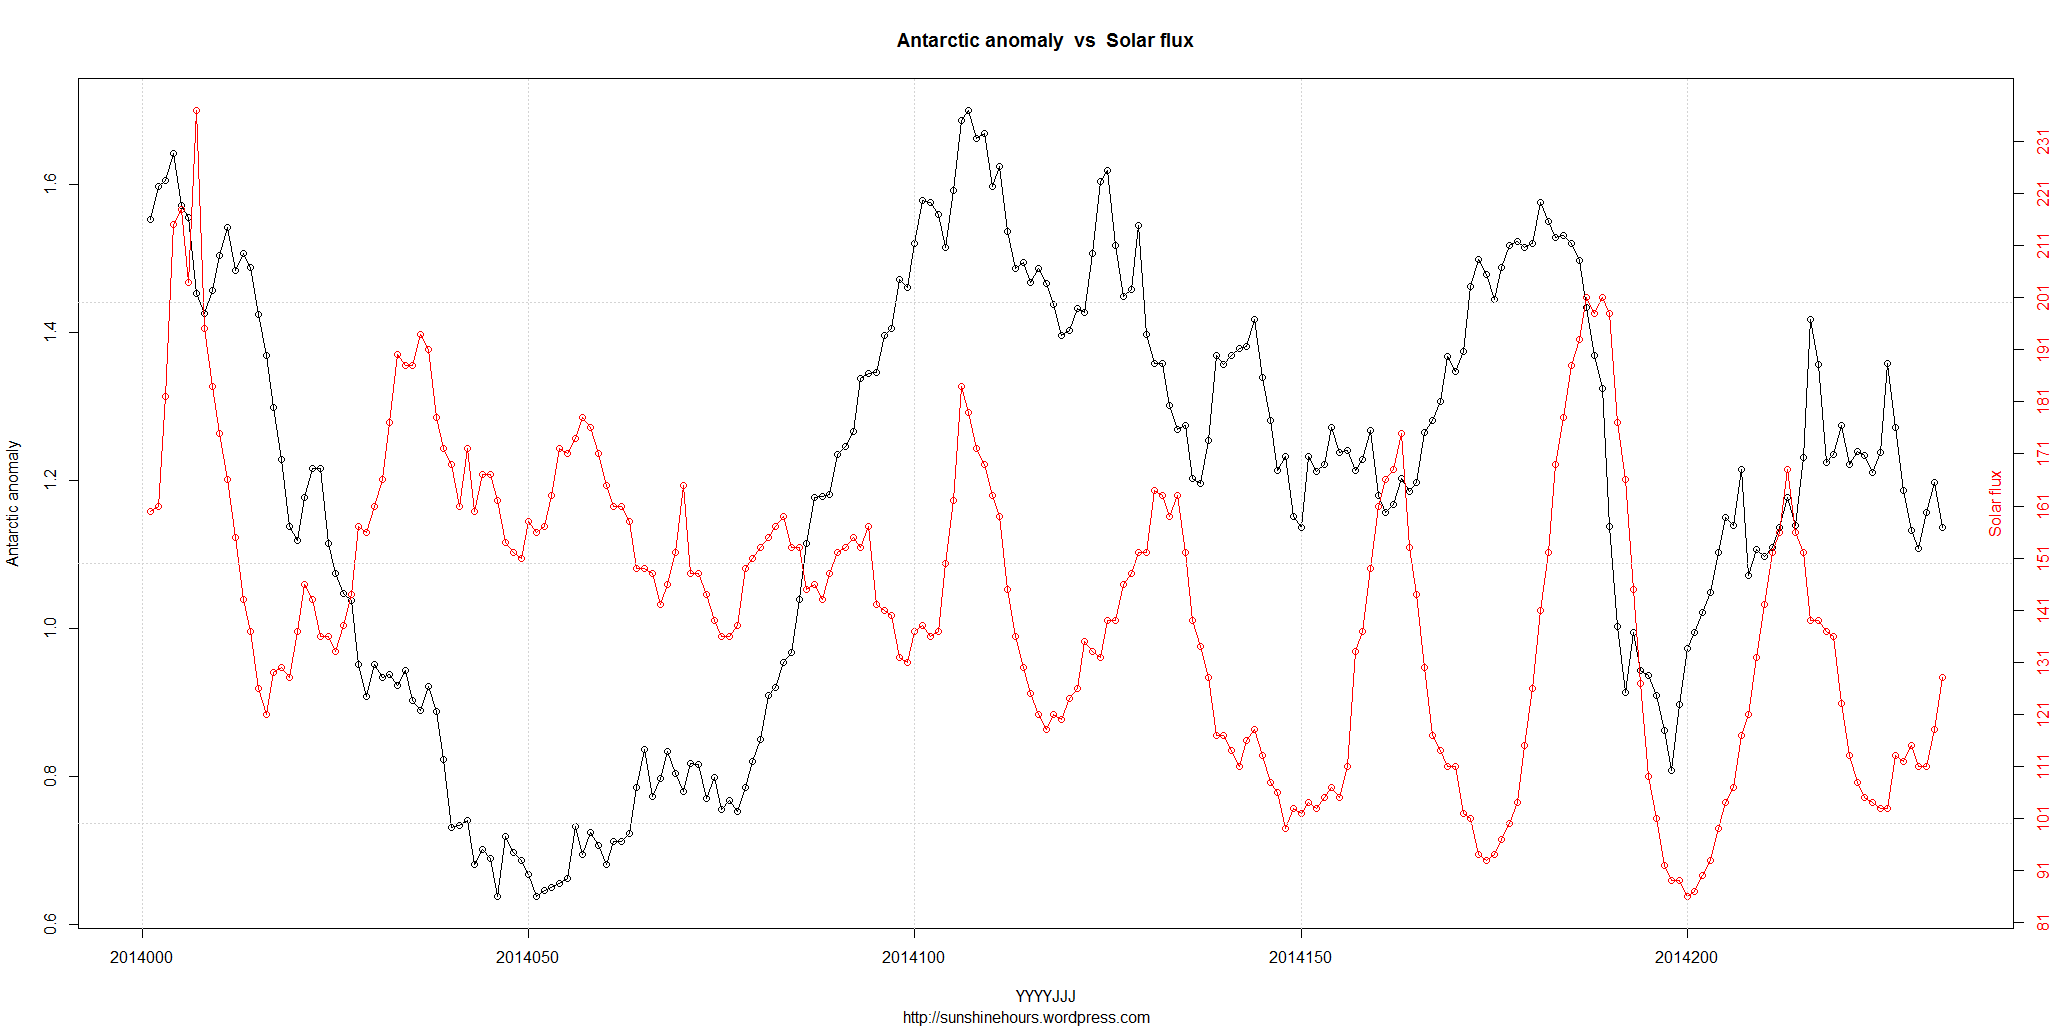
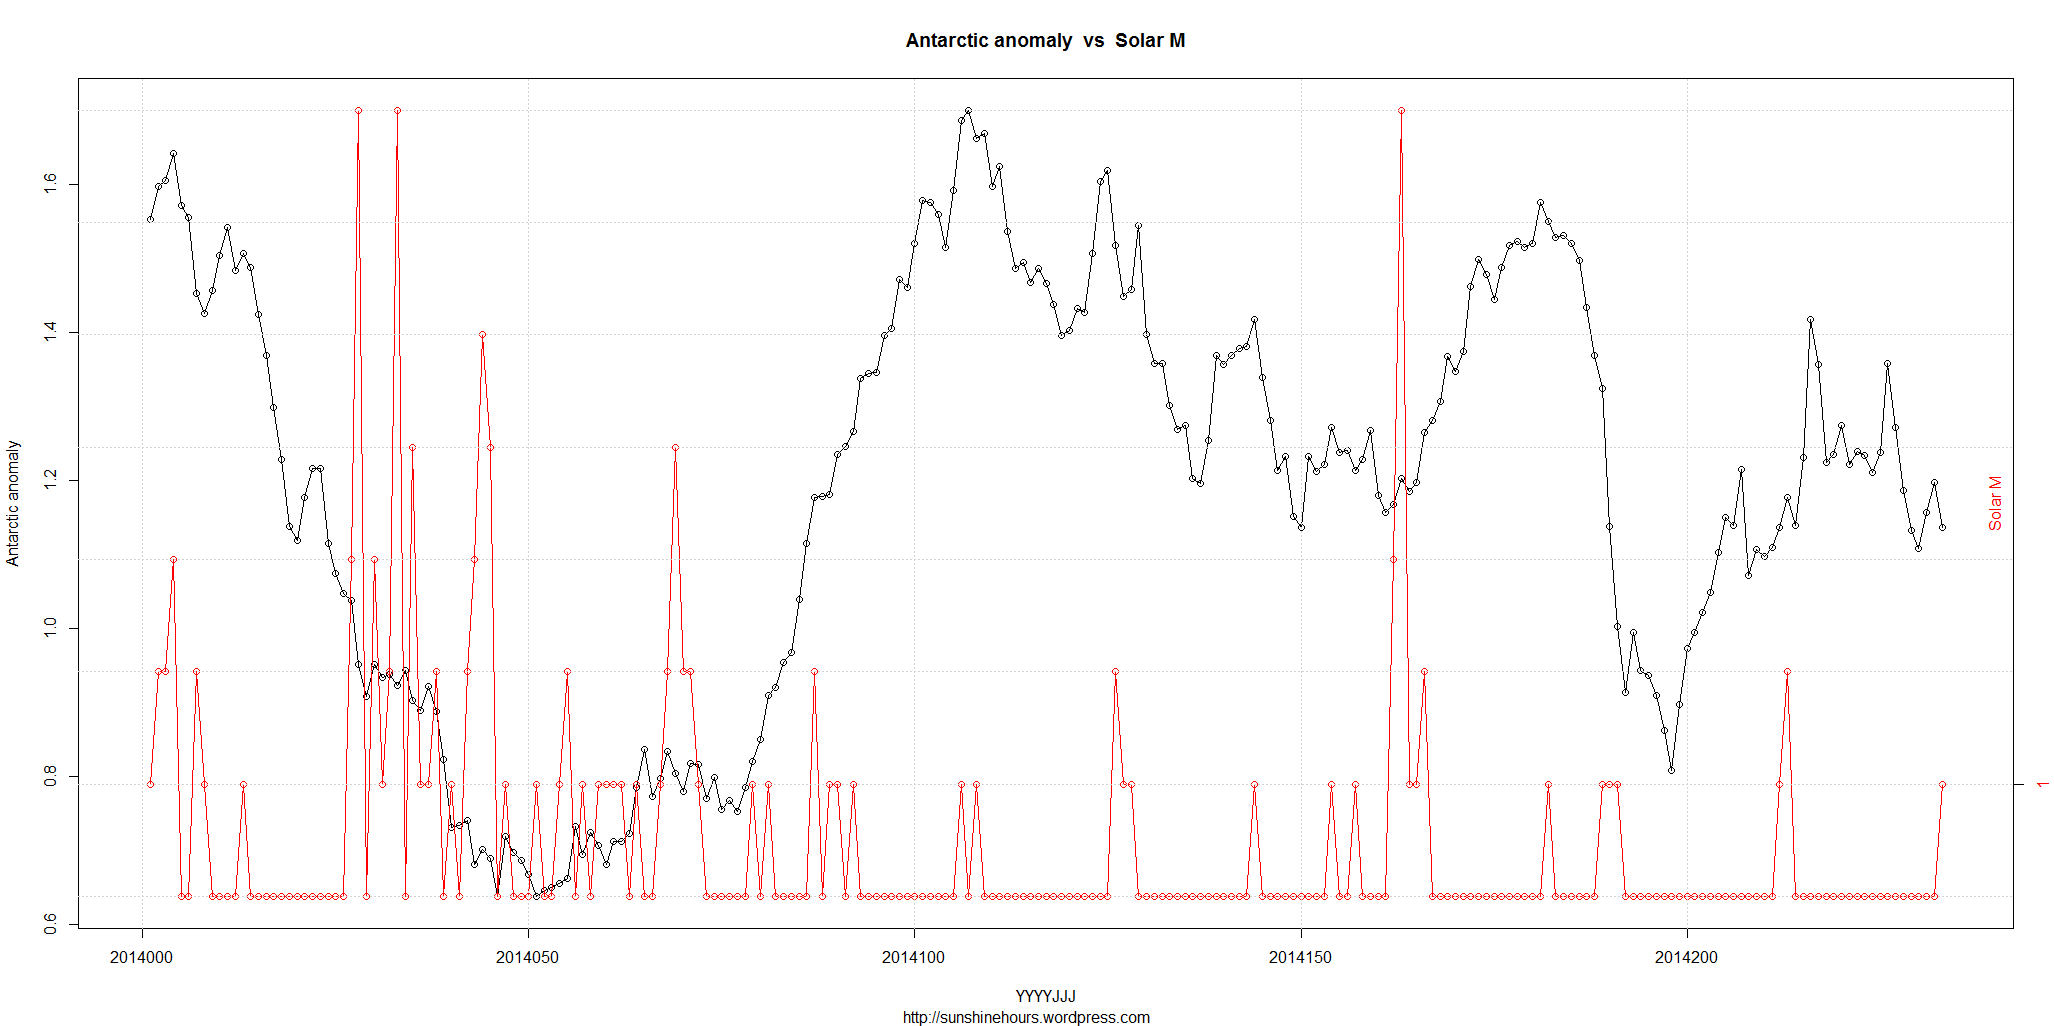
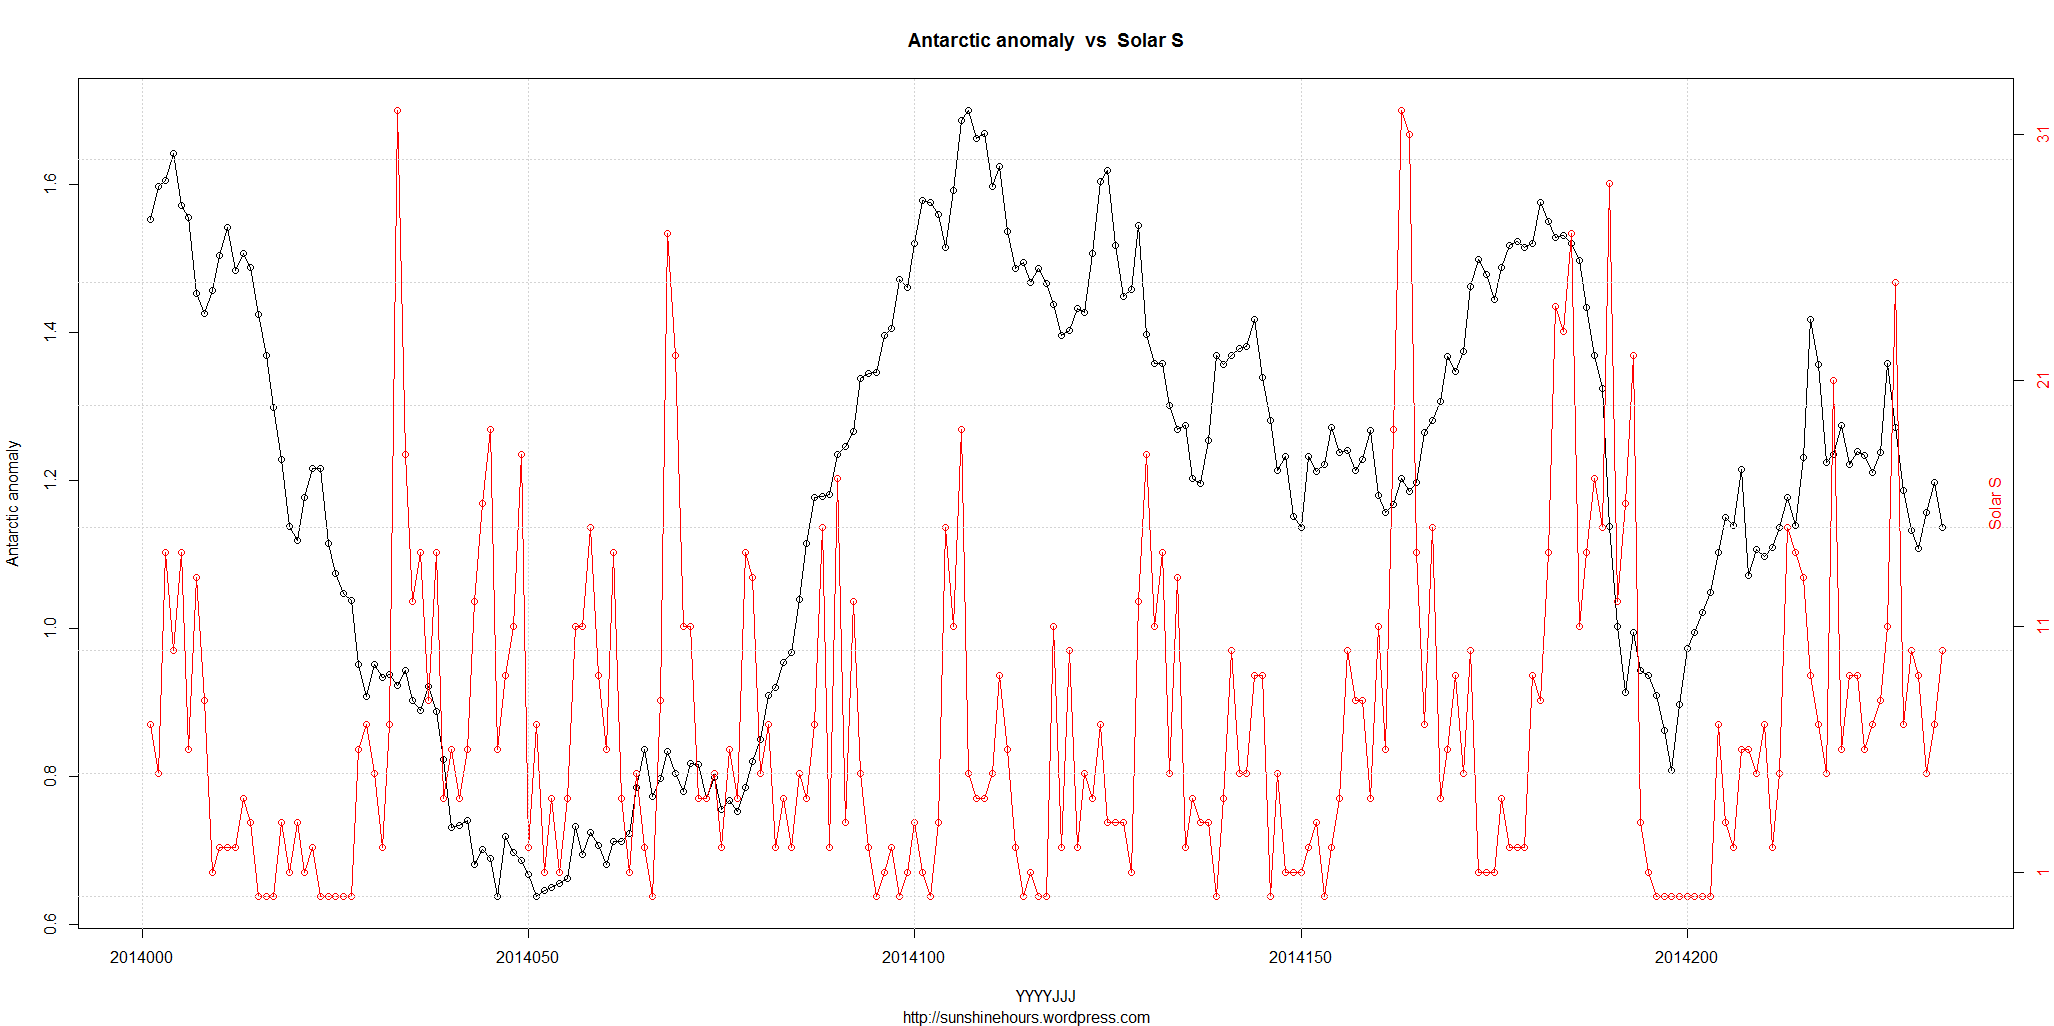
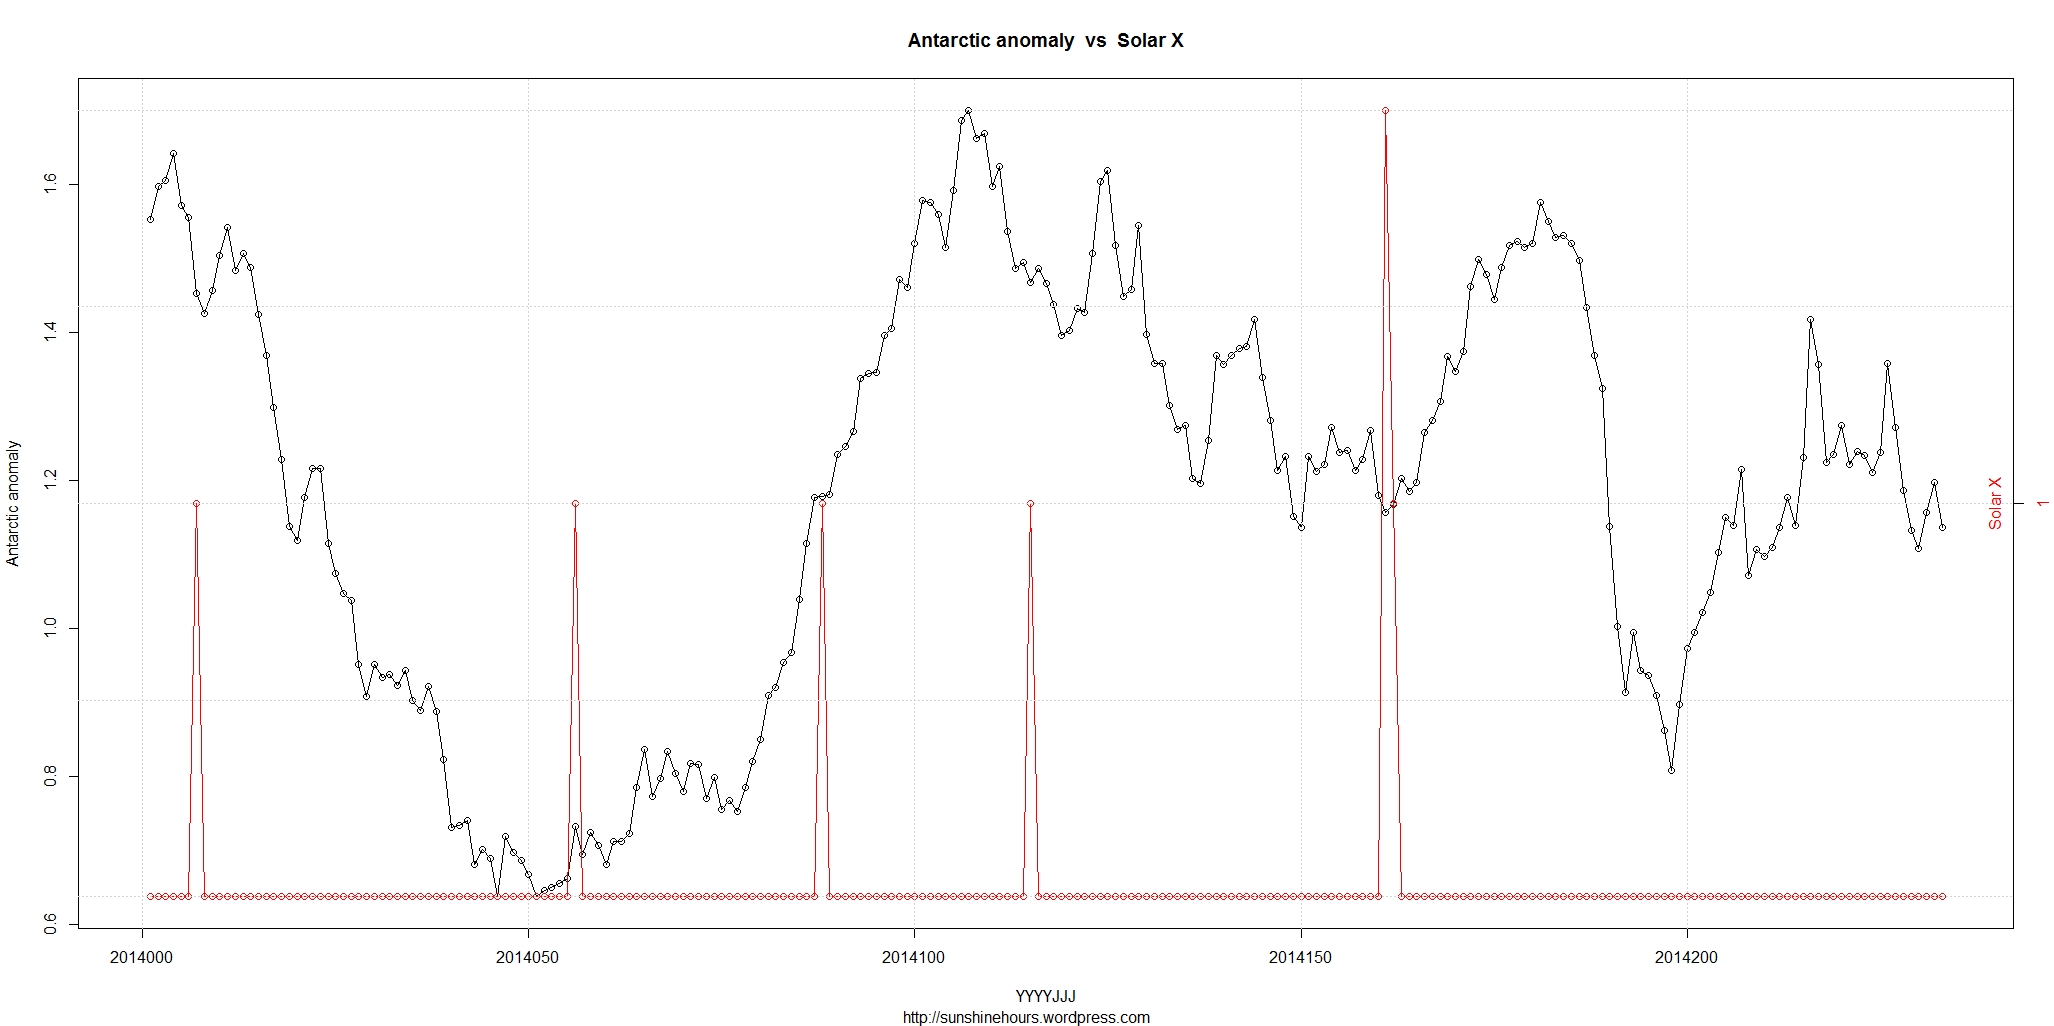
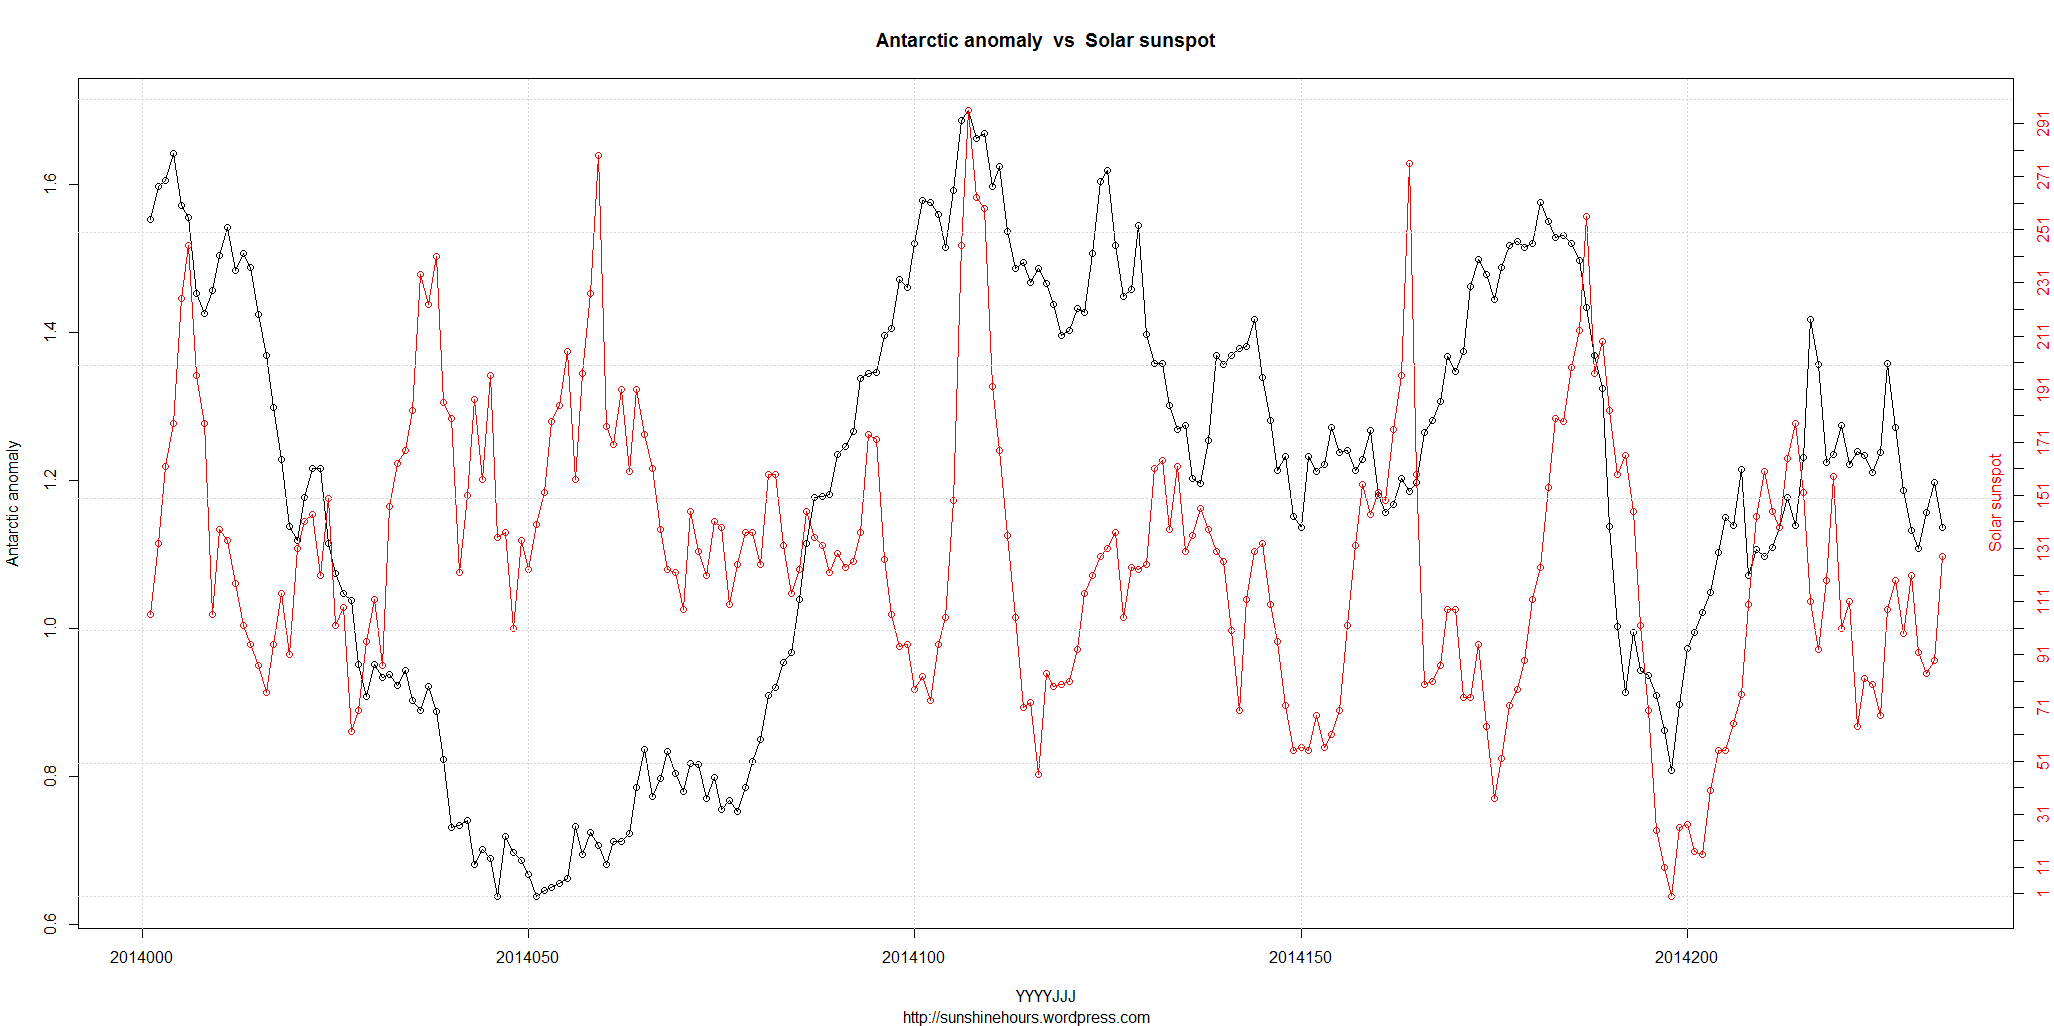
Solar data from here. I graphed the highlighted items.
#                Quarterly Daily Solar Data
#
#                         Sunspot       Stanford GOES15
#           Radio  SESC     Area          Solar  X-Ray  ------ Flares ------
#           Flux  Sunspot  10E-6   New     Mean  Bkgd    X-Ray      Optical
#  Date     10.7cm Number  Hemis. Regions Field  Flux   C  M  X  S  1  2  3
#---------------------------------------------------------------------------
2014 07 01  152    154      850      1    -999   B9.6   5  1  0 14  1  0  0
Anomaly means the difference from 1981-2010 average. CMXS just means the number of C,M,X and S class flares added together.
Discuss.
* NOTE: The Antarctic data from NSIDC has a Missing column that is usually 0. Today it is 0.00054. So Global Sea Ice will be affected,
Global Sea Ice Extent Aug 22 2014 – 21,000 sq km above the 1981-2010 mean. Data for Day 233. Data here.


* NOTE: The data from NSIDC has a Missing column that is usually 0. Today it is 0.00054.
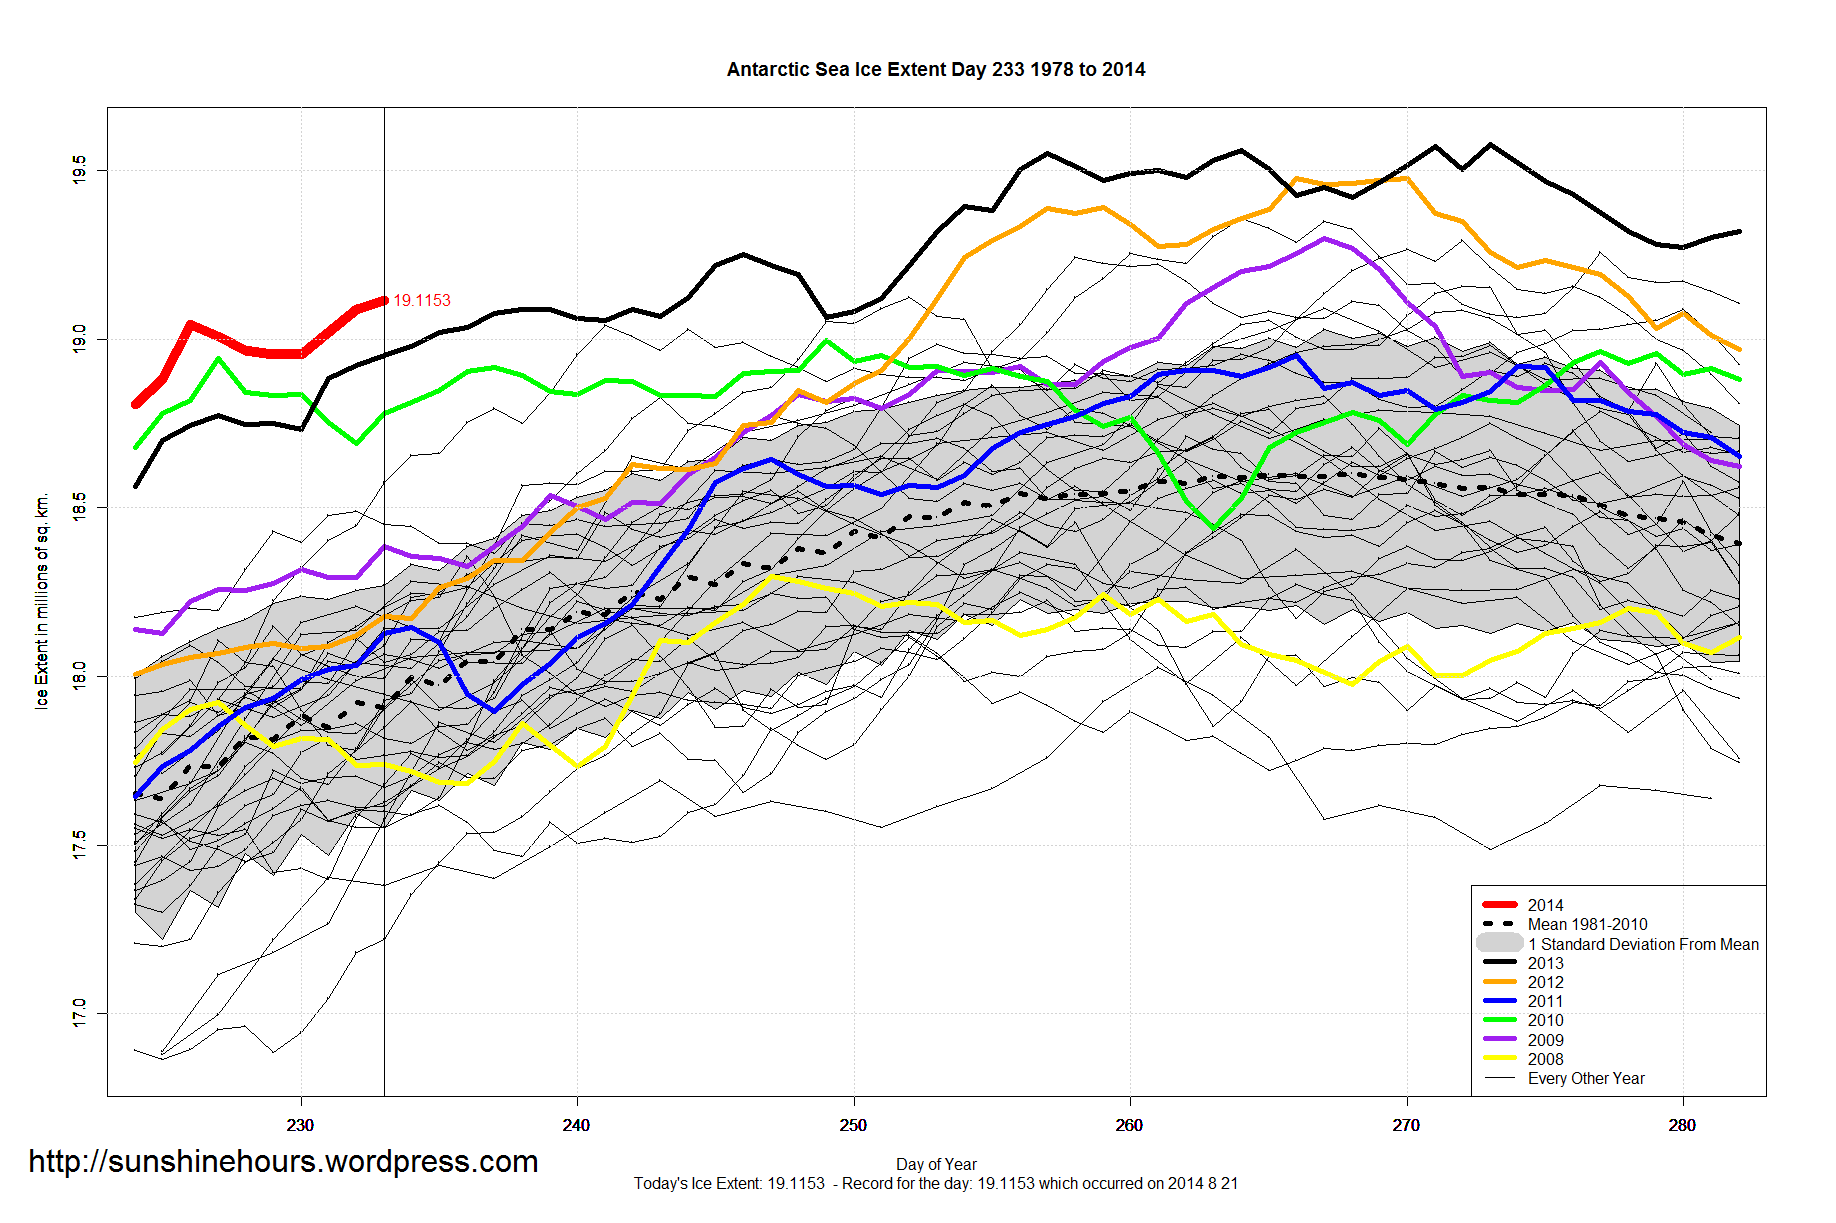
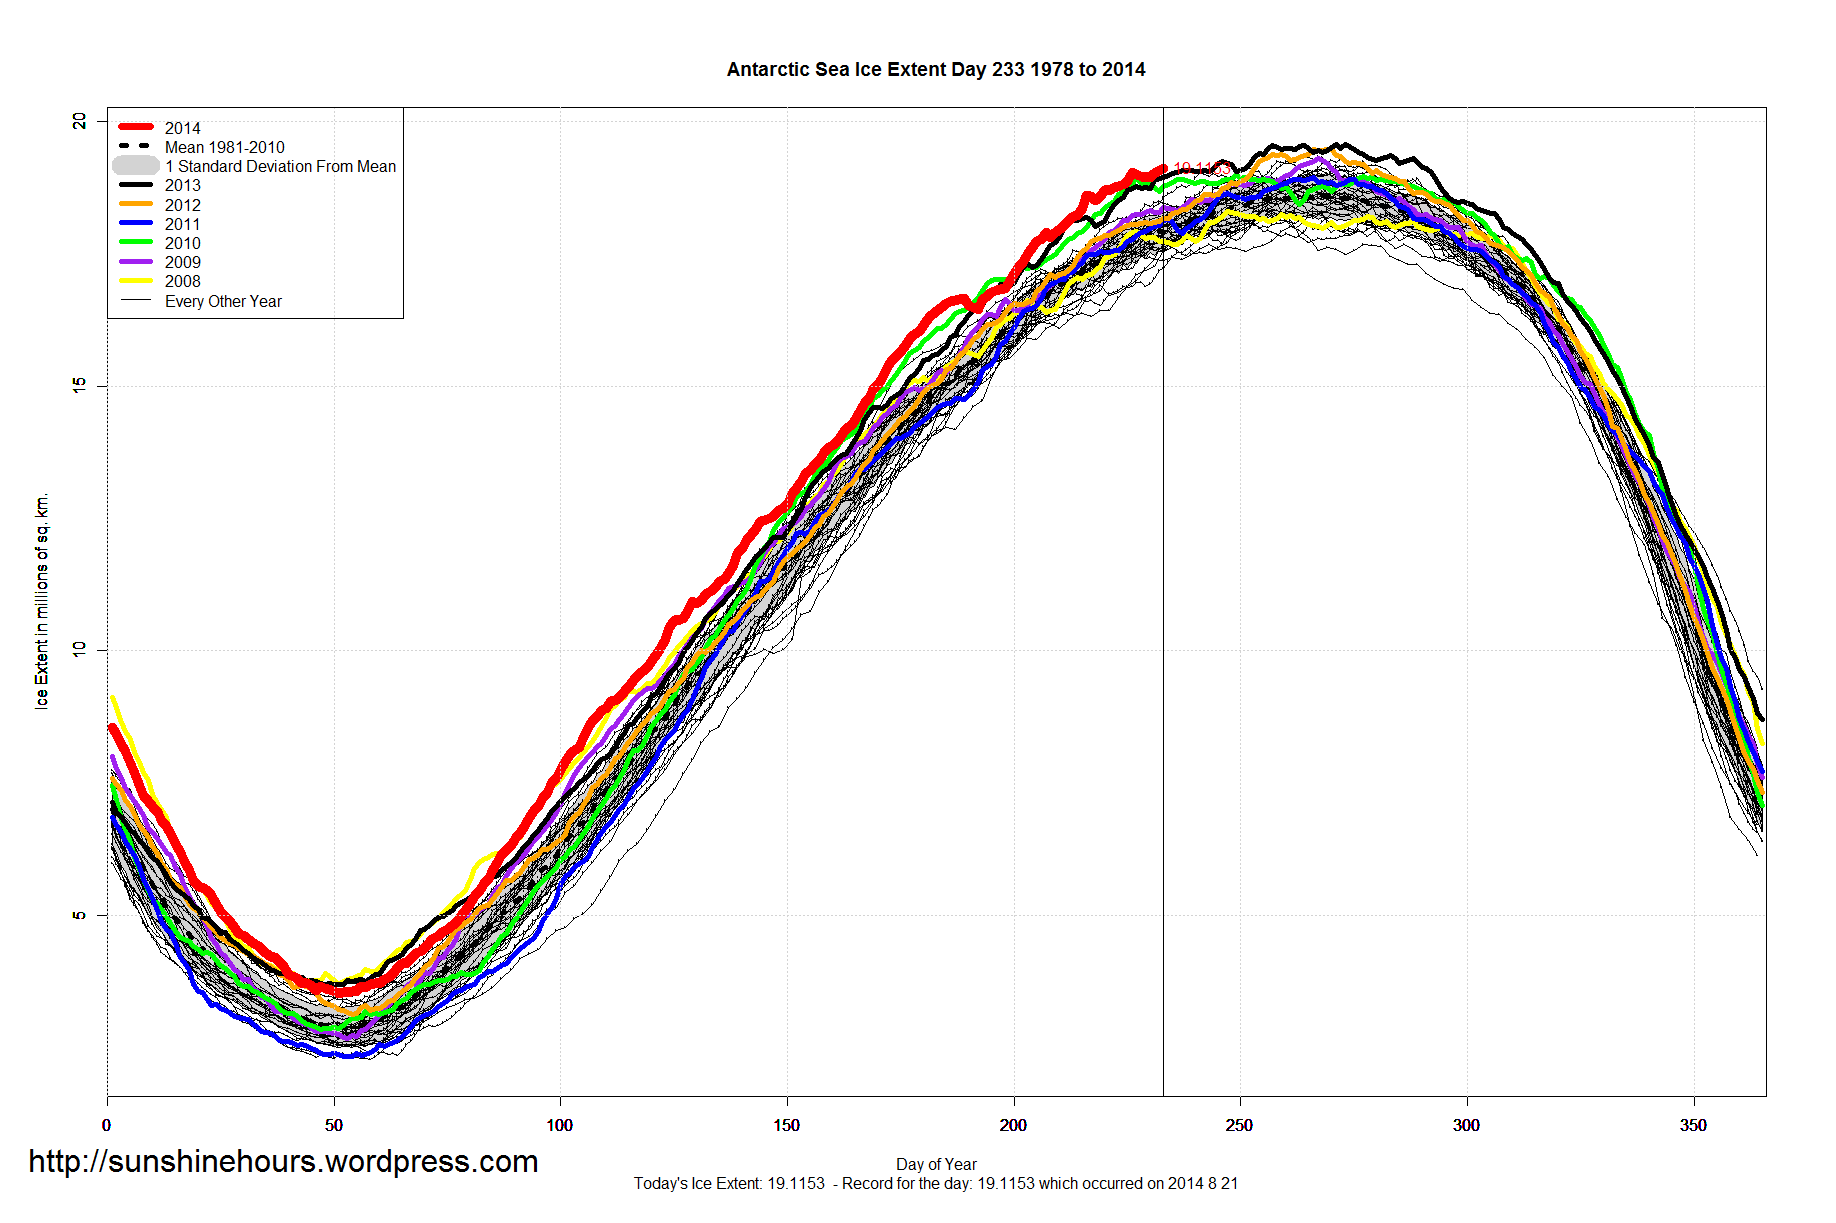
Antarctic Sea Ice Extent Aug 22 2014 – 1,136,000 sq km above the 1981-2010 mean. Data for Day 233. Data here.


