Antarctic Sea Ice Extent Aug 21 2014 – 1,135,000 sq km above the 1981-2010 mean. Data for Day 232. Data here.
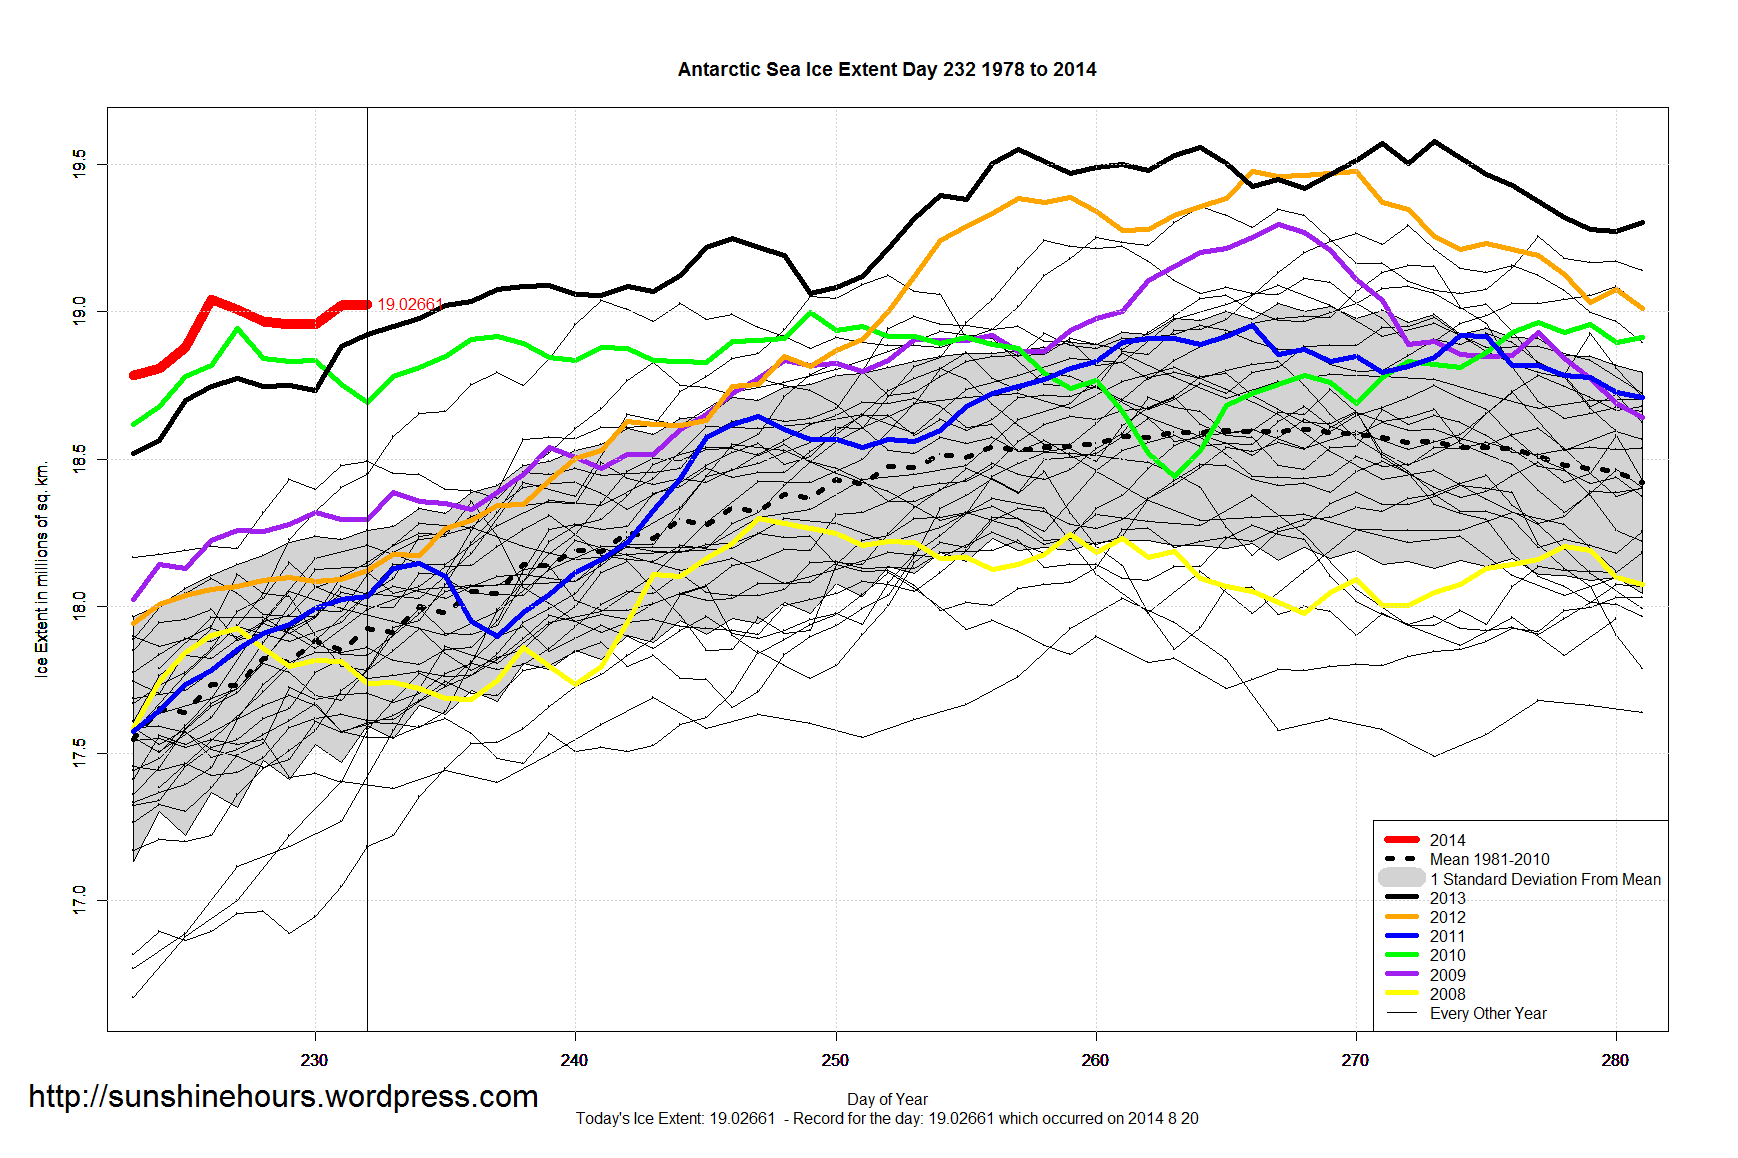

Antarctic Sea Ice Extent Aug 21 2014 – 1,135,000 sq km above the 1981-2010 mean. Data for Day 232. Data here.
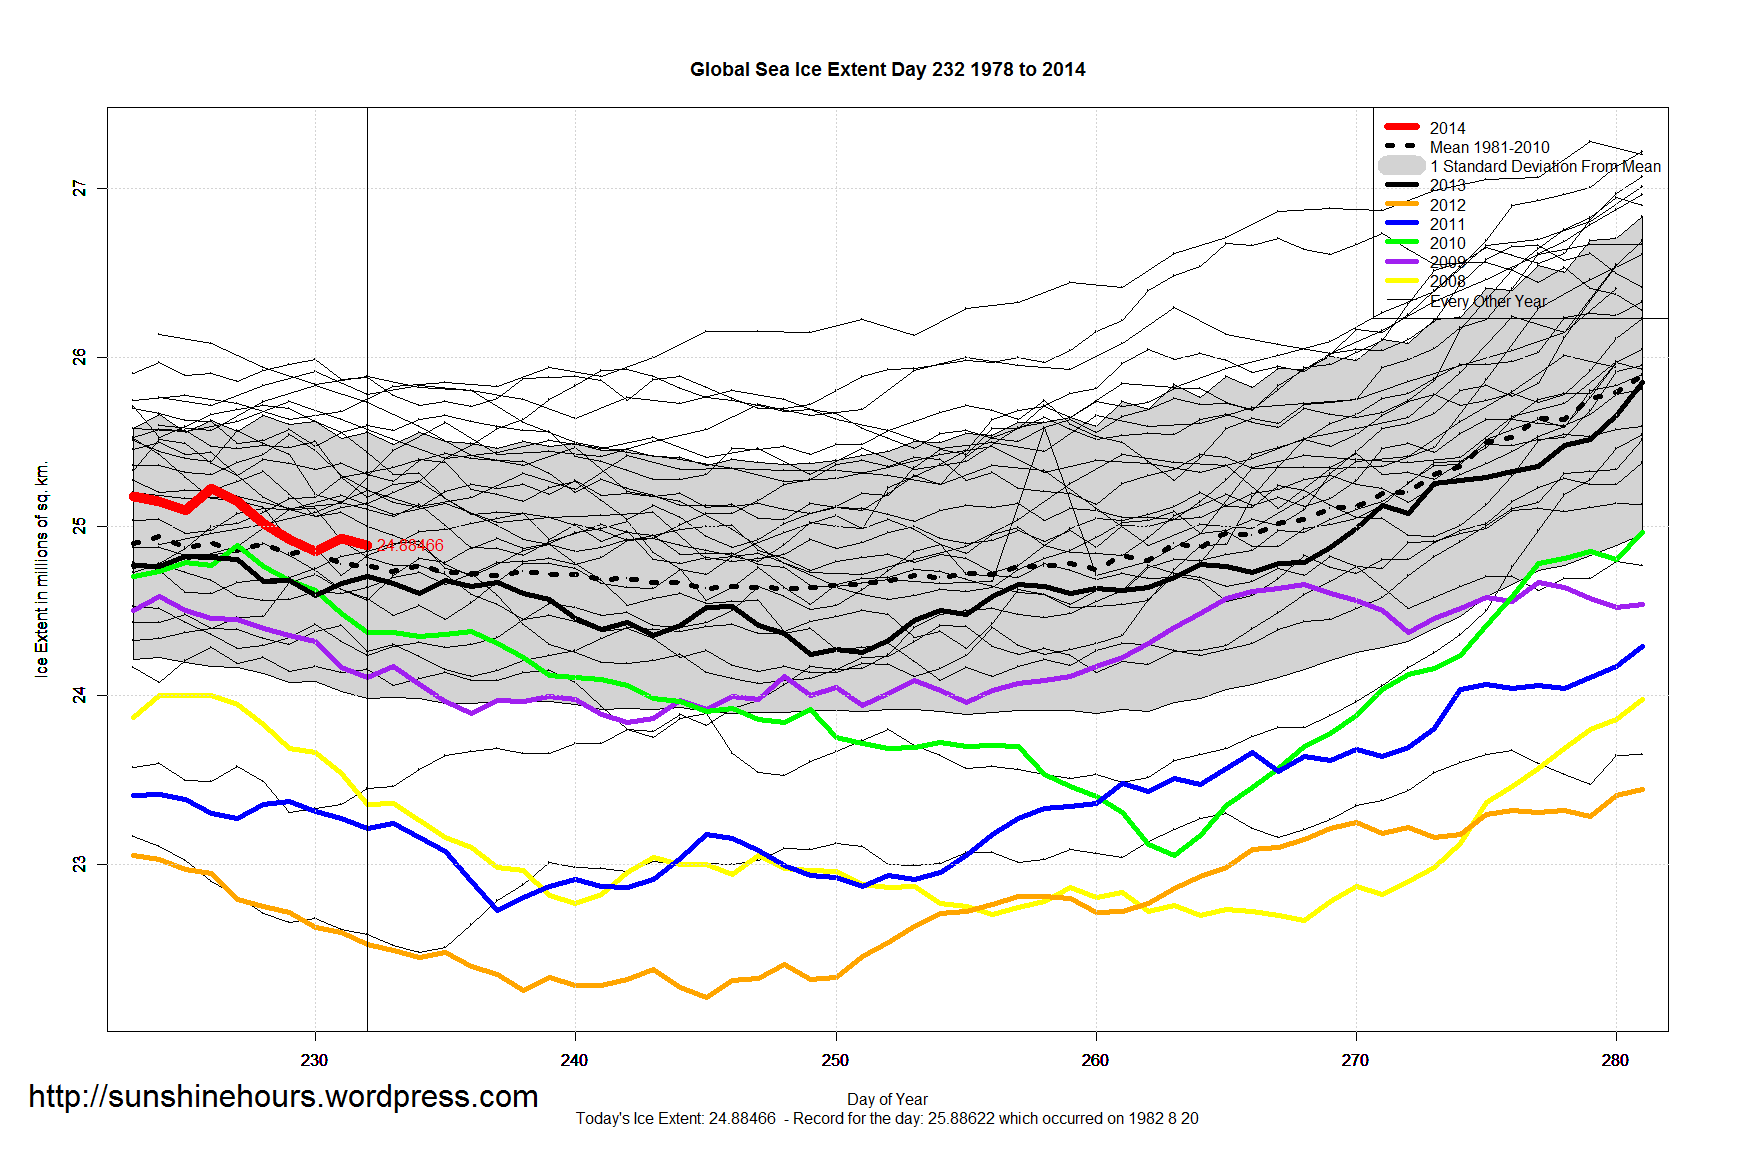
Global Sea Ice Extent Aug 21 2014 – 59,000 sq km above the 1981-2010 mean. Data for Day 232. Data here.

Global Sea Ice Extent Aug 20 2014 – 72,000 sq km above the 1981-2010 mean. Data for Day 231. Data here.


Antarctic Sea Ice Extent Aug 20 2014 – 1,156,000 sq km above the 1981-2010 mean. Data for Day 231. Data here.
I forgot to mention that 2014 was the earliest to hit 19 million sq km by 9 days on Aug 14.
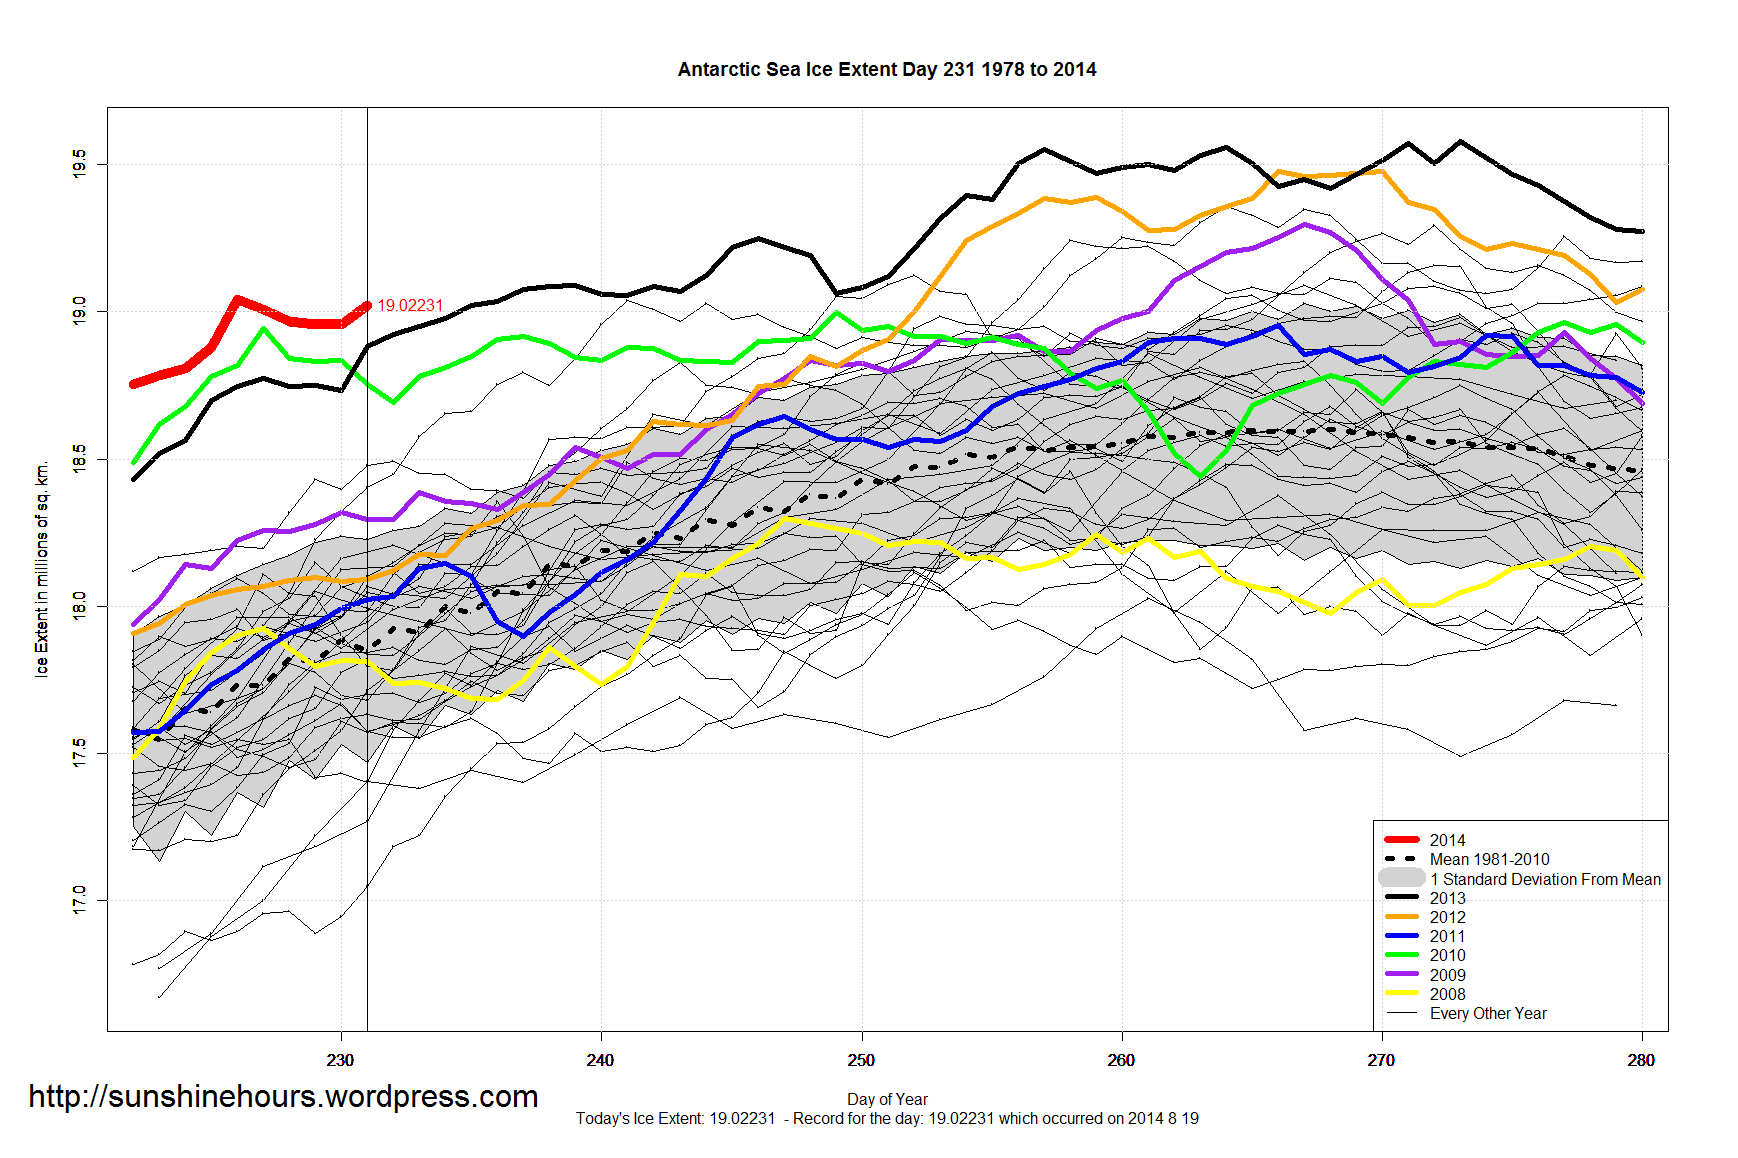

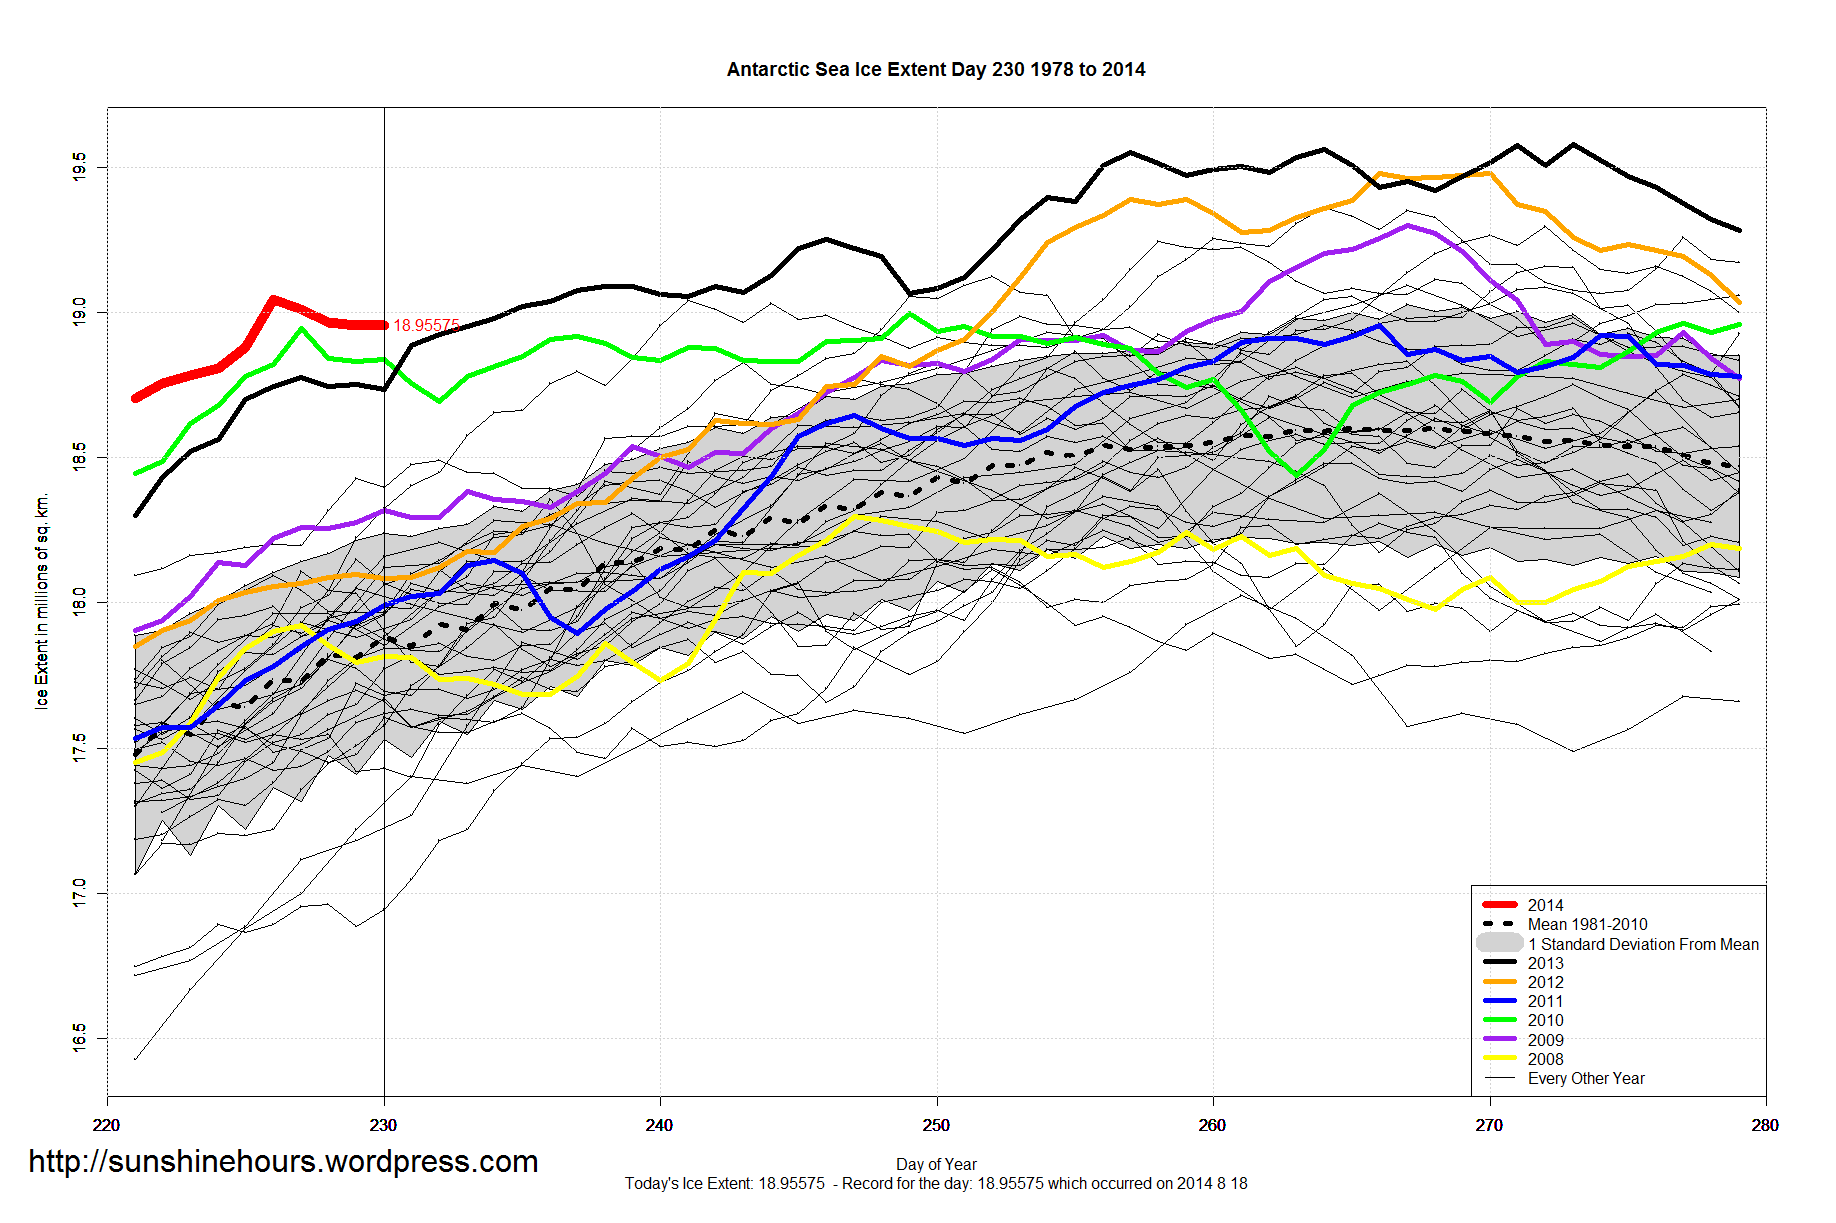
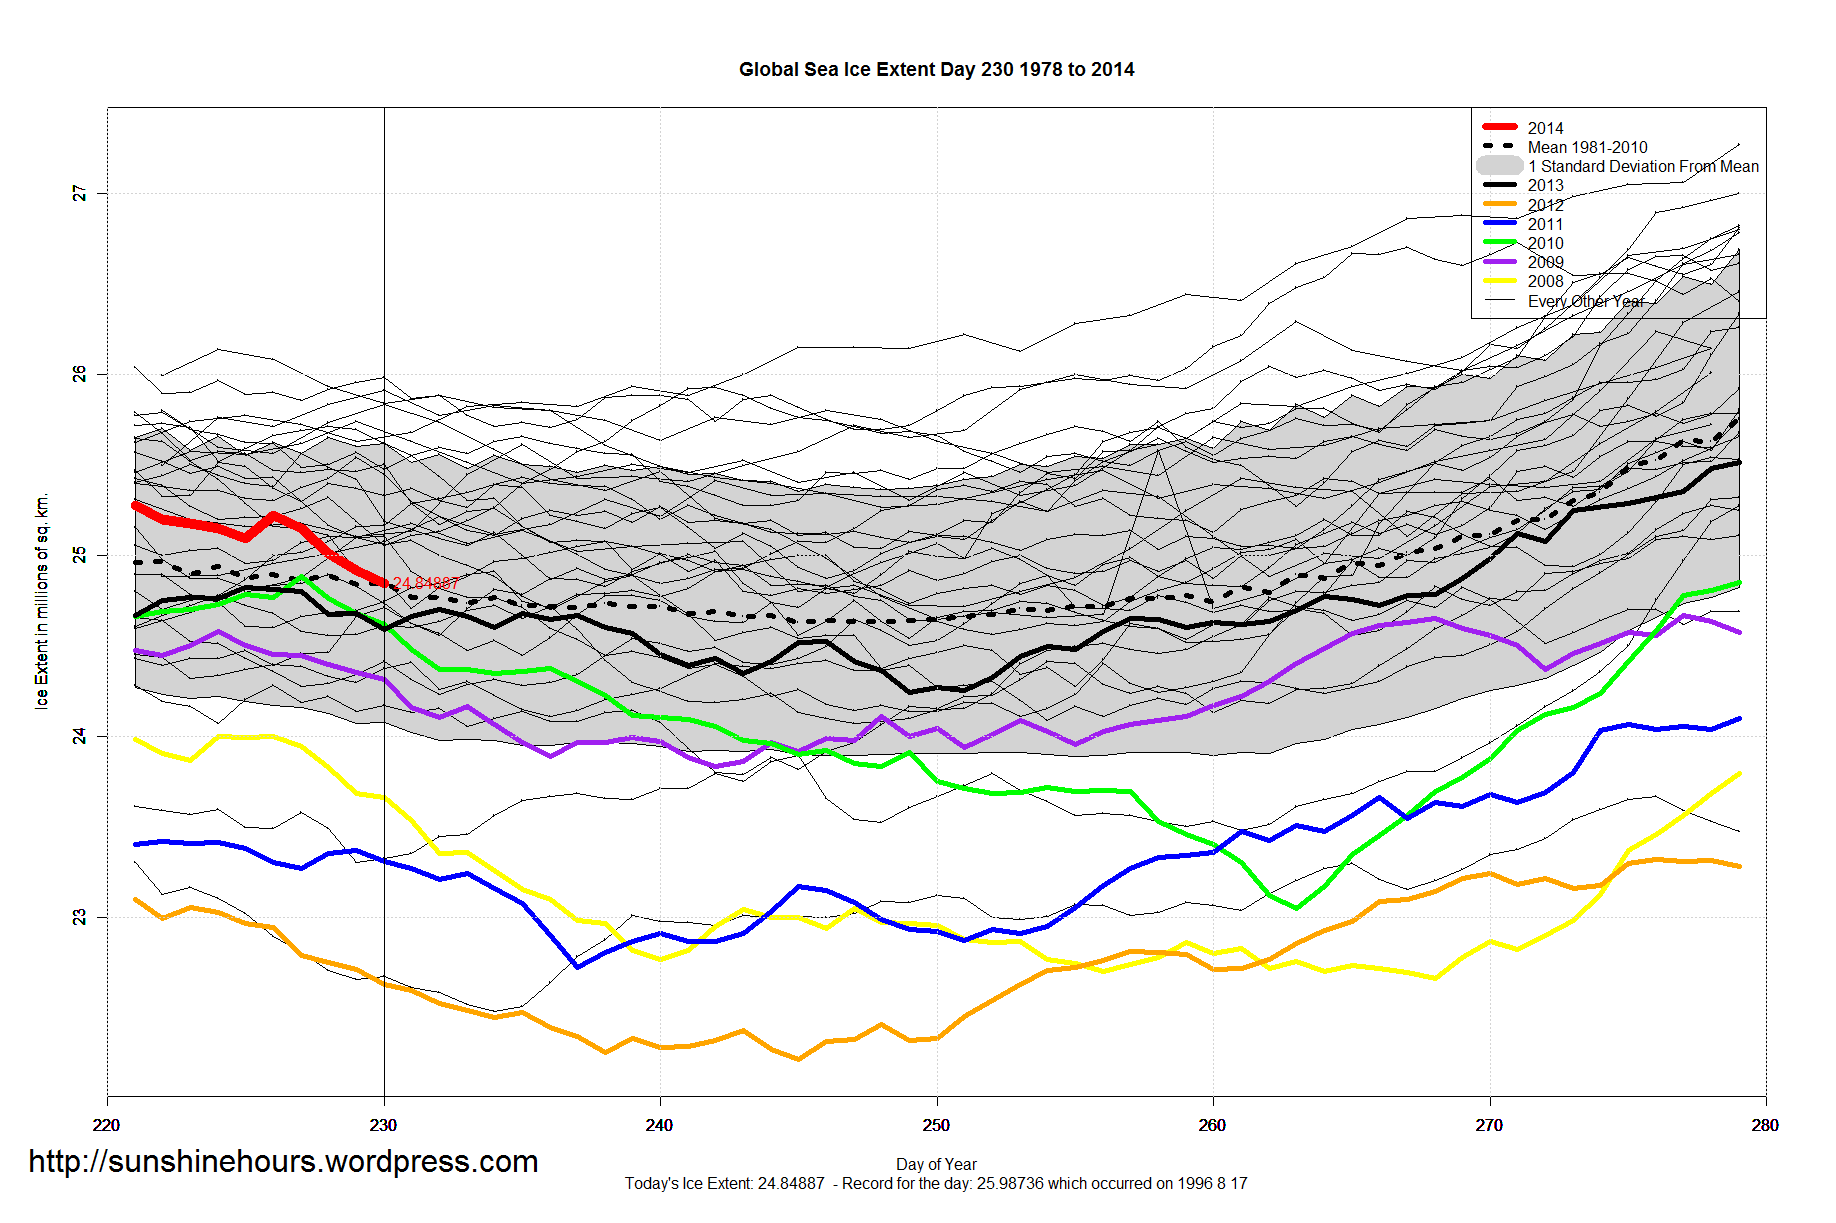
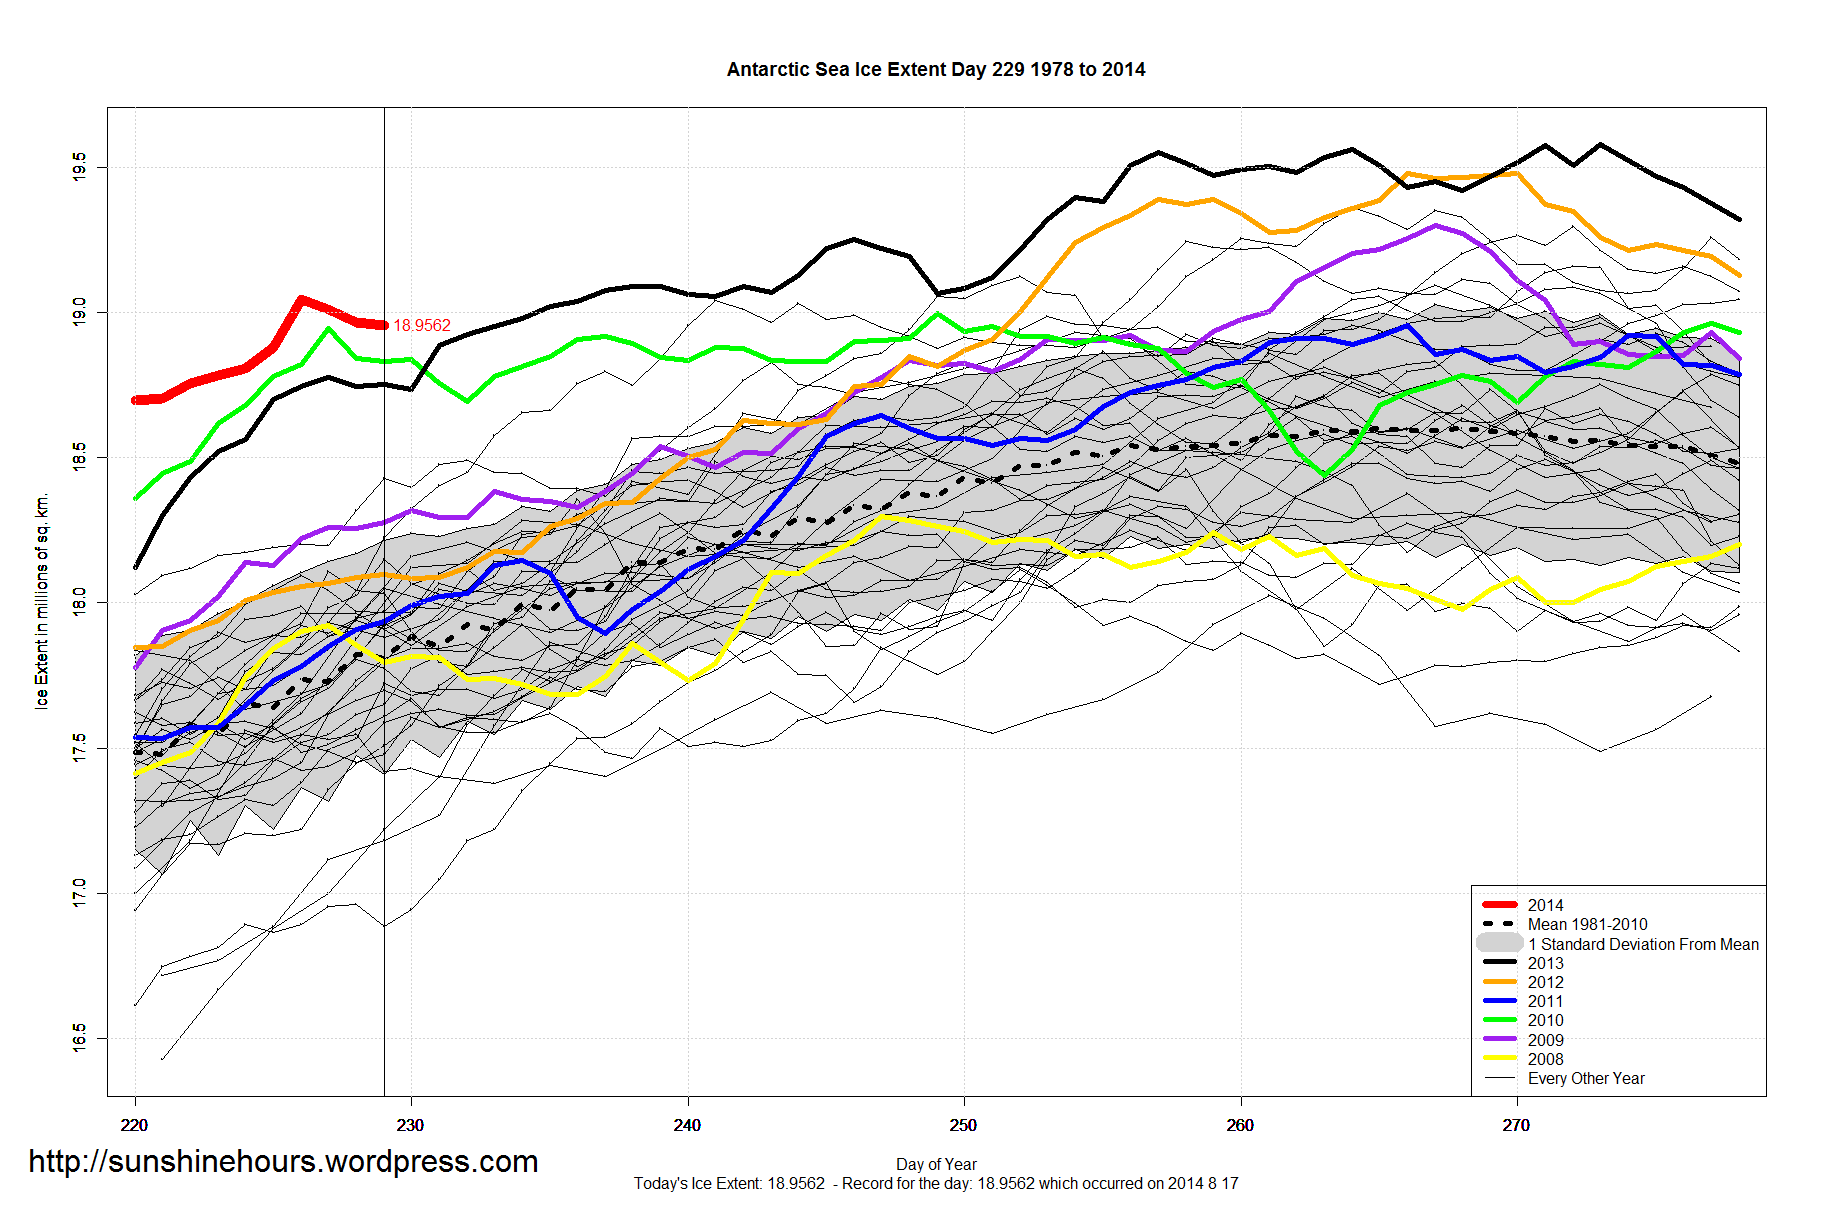
Antarctic Sea Ice Extent Aug 19 2014 – 1,108,000 sq km above the 1981-2010 mean. Data for Day 230. Data here.
Not sure … will 2014 follow the black line or the green line?

Global Sea Ice Extent Aug 19 2014 – -48,000 sq km below the 1981-2010 mean. Data for Day 230. Data here.

Antarctic Sea Ice Extent Aug 18 2014 – 1,132,000 sq km above the 1981-2010 mean. Data for Day 229. Data here.

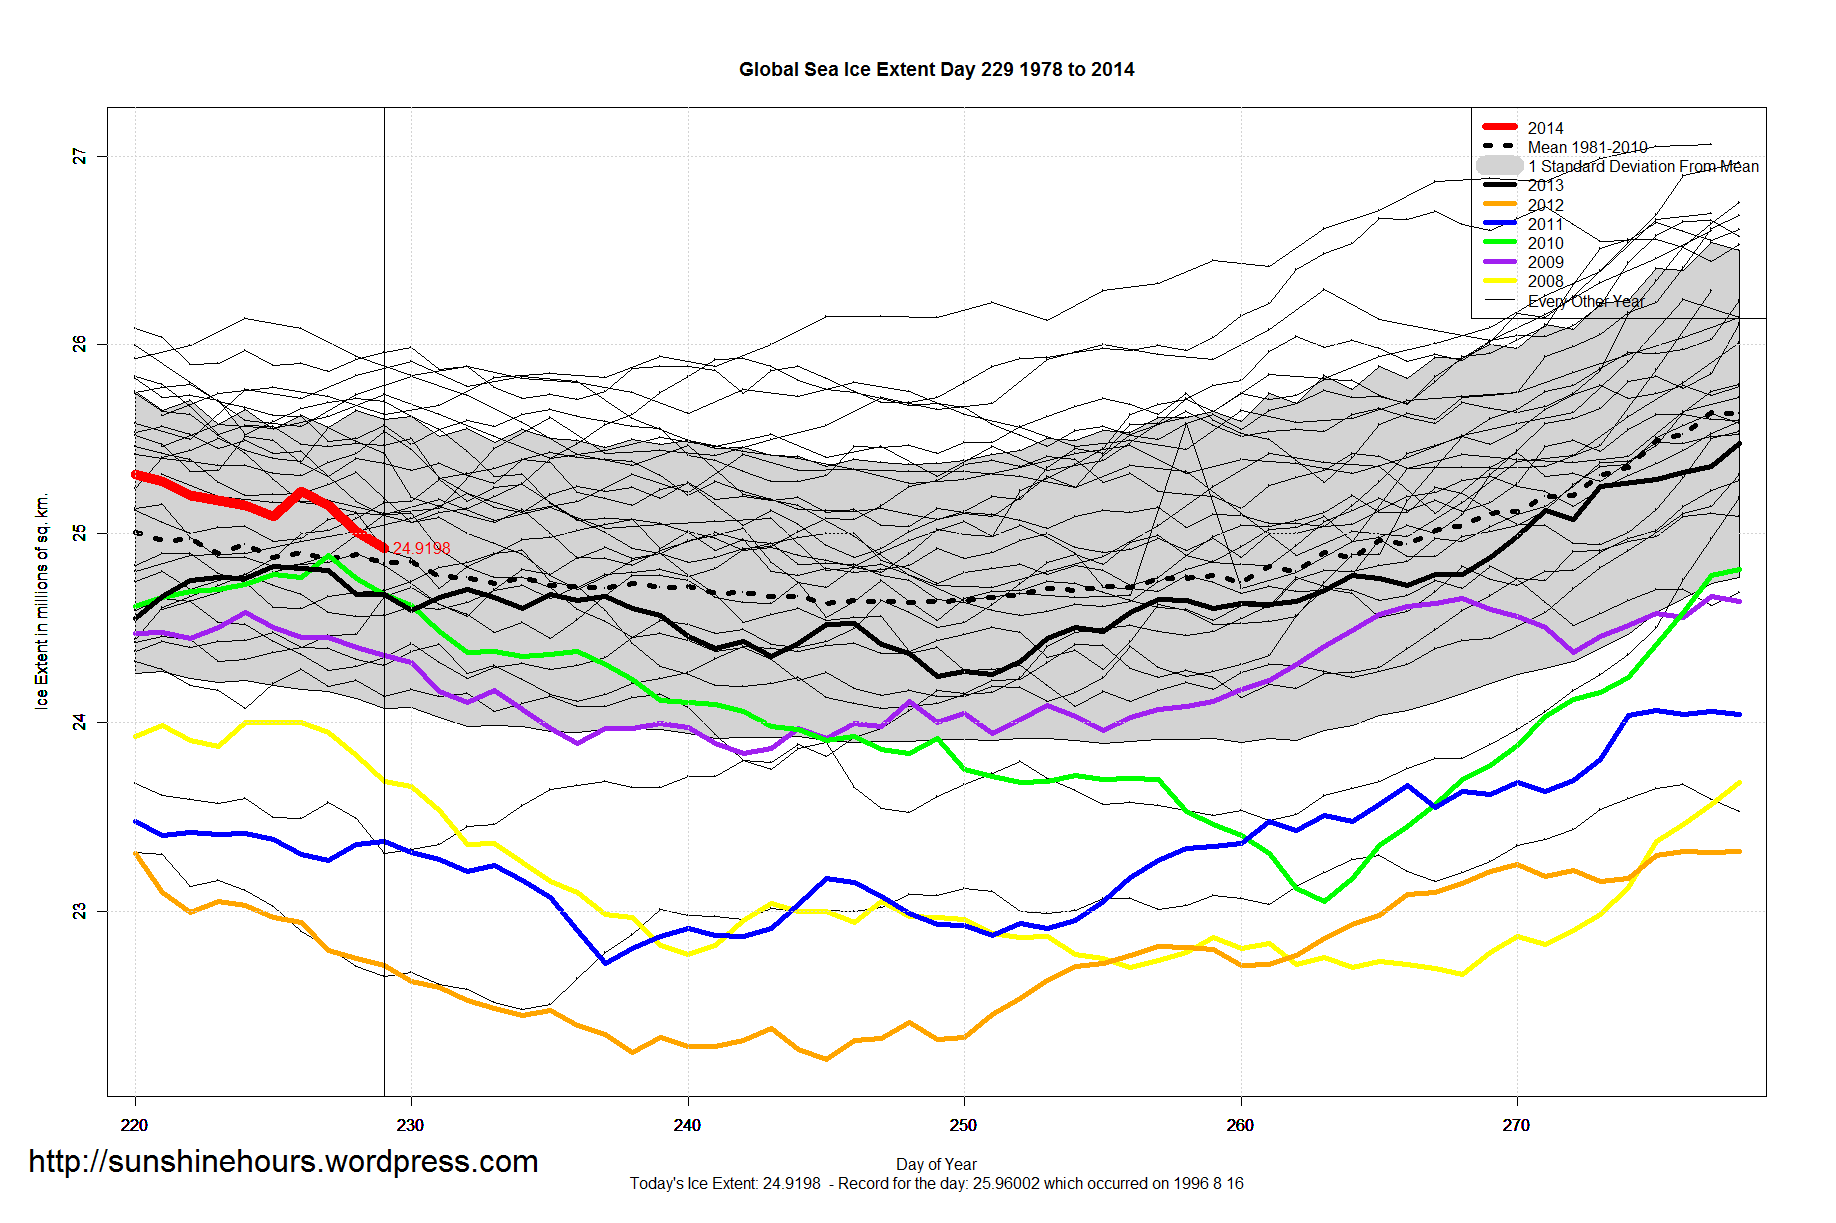
Global Sea Ice Extent Aug 18 2014 – 7,000 sq km above the 1981-2010 mean. Data for Day 229. Data here.

Antarctic Sea Ice Extent Aug 17 2014 – 1,186,000 sq km above the 1981-2010 mean. Data for Day 228. Data here.
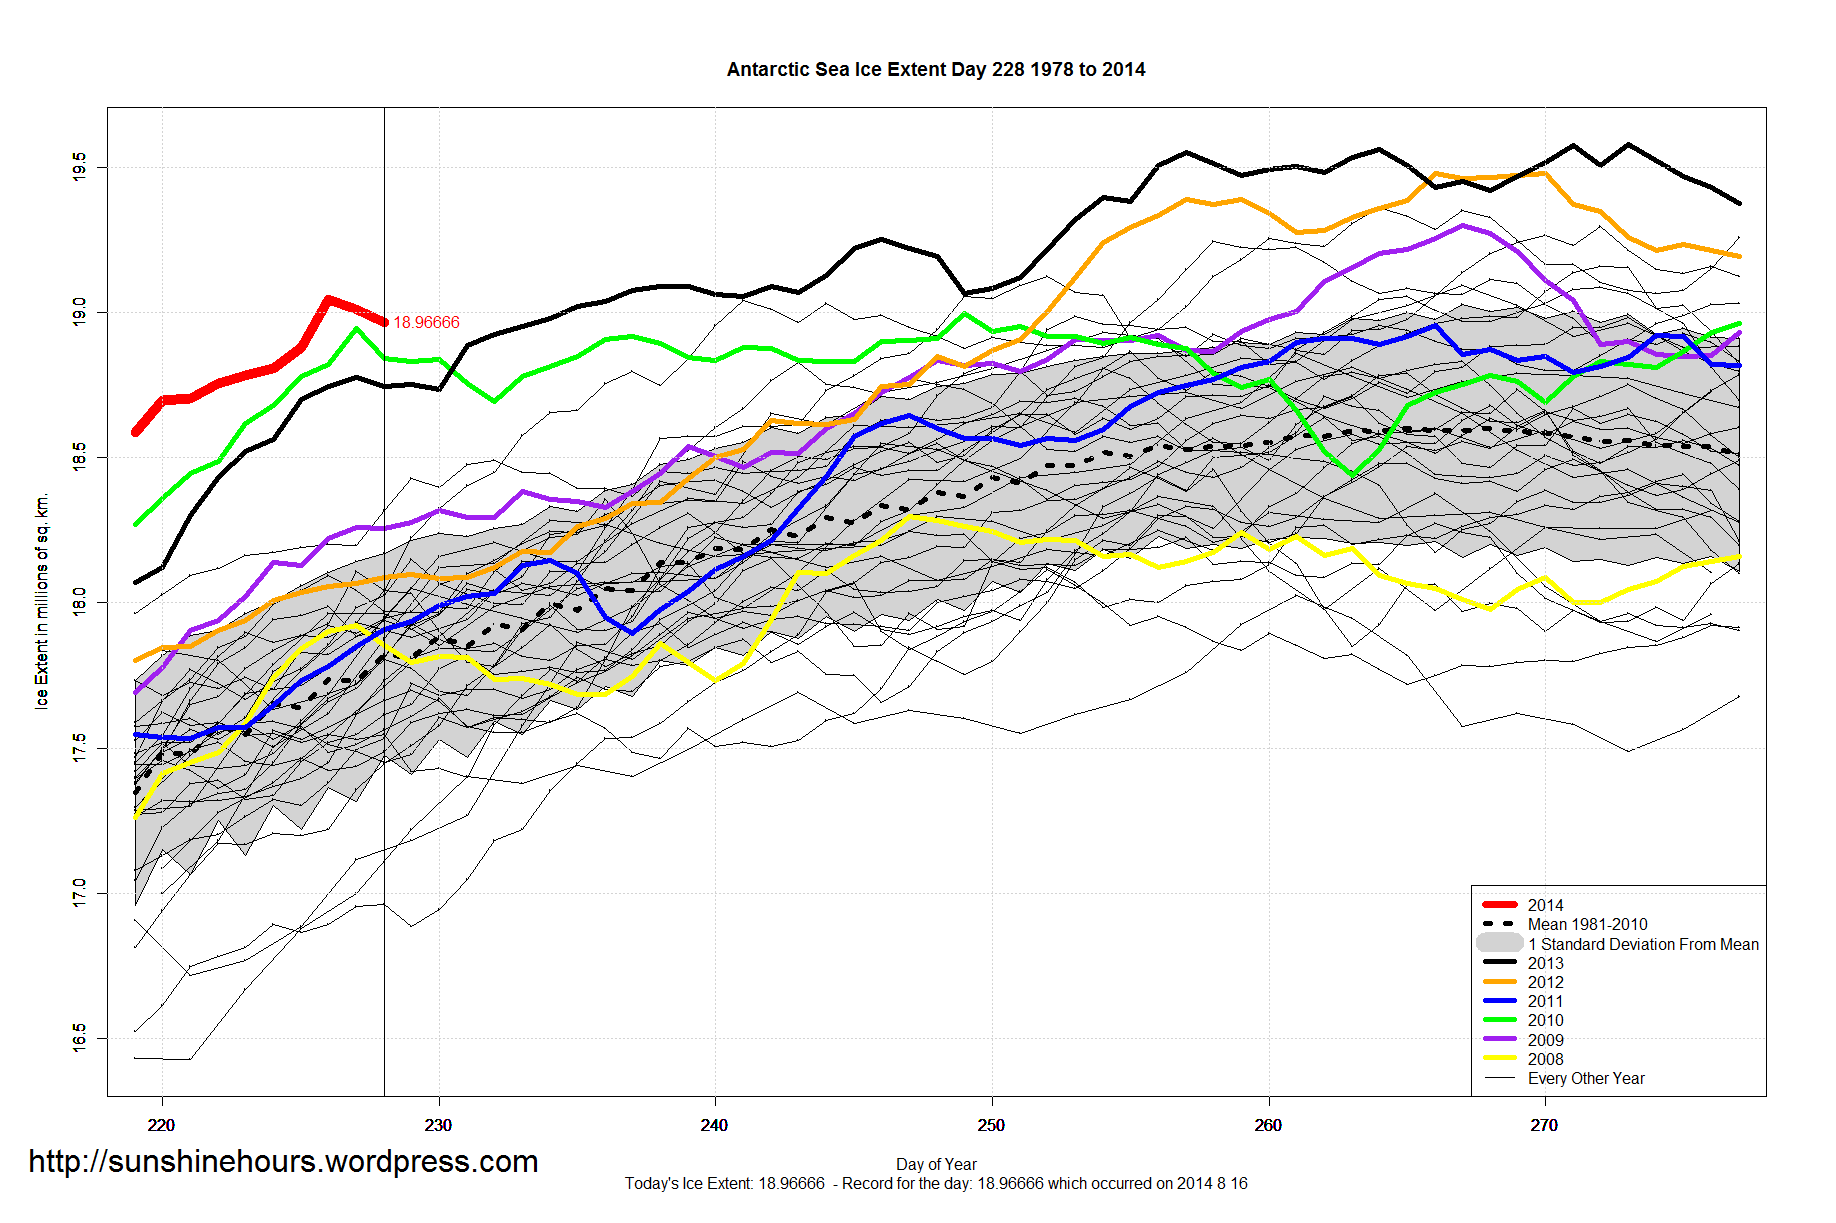

Global Sea Ice Extent Aug 17 2014 – 85,000 sq km above the 1981-2010 mean. Data for Day 228. Data here.


