Right now the mean for the year for Global Sea Ice Anomaly percent is +0.9% above the 1981-2010 mean.
The anomaly have been over +4% earlier in the year and is now almost -2%.
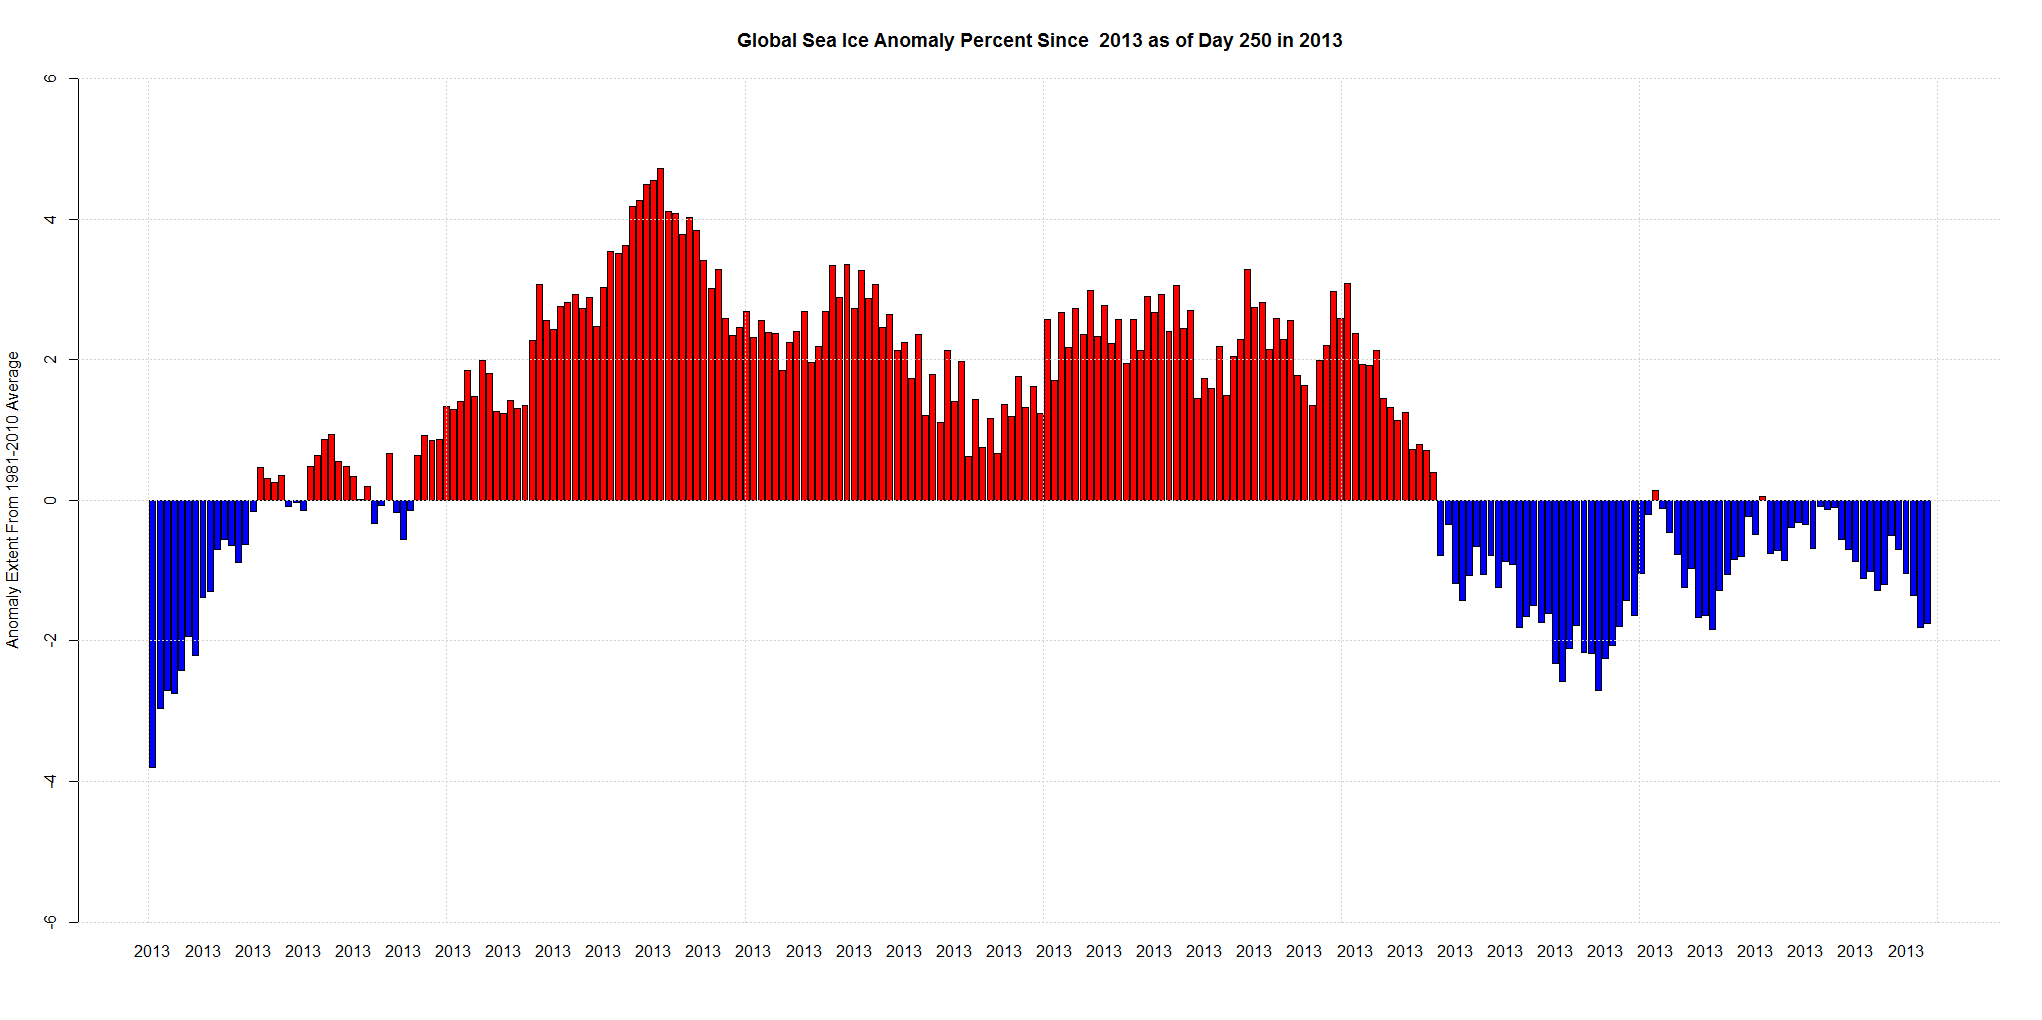
Right now the mean for the year for Global Sea Ice Anomaly percent is +0.9% above the 1981-2010 mean.
The anomaly have been over +4% earlier in the year and is now almost -2%.
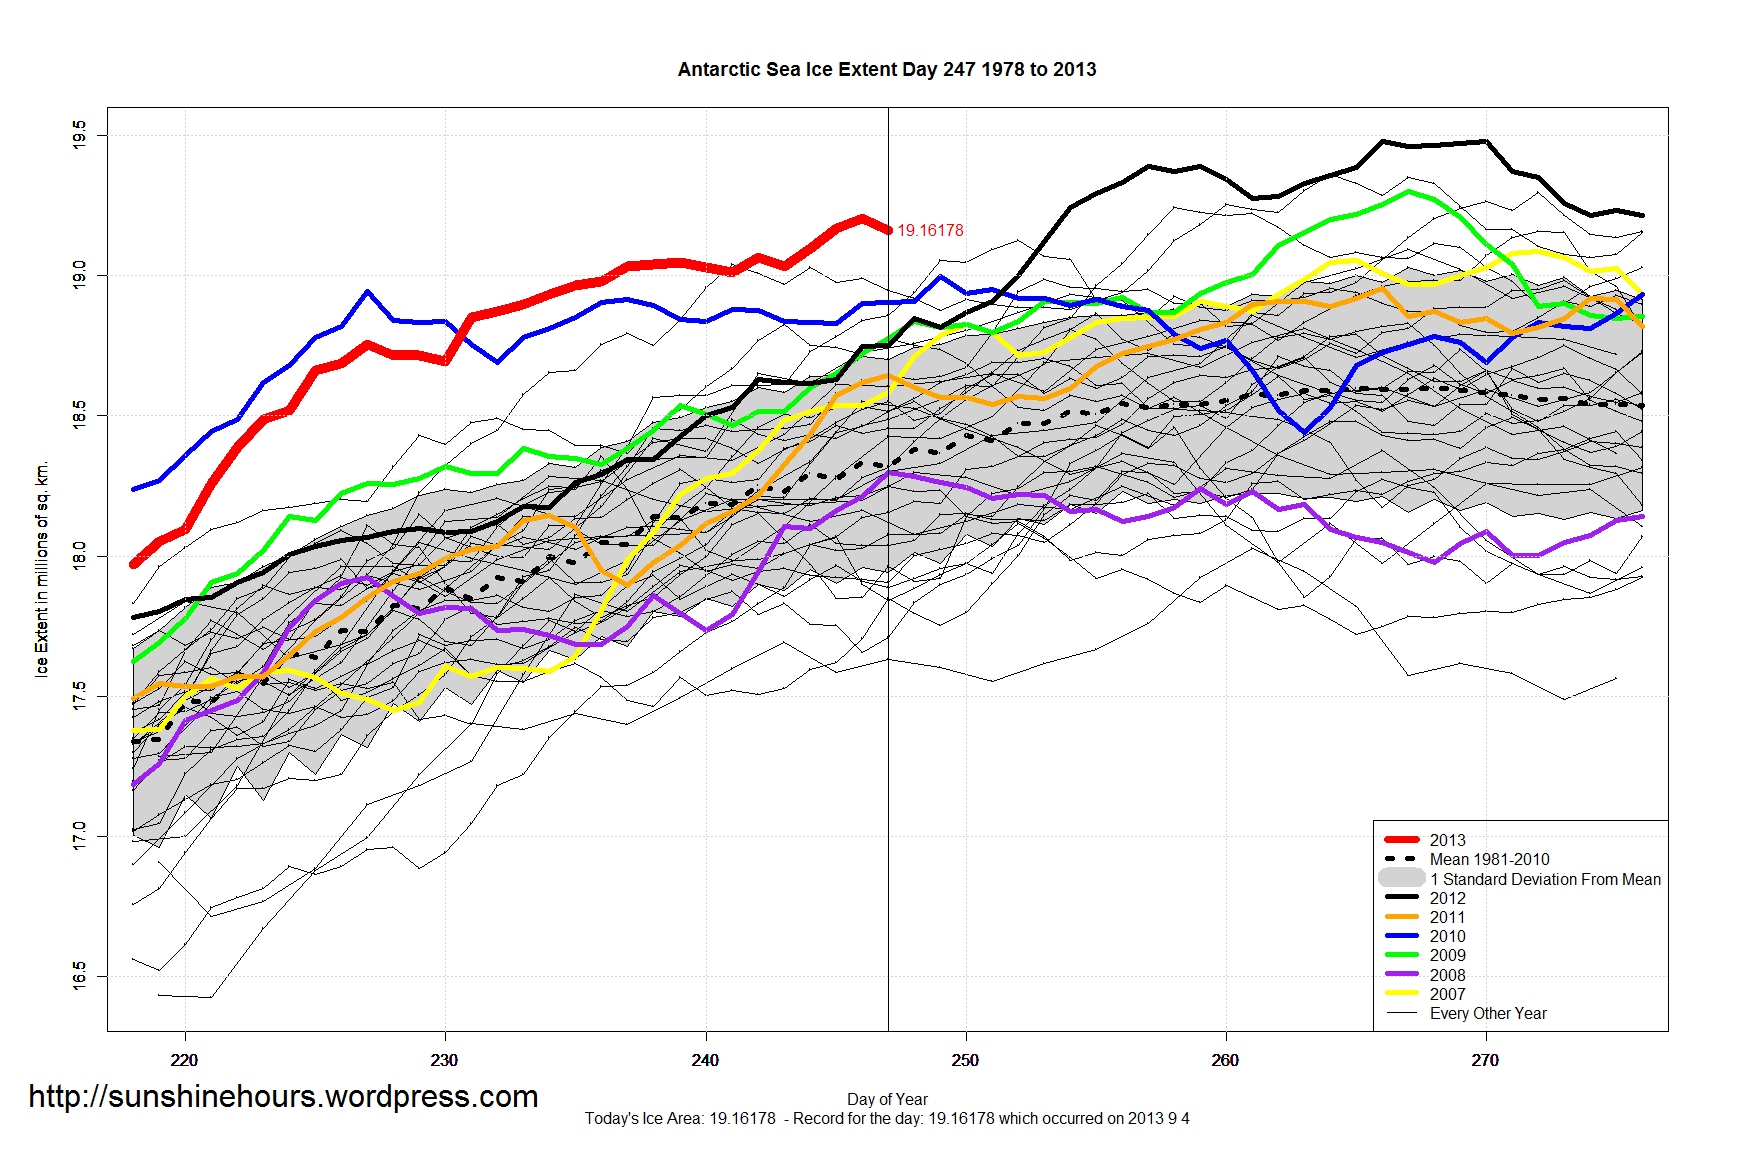
September 34 (Day 247) saw the 39th Daily Record of the Year for Antarctic Sea Ice Extent.
Antarctic Sea Ice Extent is 19.16 million sq km.
If you add up the number of daily records, 2013 is a distant 3rd behind 2008 and 2010. However, if you also add in 2nd place finishes, 2013 slightly edges out 2010. And 118 days remain in the year.
| Year | Firsts | Seconds | Top 2 |
| 2008 | 125 | 49 | 174 |
| 2013 | 39 | 109 | 148 |
| 2010 | 107 | 39 | 146 |
| 2006 | 20 | 28 | 48 |
| 2009 | 8 | 33 | 41 |
| 2012 | 27 | 11 | 38 |
| 2007 | 21 | 2 | 23 |
| 1998 | 4 | 16 | 20 |
| 2005 | 3 | 15 | 18 |
| 1979 | 2 | 12 | 14 |
| 2004 | 5 | 4 | 9 |
| 2000 | 4 | 3 | 7 |
| 1980 | 1 | 3 | 4 |
Click graph for bigger. Data is here.
September 3 (Day 246) saw the 38th Daily Record of the Year for Antarctic Sea Ice Extent.
Antarctic Sea Ice Extent is 19.20 million sq km.
Click graph for bigger. Data is here.
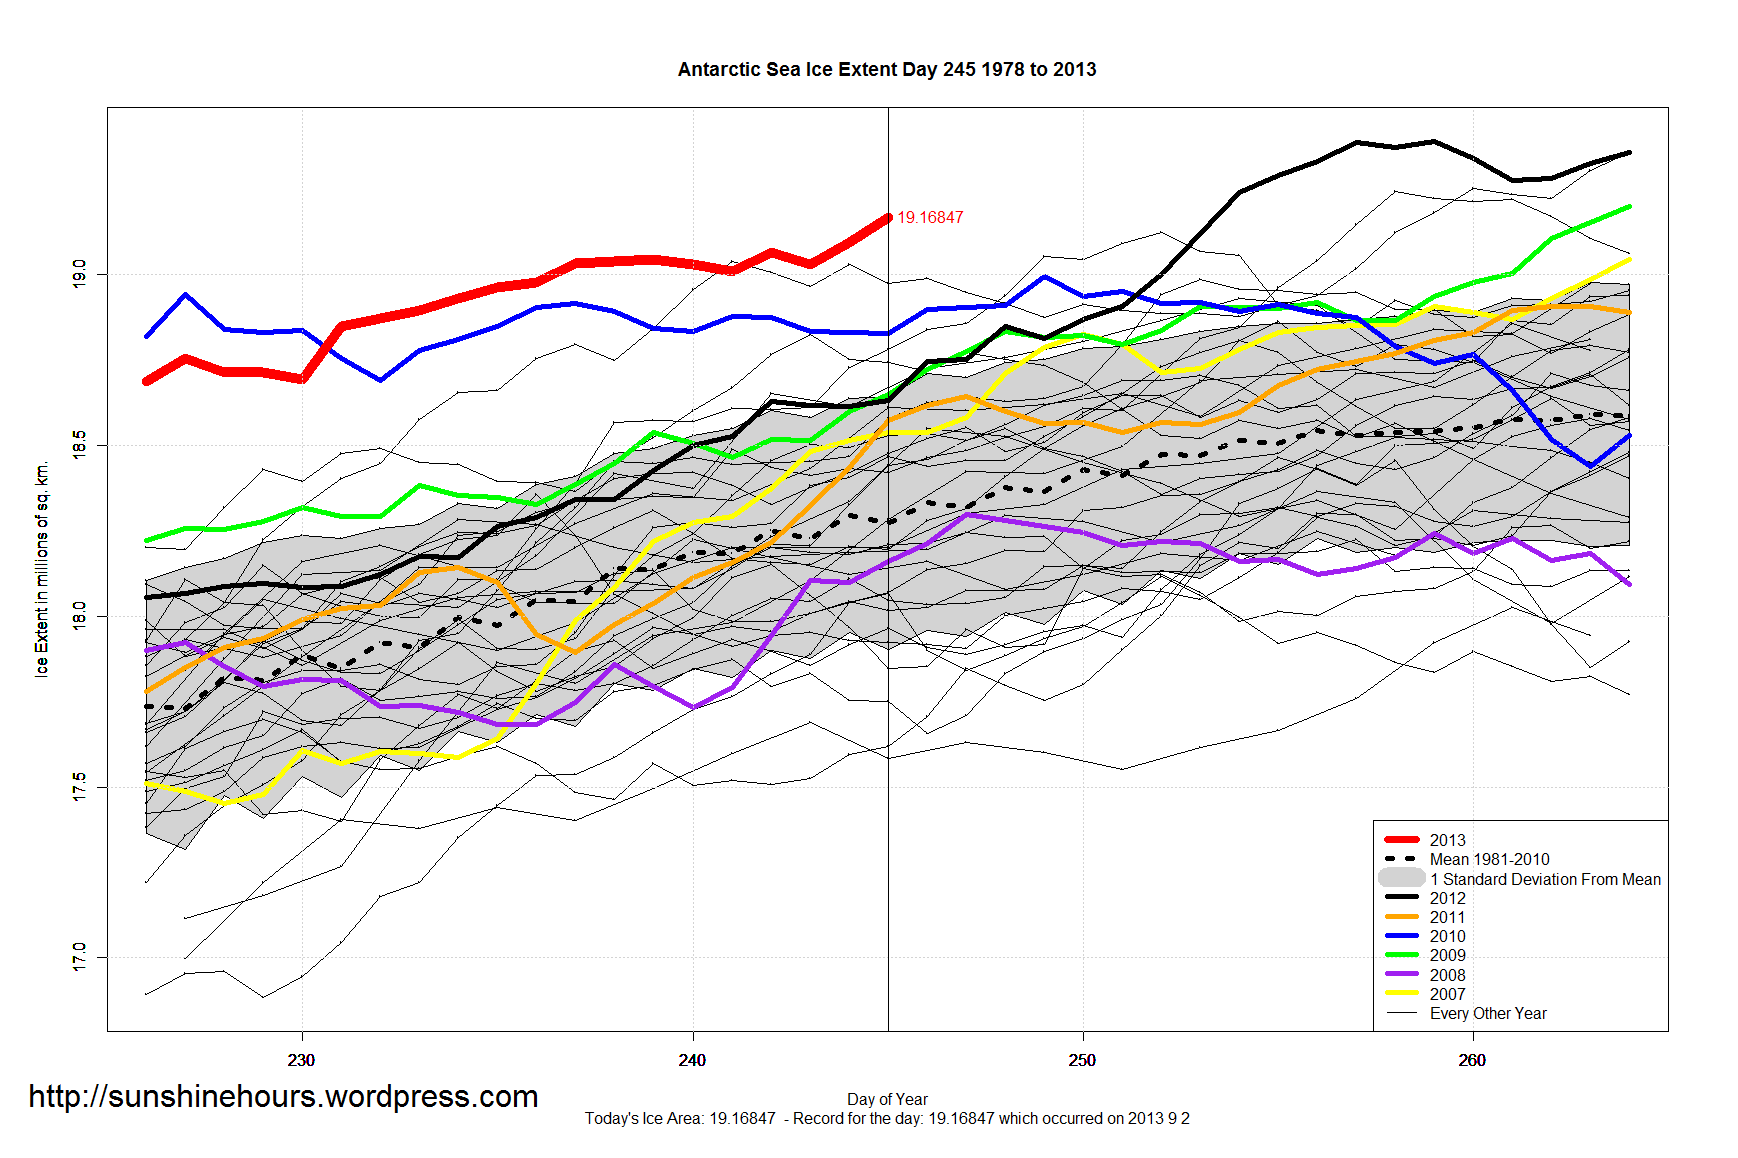
September 2 (Day 245) saw the 37th Daily Record of the Year for Antarctic Sea Ice Extent.
Antarctic Sea Ice Extent is 19.17 million sq km. Ice Gain was over 70,000 sq km which is the largest jump in 2 weeks.
Click graph for bigger. Data is here.

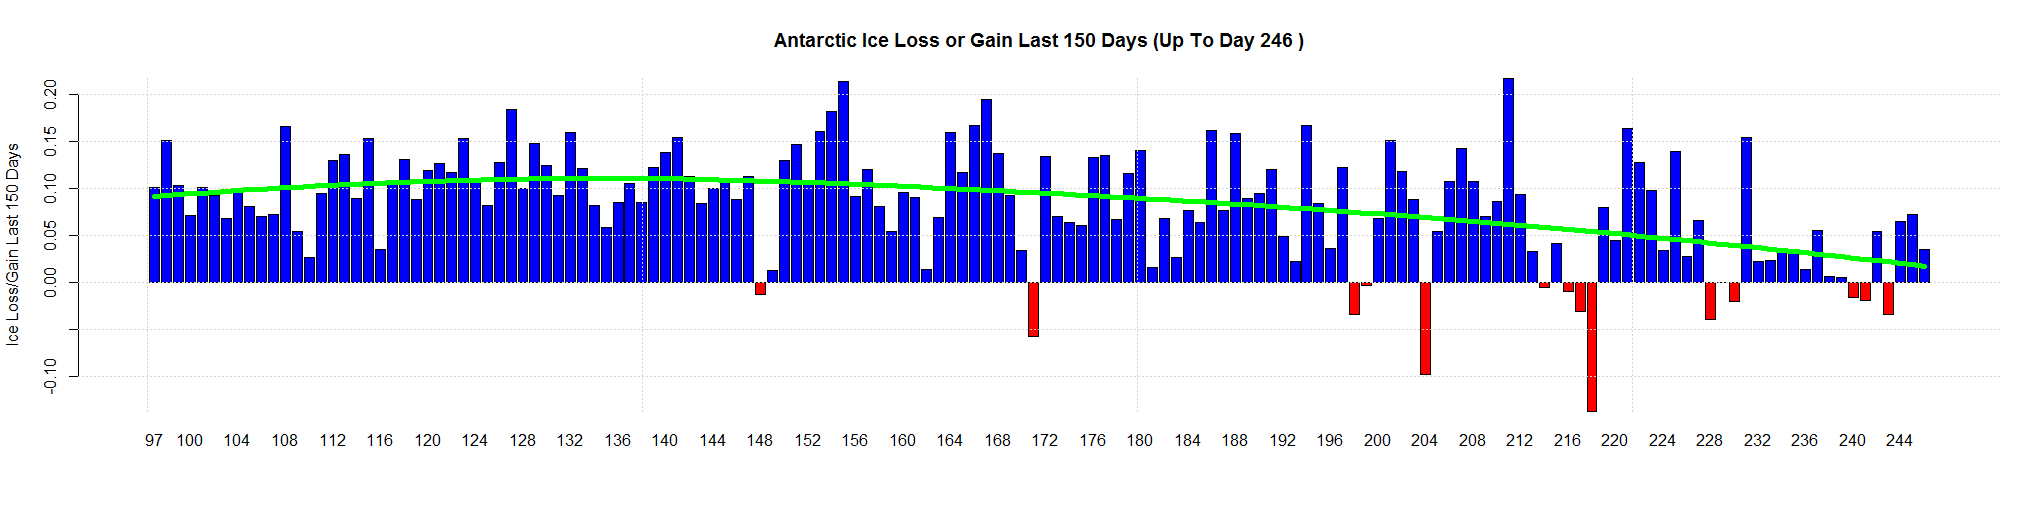
The last 150 days of Ice Loss or Gain.
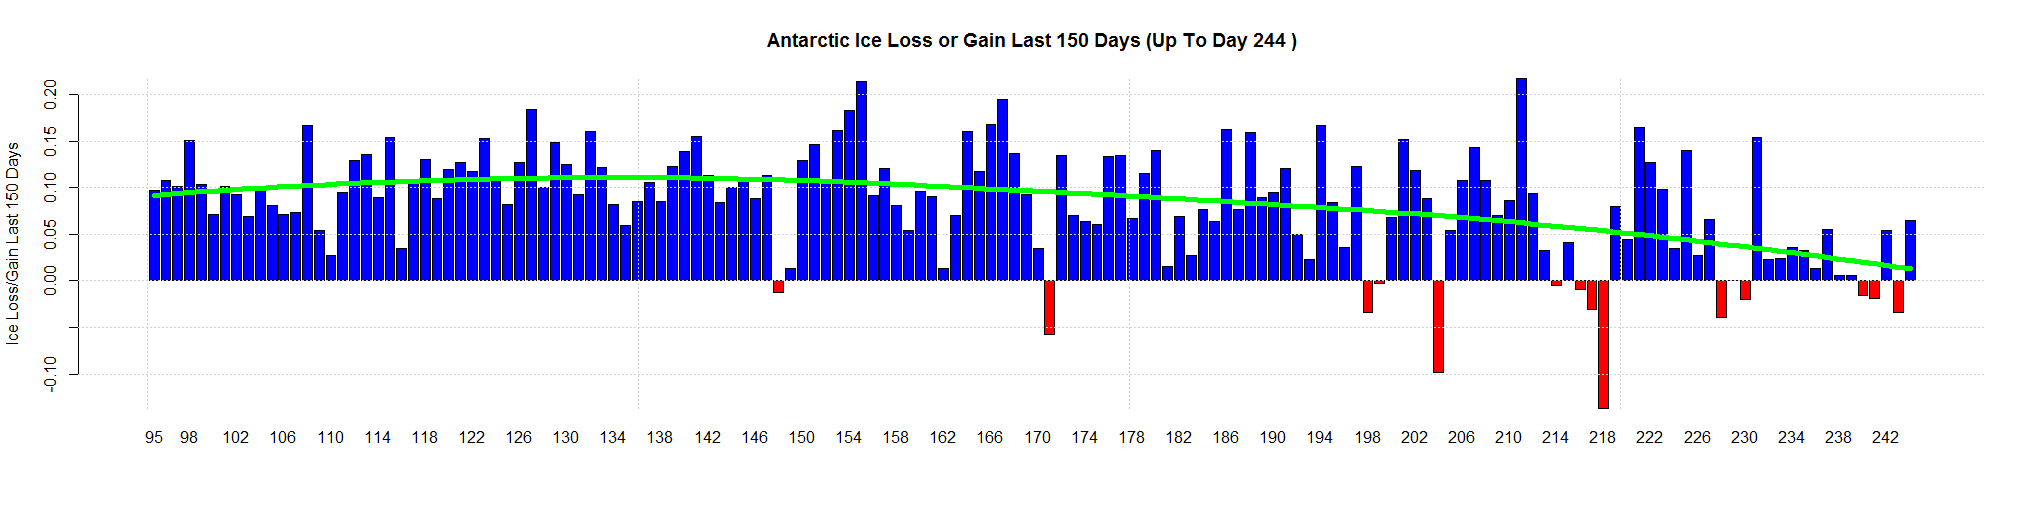

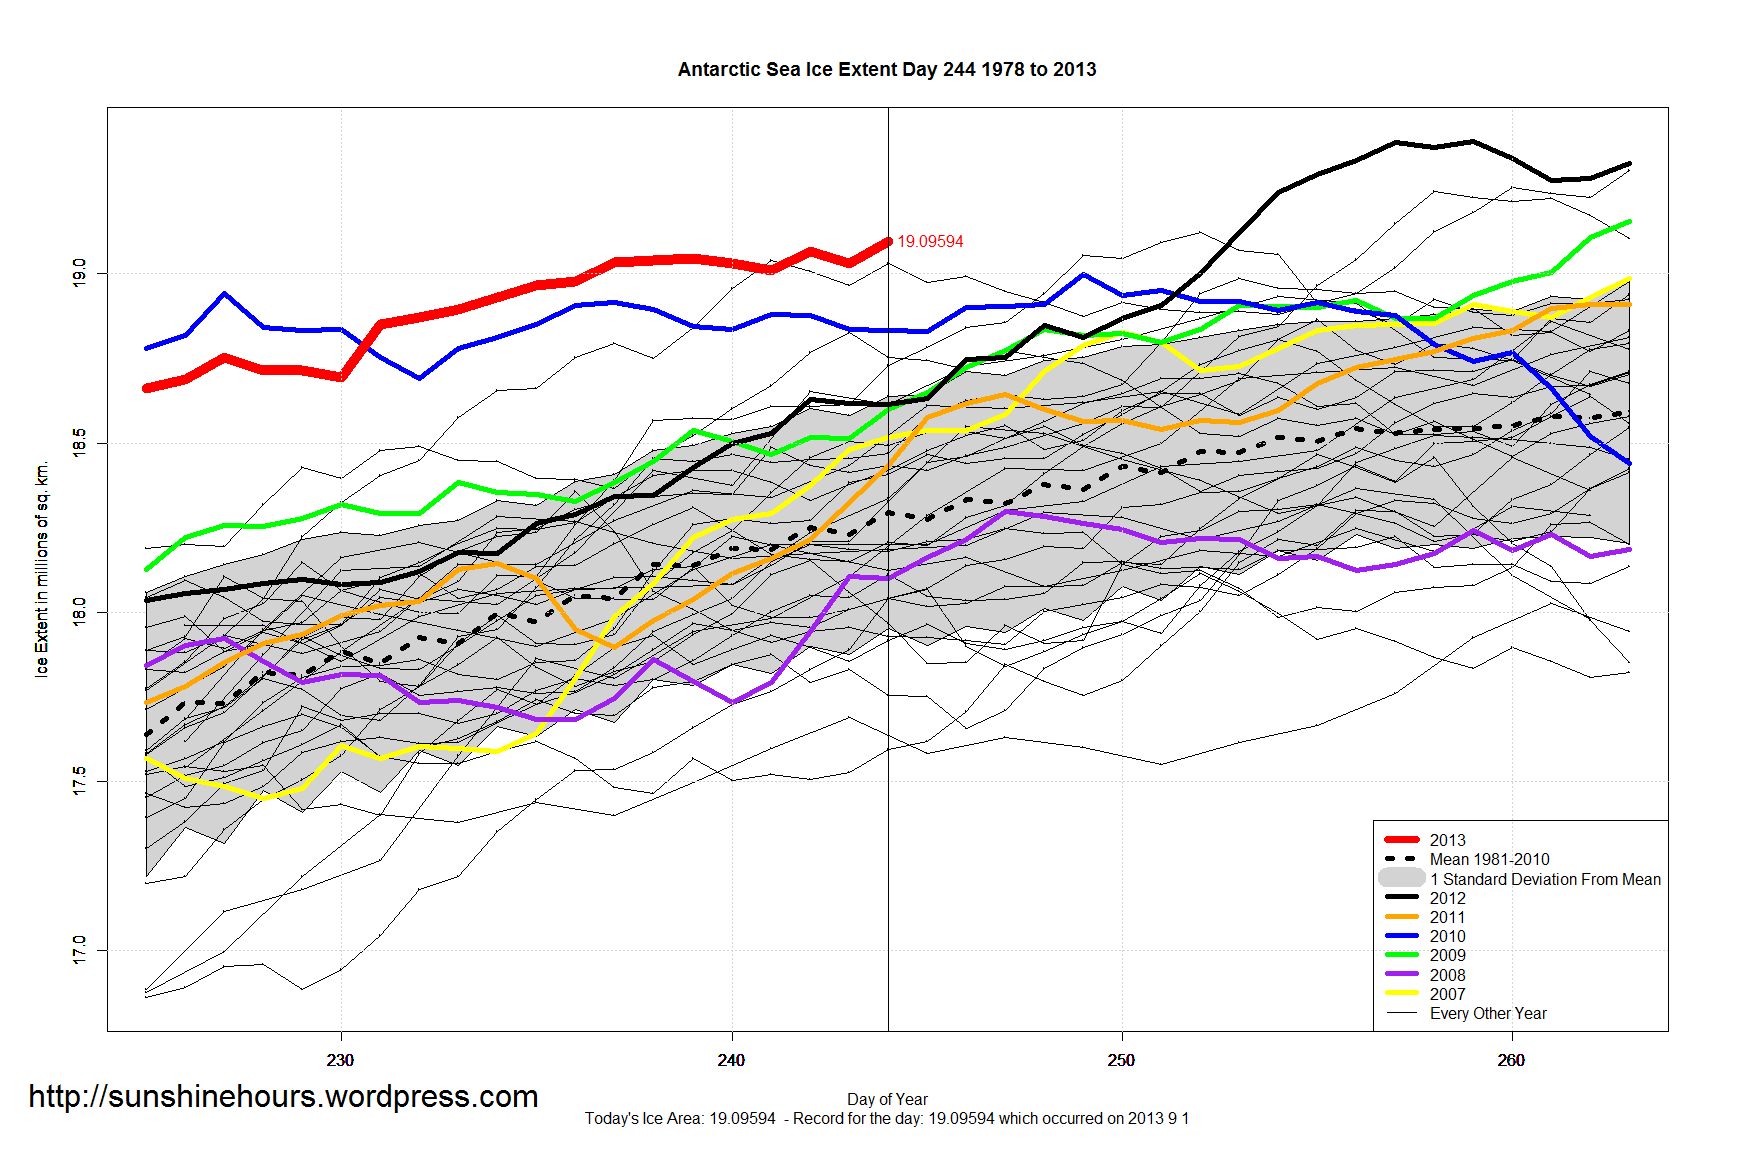
September 1 (Day 244) saw the 36th Daily Record of the Year for Antarctic Sea Ice Extent.
Antarctic Sea Ice Extent is 19.09 million sq km which is 800,000 sq km above the 30 year average.
Click graph for bigger. Data is here.
August 31 (Day 243) saw the 35th Daily Record of the Year for Antarctic Sea Ice Extent.
Antarctic Sea Ice Extent is 19.03105 million sq km.
Click graph for bigger. Data is here.
August 30 (Day 242) saw the 34th Daily Record of the Year for Antarctic Sea Ice Extent.
Antarctic Sea Ice Extent is 19.06 million sq km.
Click graph for bigger. Data is here.
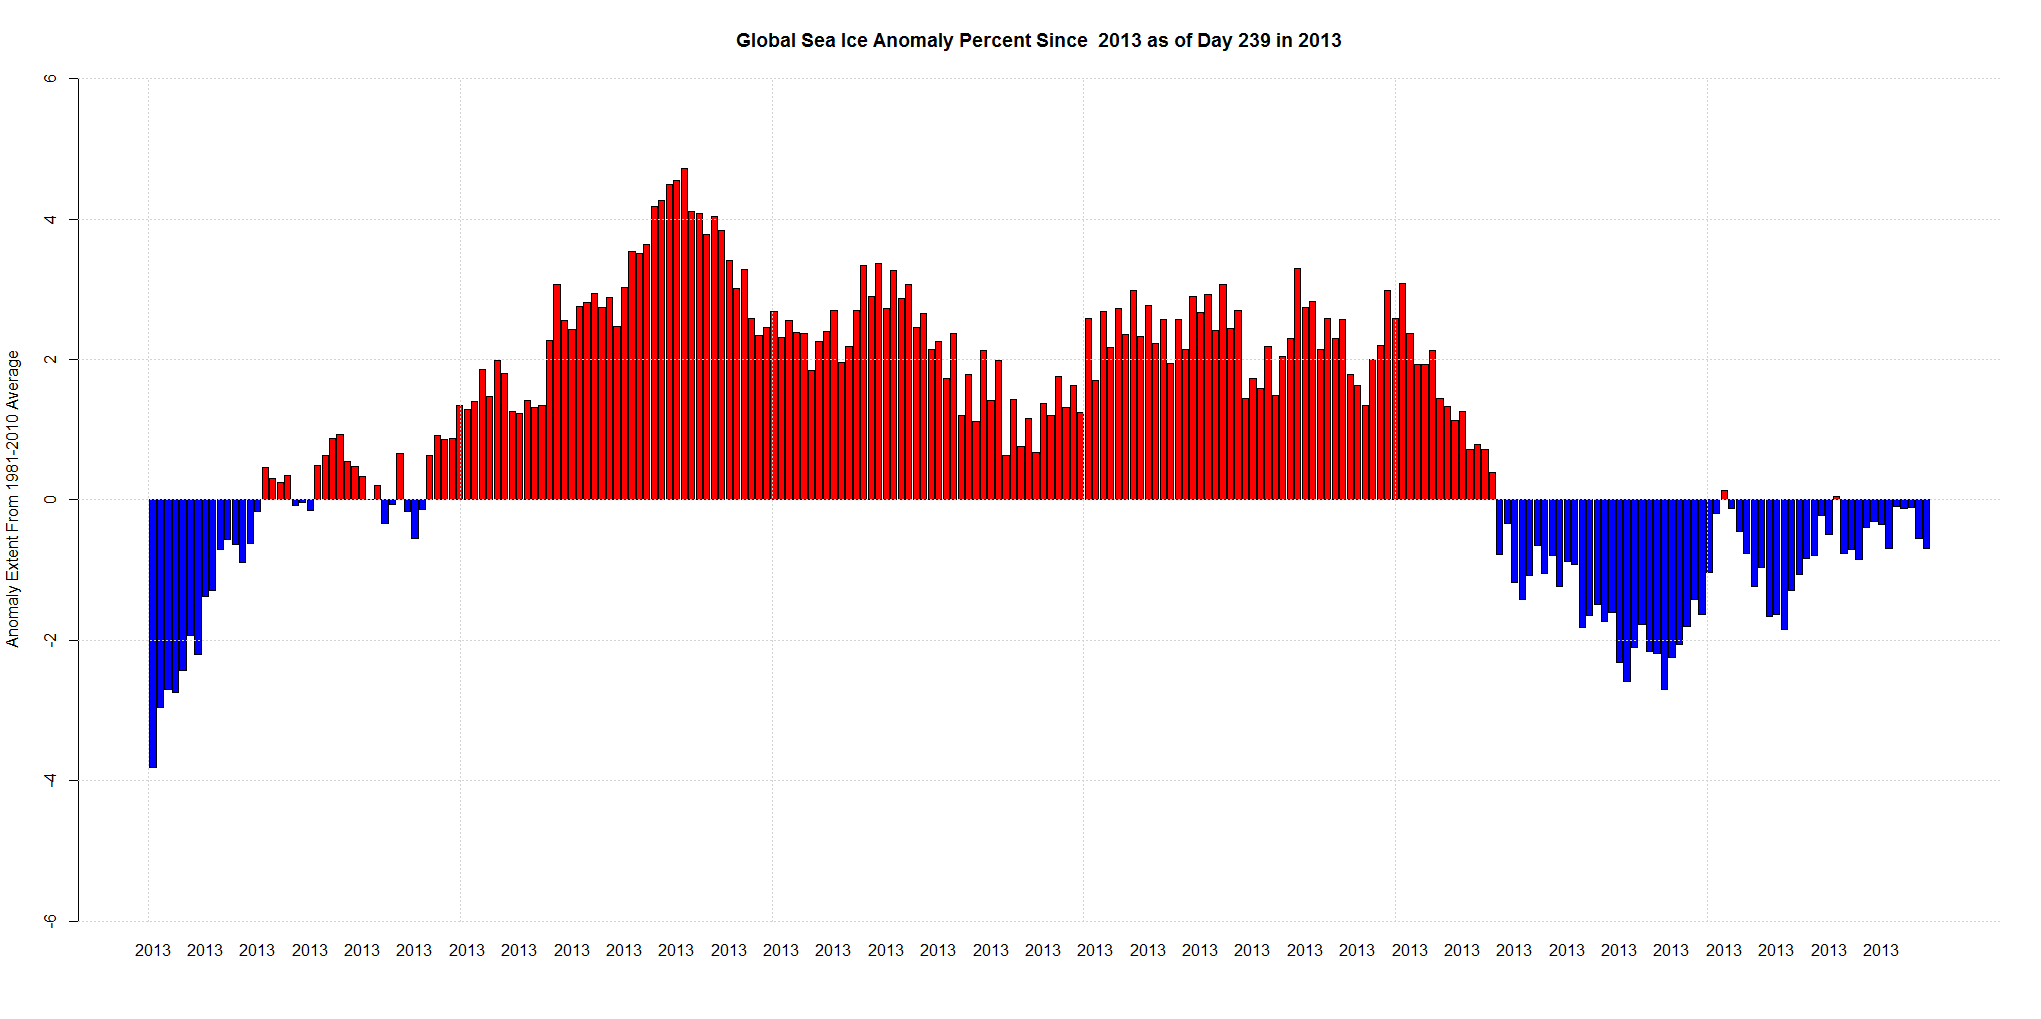
If you add up the Antarctic Sea Ice Extent Anomaly from the 30 year mean and the Arctic Anomaly and divide by the 30 year mean it comes to 170,000 sq km. Out of a normal mean of 24,700,000 sq km on Day 239.
That is a whole 0.7% below normal. The red part is above normal. The blue is below normal.
The highest anomaly for 2013 was March 14th when the anomaly was 908,000 out of a mean of 19.2 million for an anomaly percent of 4.72%.
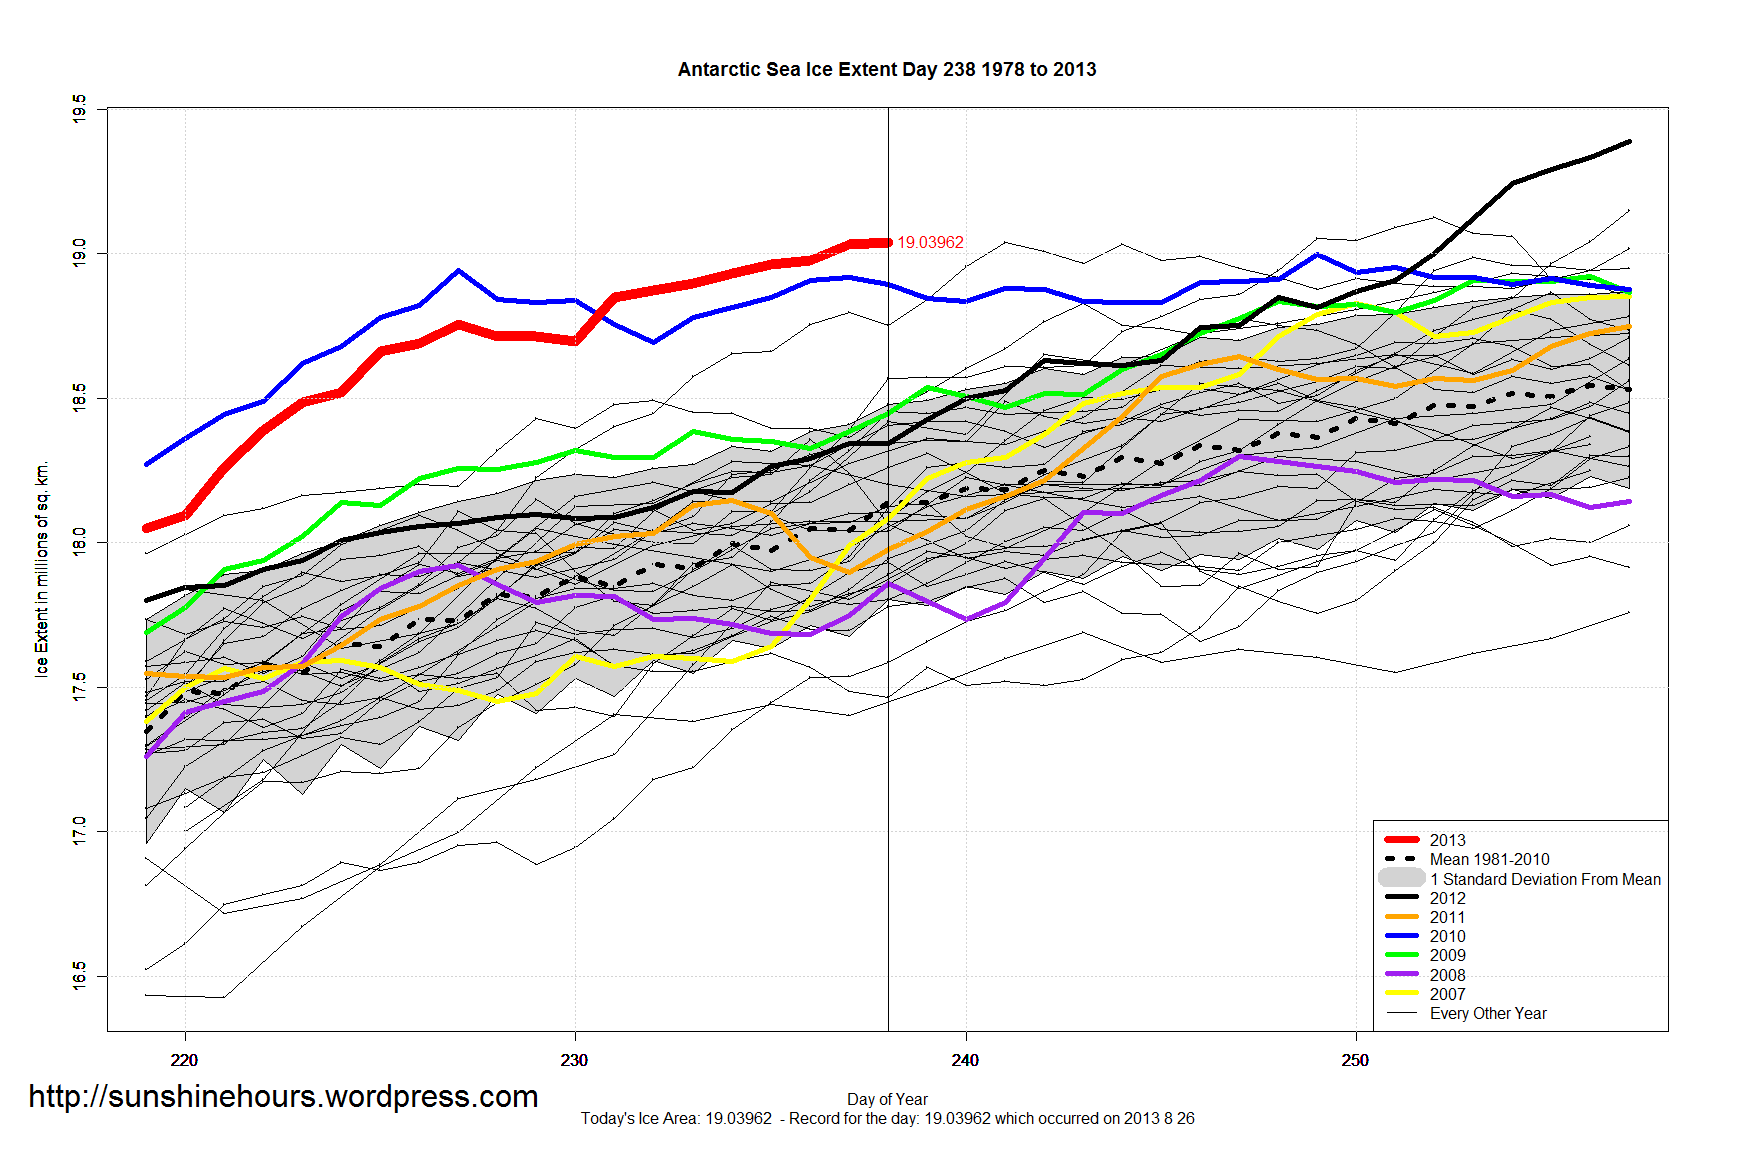
August 26 (Day 238) saw the 31st Daily Record of the Year for Antarctic Sea Ice Extent. This was the 8th record in a row.
Antarctic Sea Ice Extent is 19.03962 million sq km. That is 1,000,000 sq km higher than the 30 year mean.
With still 2 – 4 weeks left in the Antarctic Freeze Season, 2013 Sea Ice Extent has already surpassed 25 years yearly maximums.
Only the following years have had more ice: 1980, 1998, 2000, 2004, 2005, 2006, 2007, 2009, 2012.
Click graph for bigger. Data is here.


