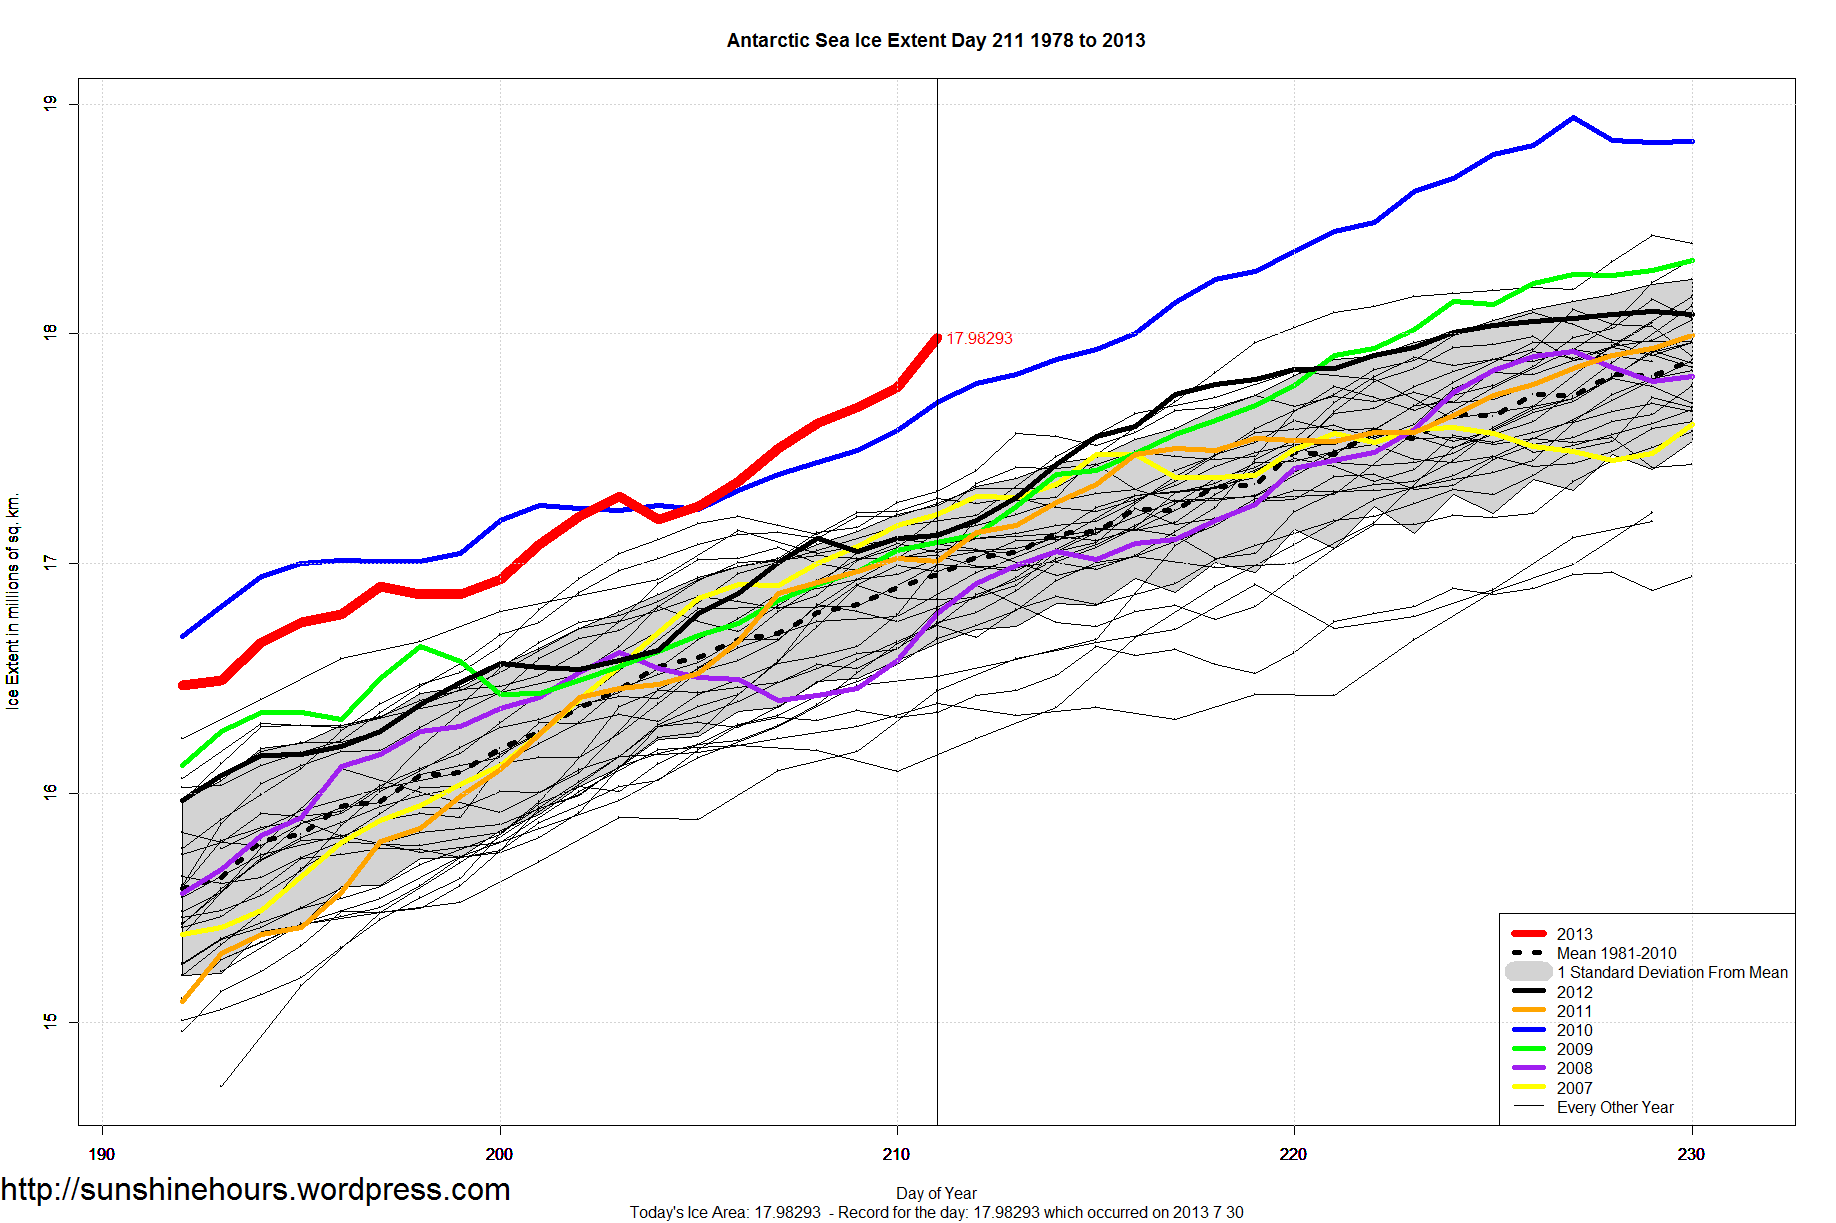
July 30 (Day 211) saw the 8th Daily Record in 9 Days for Antarctic Sea Ice Extent. Click graph for bigger. Data is here.
Day 211 smashed the old record by 280,000 sq km. Day 211 is over 1,000,000 sq km higher than the 30 year mean.
July 30 (Day 211) saw the 8th Daily Record in 9 Days for Antarctic Sea Ice Extent. Click graph for bigger. Data is here.
Day 211 smashed the old record by 280,000 sq km. Day 211 is over 1,000,000 sq km higher than the 30 year mean.
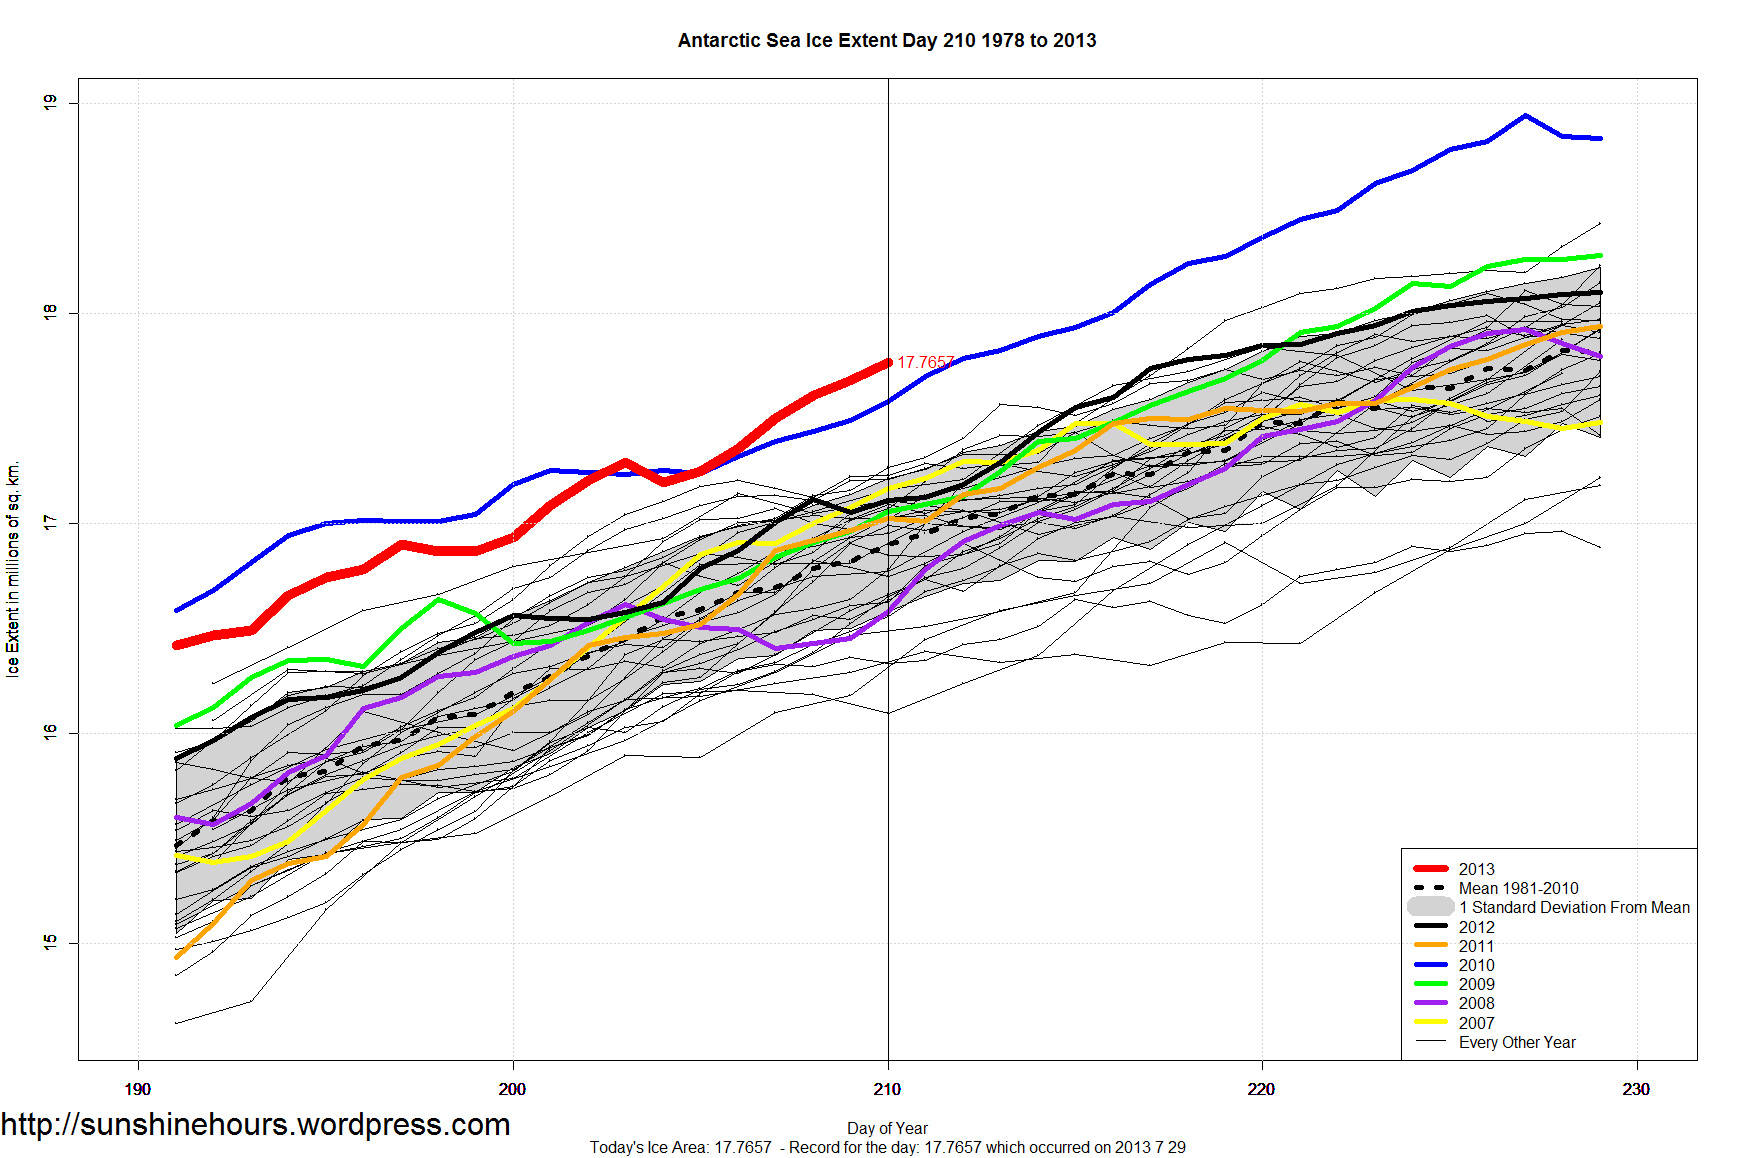
July 29 (Day 210) saw the 7th Daily Record in 8 Days for Antarctic Sea Ice Extent. Click graph for bigger. Data is here.
Day 210 was 185,000 sq km higher than the previous record which occurred in 2010). And it was 870,000 sq km higher than the 30 year mean.
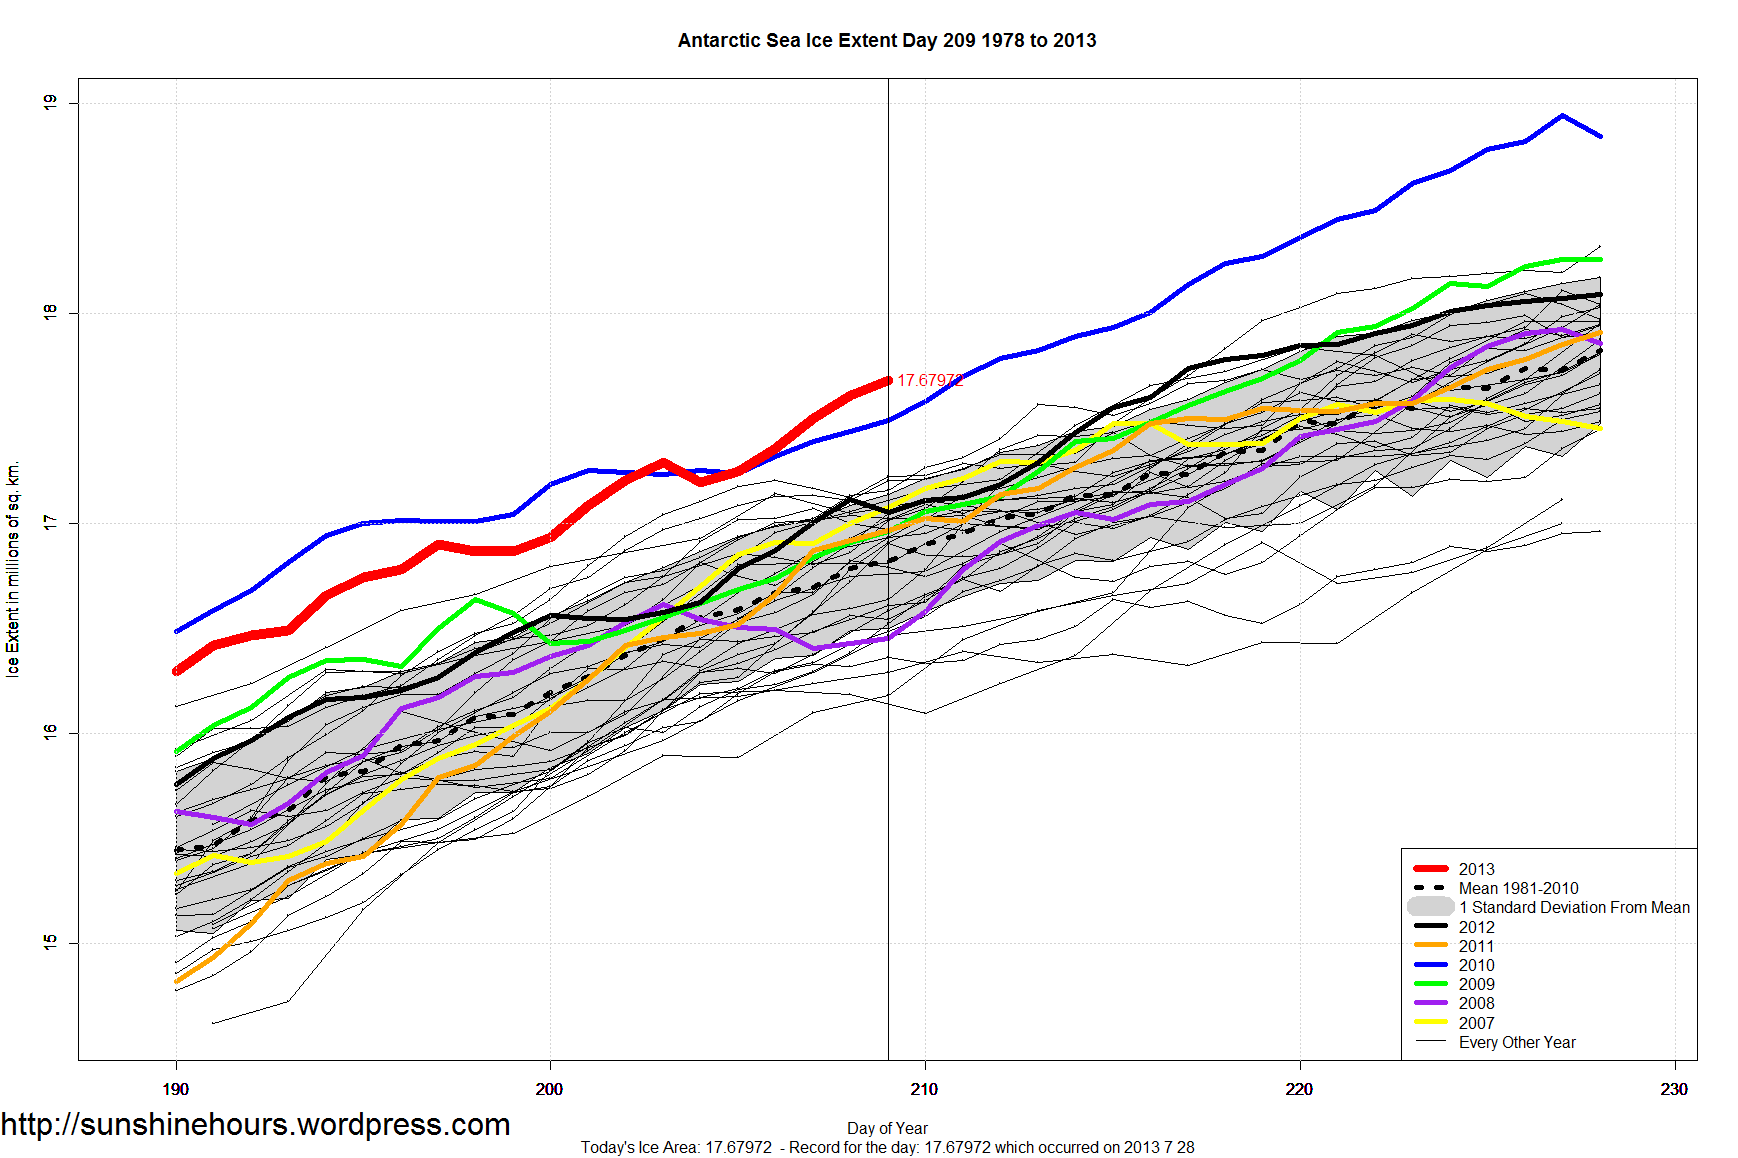
July 28 (Day 209) saw the 6th Daily Record in 7 Days for Antarctic Sea Ice Extent. Click graph for bigger.
Day 209 was 180,000 sq km higher than the previous record which occurred in 2010).
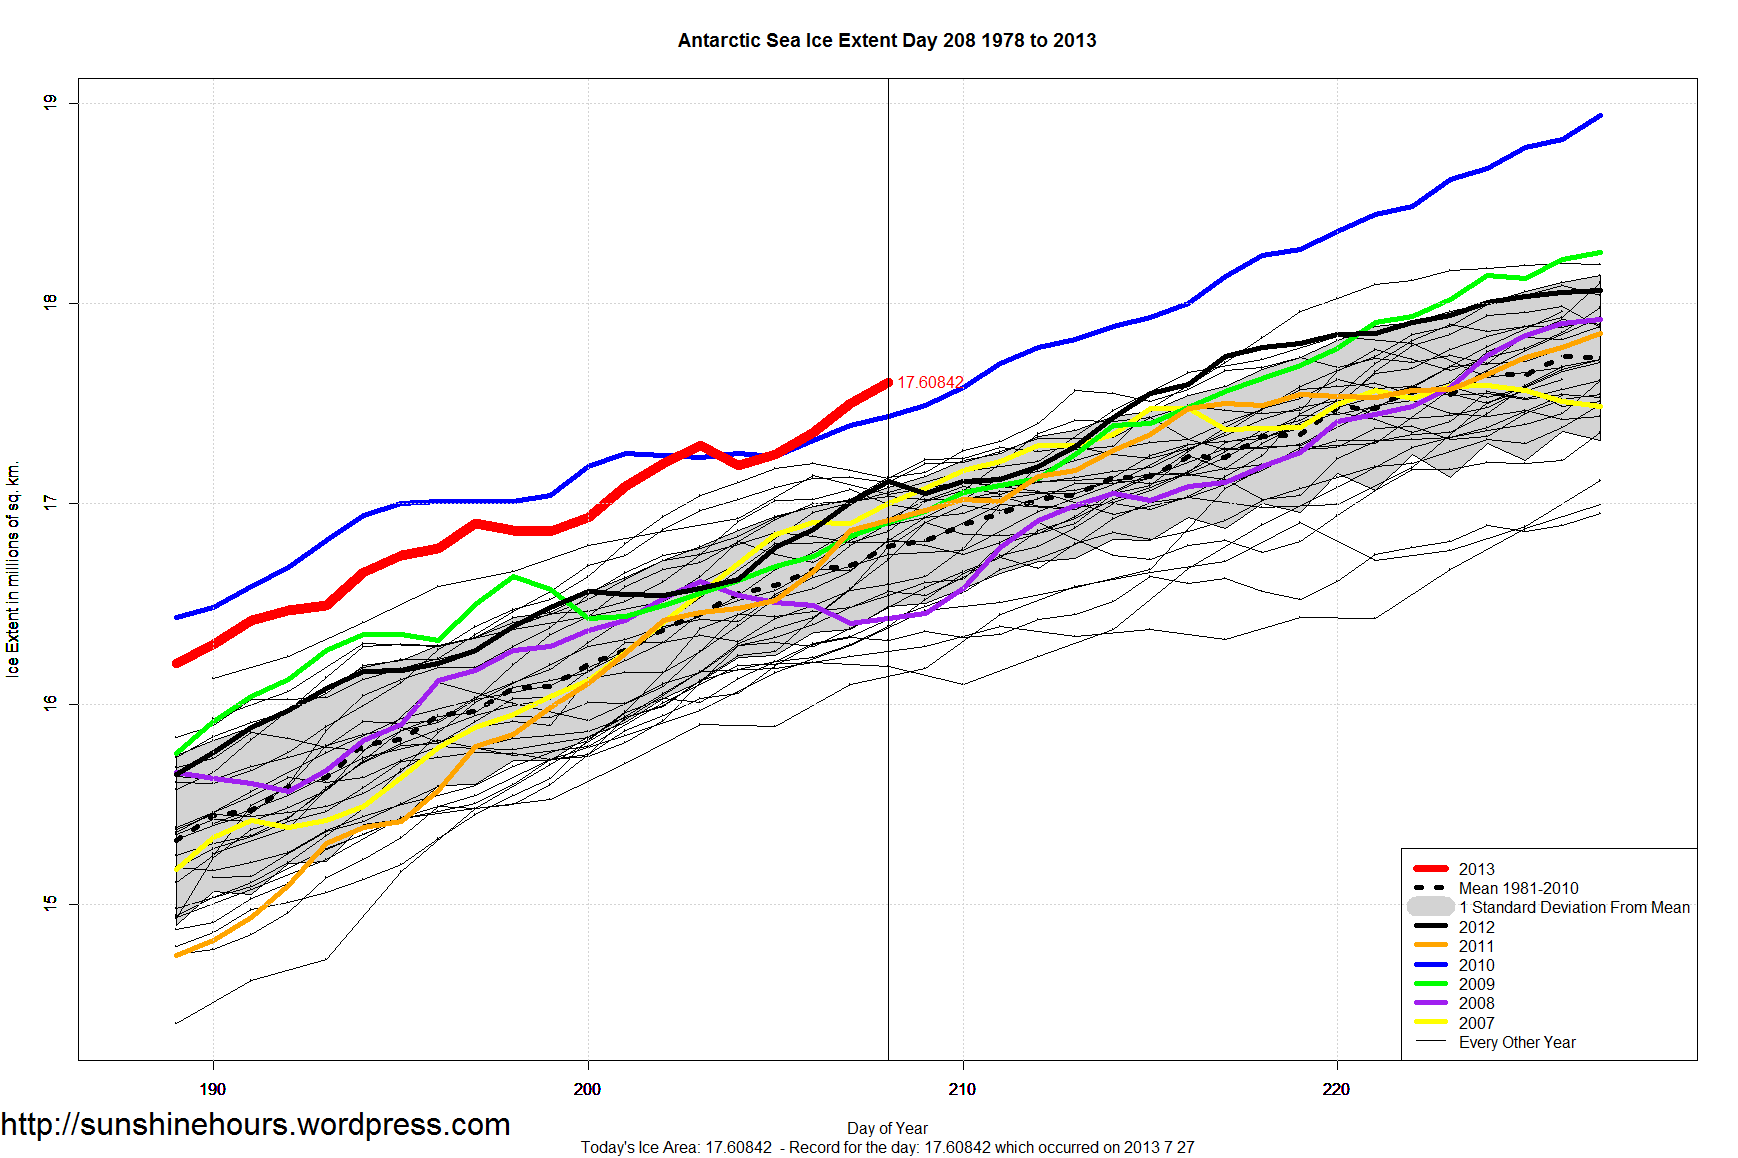
July 27 (Day 208) saw the 5th Daily Record in 6 Days for Antarctic Sea Ice Extent. Click graph for bigger.
That makes 15 daily records set in 2013. Looking at the graph, 2013 may have a long run of records still to come.
Out of 366 possible daily records, only 7 were set before 2000 – 4 in 1998, 2 in 1979 and 1 in 1980.
| Year | No of Records |
| 2008 | 125 |
| 2010 | 124 |
| 2006 | 27 |
| 2012 | 27 |
| 2007 | 21 |
| 2013 | 15 |
| 2009 | 8 |
| 2004 | 5 |
| 1998 | 4 |
| 2000 | 4 |
| 2005 | 3 |
| 1979 | 2 |
| 1980 | 1 |
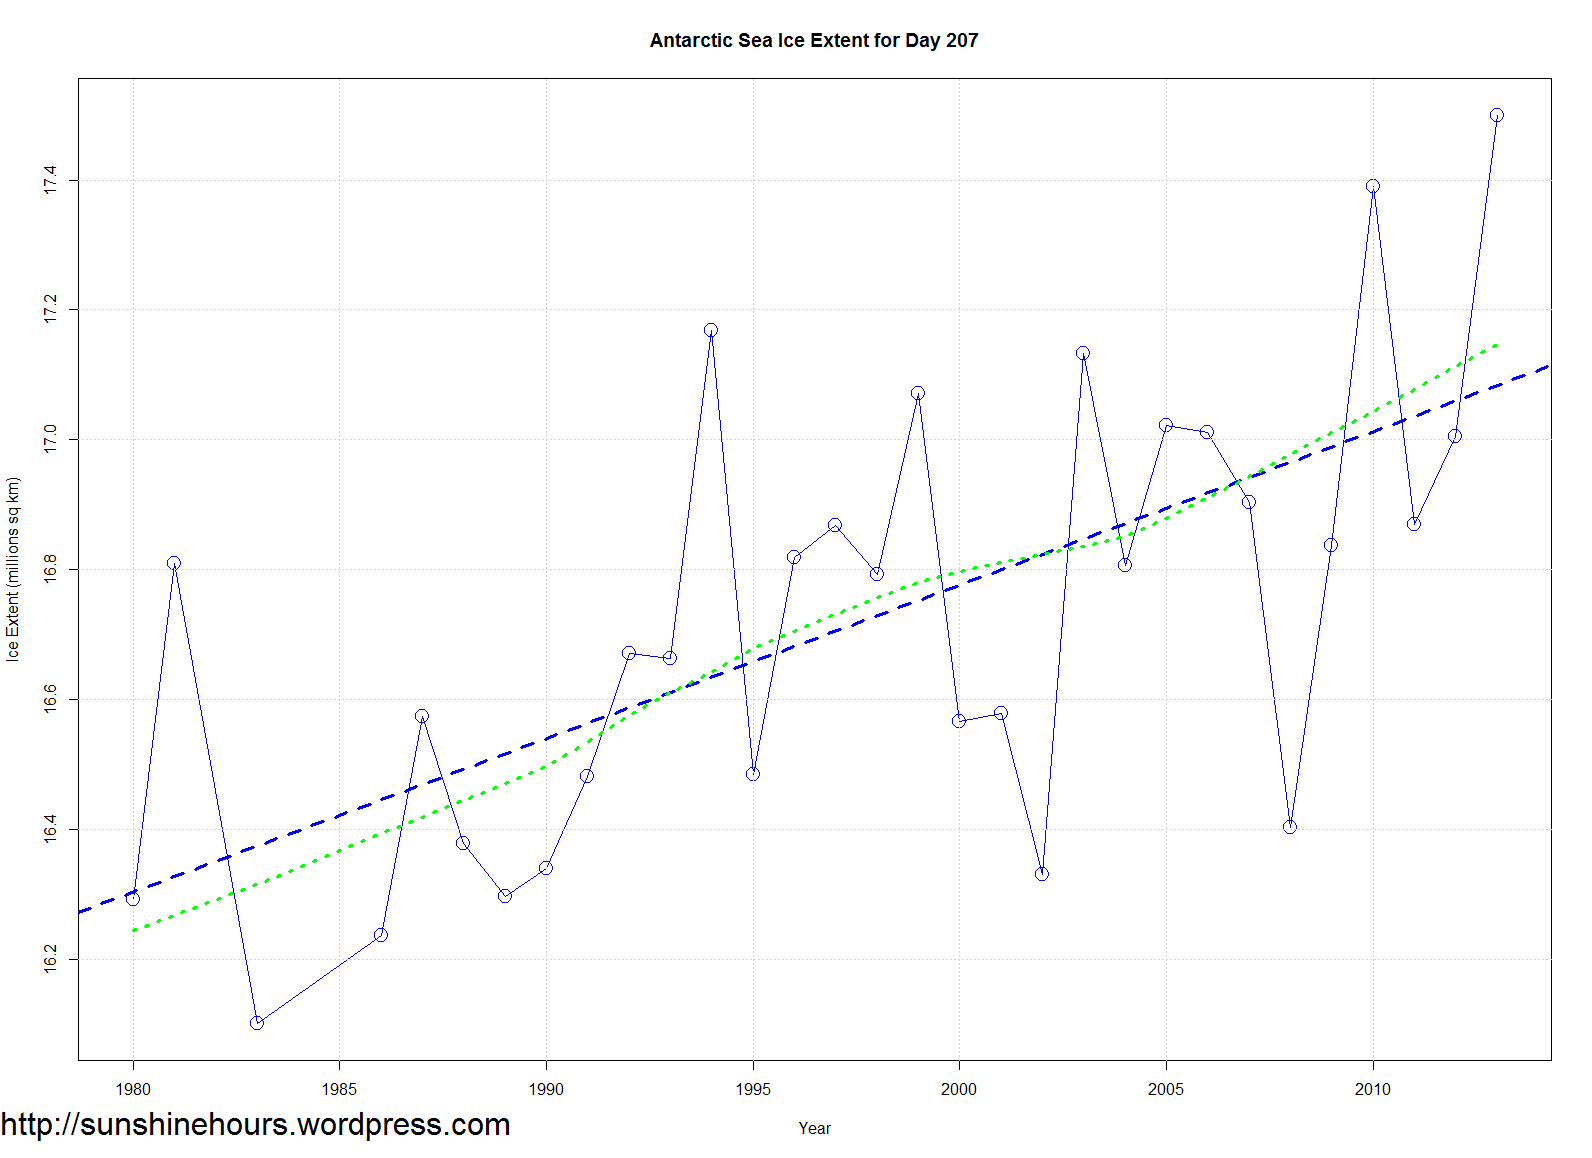
Day 207 (July 26 2013) in the Antarctic was a daily record (most ice extent on the day).
2013’s Day 207 was 1.4 million sq km higher than 1983’s Day 207 and was also 800,000 sq km above the 30 year average.
Here is all the day 207’s graphed:
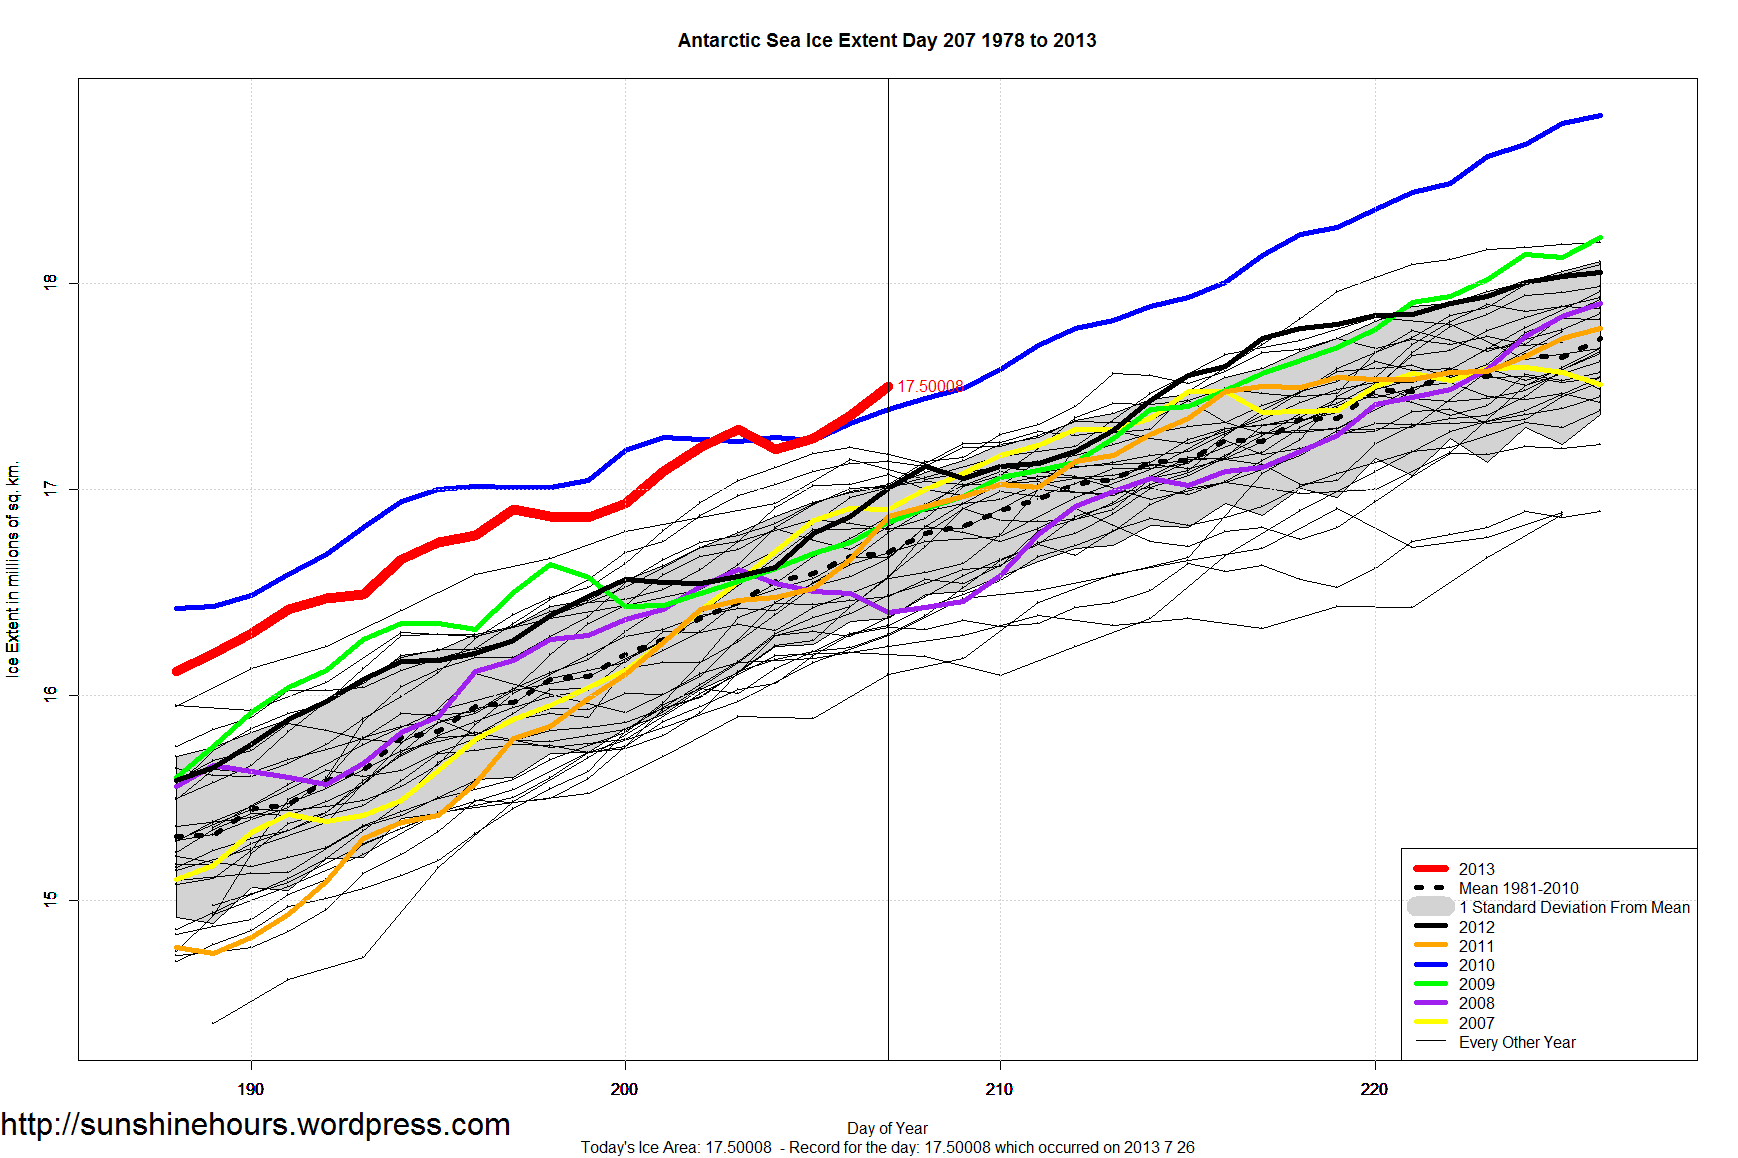
July 26 (Day 207) saw the 4th Daily Record in 5 Days for Antarctic Sea Ice Extent. Click for bigger.
July 26 (Day 206) saw the 3rd Daily Record in 4 Days for Antarctic Sea Ice Extent. Click for bigger.

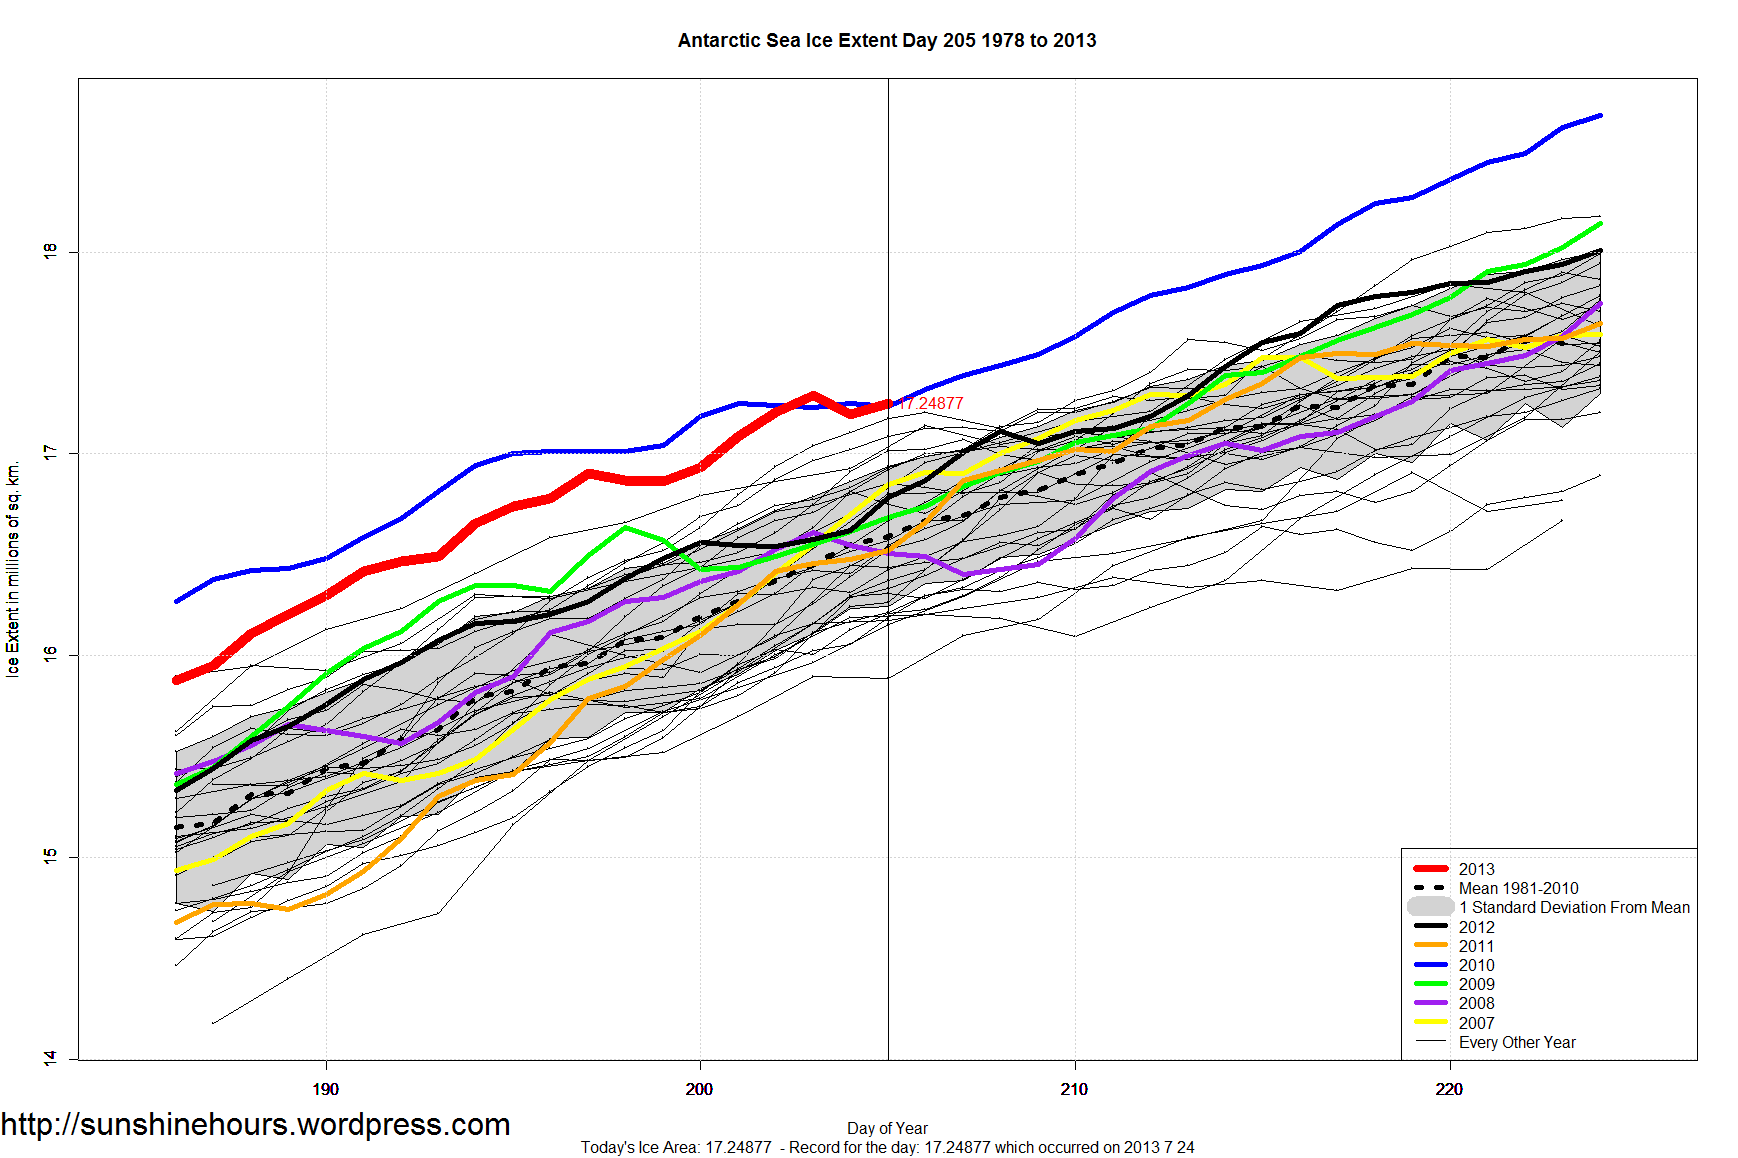
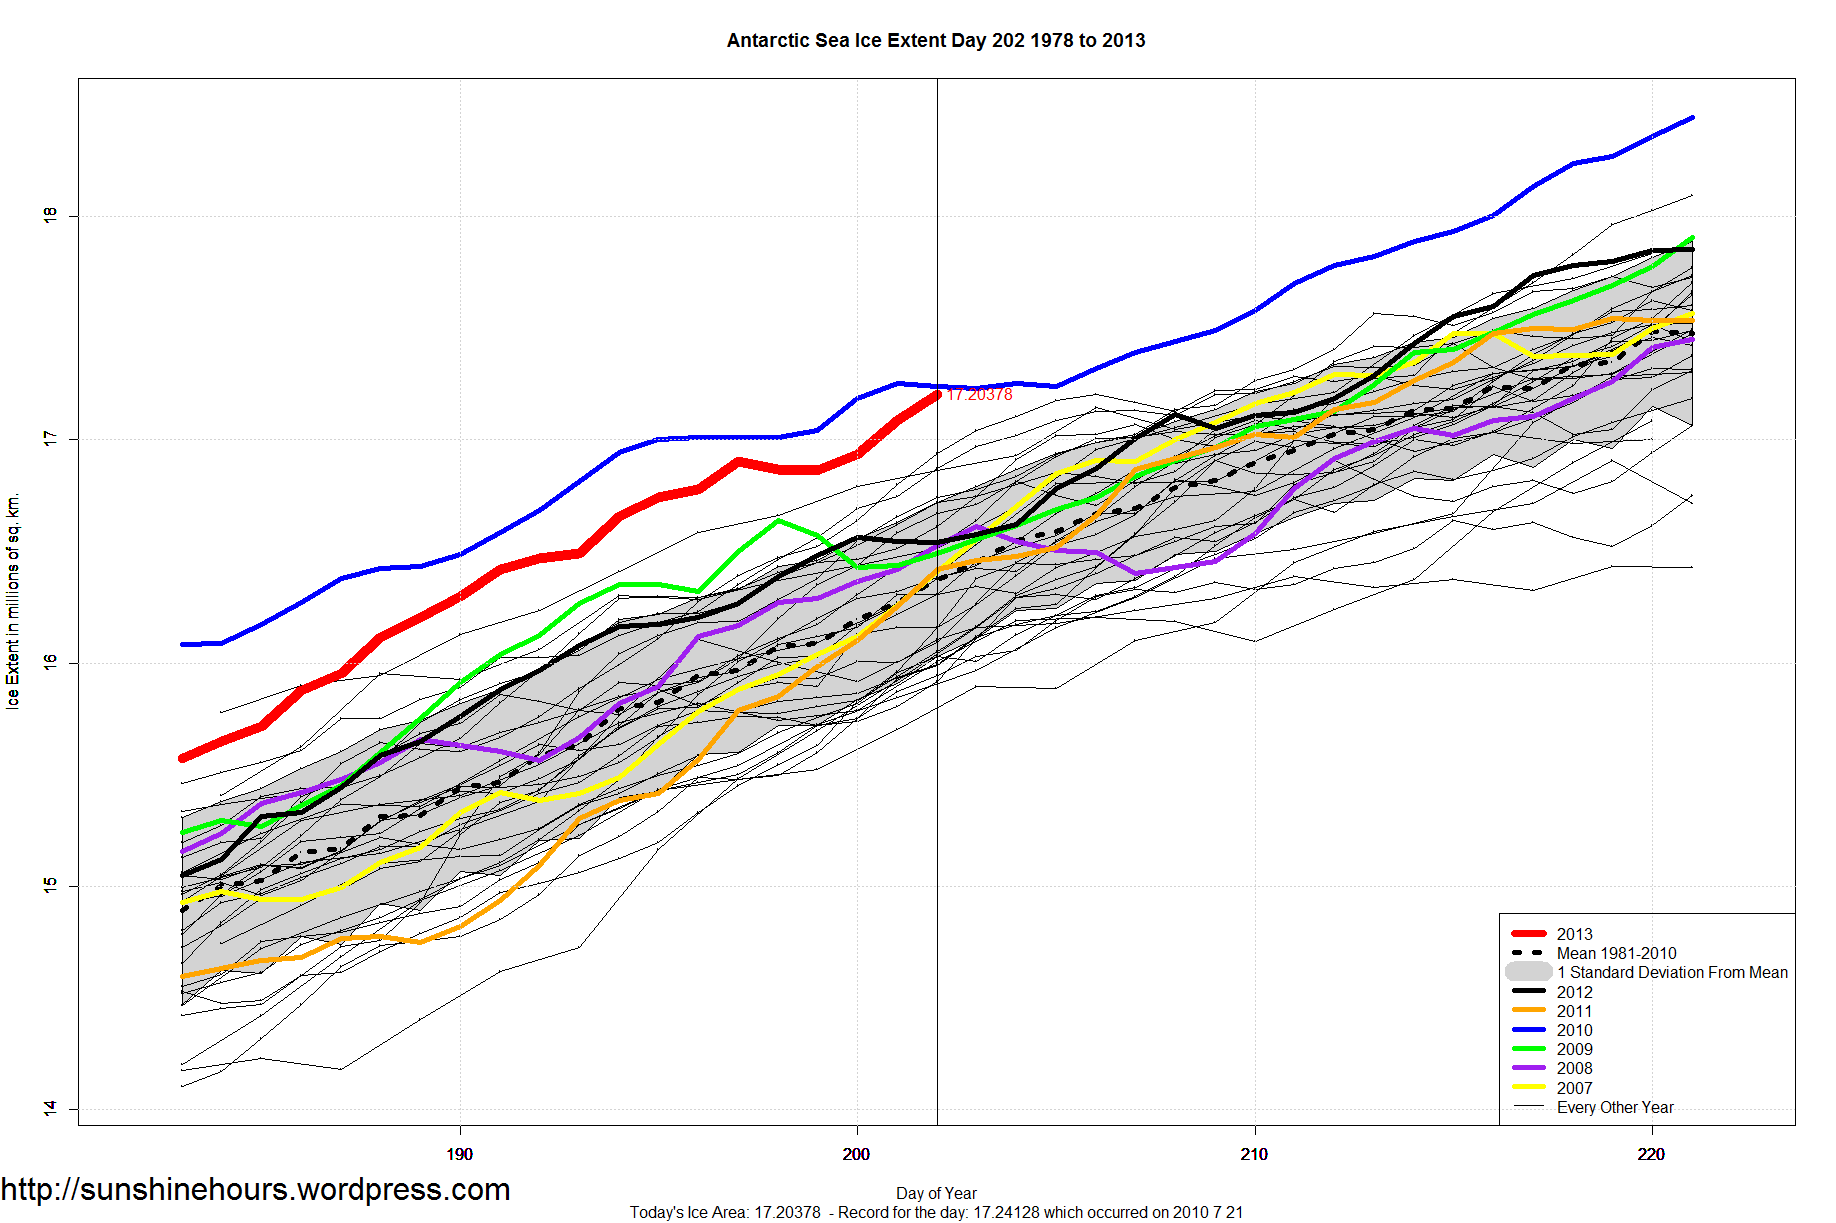
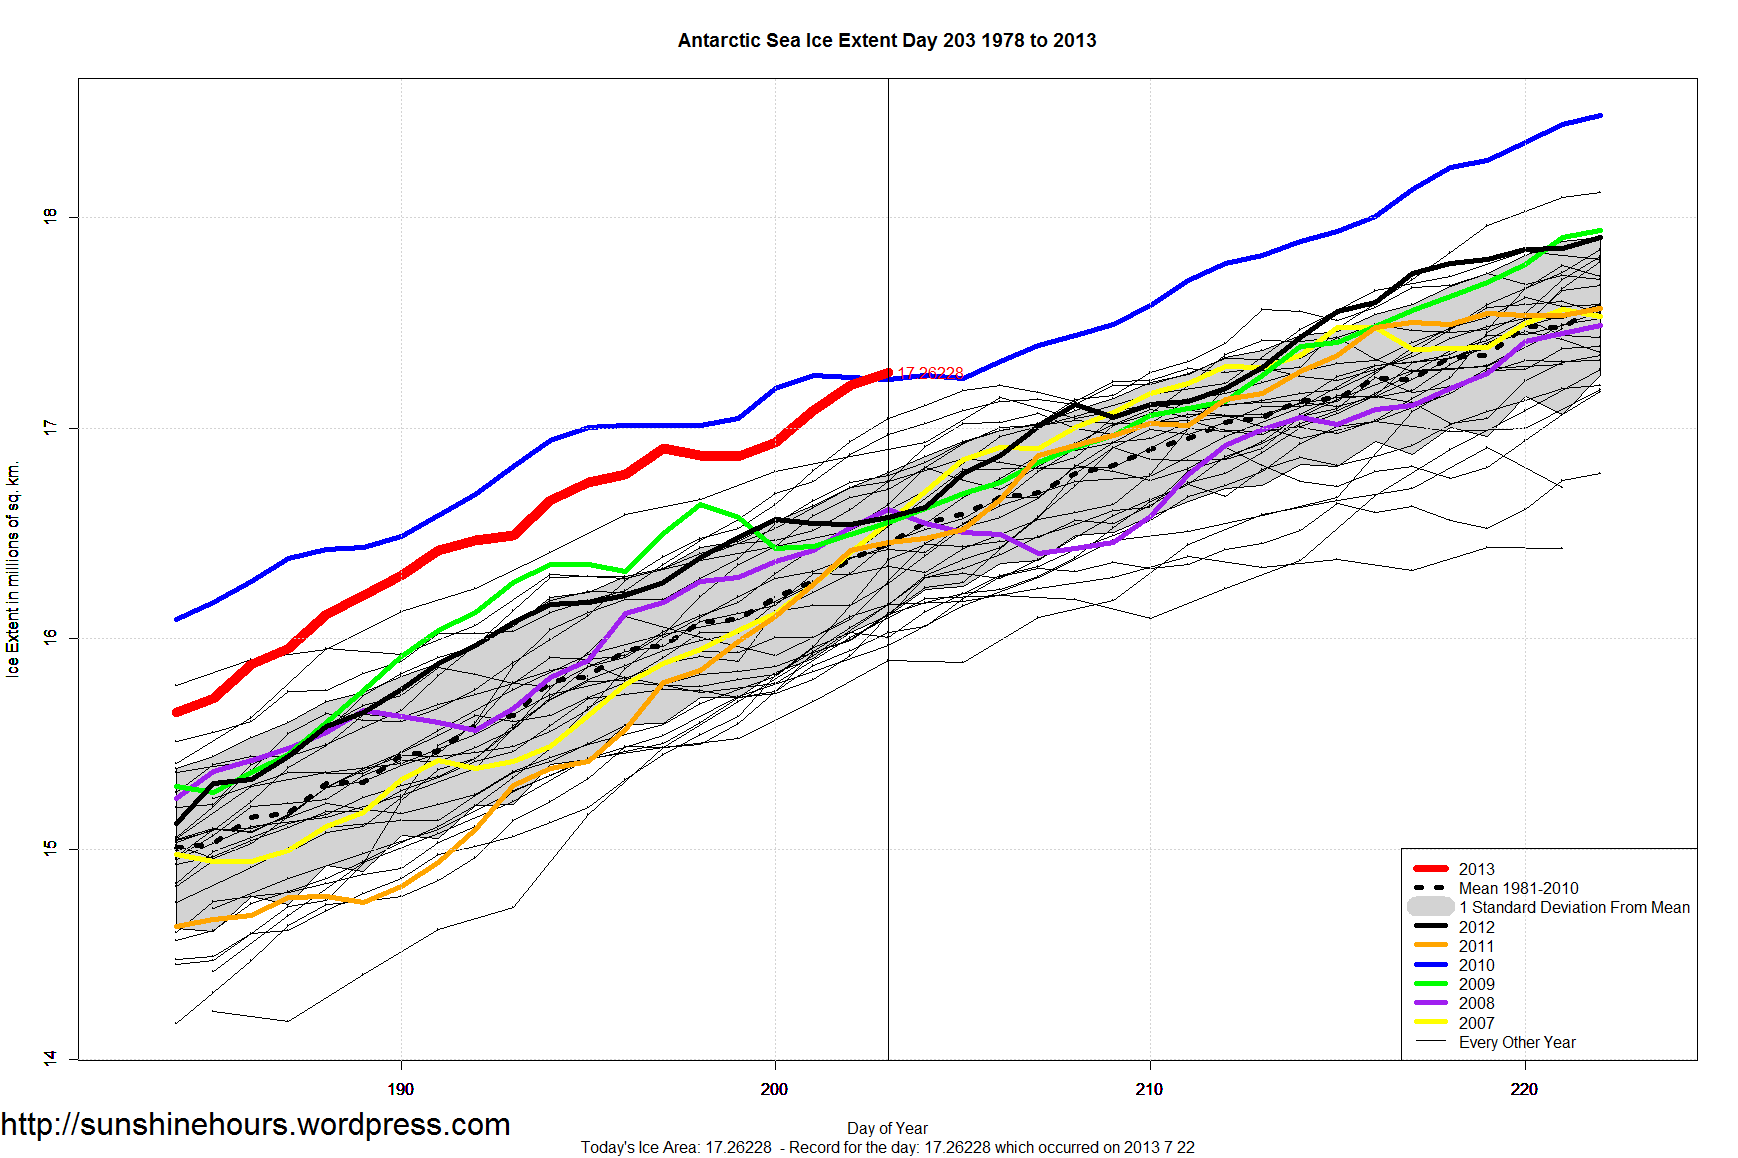
Antarctic Sea Ice Extent Set a Record on Day 203 of 17.26 million sq km on July 22.
Sea Ice is 811,000 sq km above the 30 years average.
This is the 11th daily record for 2013.
| Year | No of Records |
| 2010 | 128 |
| 2008 | 125 |
| 2006 | 27 |
| 2012 | 27 |
| 2007 | 21 |
| 2013 | 11 |
| 2009 | 8 |
| 2004 | 5 |
| 1998 | 4 |
| 2000 | 4 |
| 2005 | 3 |
| 1979 | 2 |
| 1980 | 1 |
UPDATE: Record was set the next day. Read about it here.
Antarctic Sea Ice Only 37,000 sq km short of record. That is only 0.21% short of a record. Click image for bigger.